www.ijiset.com
A Study on an Ultrasonic Flow Meter
Deok-Woo Park1 , Shang-Yoon Hwang2 , Chungyong Kim3 and Gyu-Sik Kim4*
1,3,4
Department of Electrical and Computer Eng., University of Seoul, Seoul, 130-743, Korea
2 Fluid Flow Research Center of CMENTECH CO. LTD., Gyonggi-do, 13438, Korea
* Corresponding author : Gyu-Sik Kim ([email protected])
Abstract
An ultrasonic flow meter is a type of flow meter that measures the velocity of a fluid with ultrasound to calculate volume flow. In this paper, through the test of flowmeter installation effect, a very stable ultrasonic transit time measurement was achieved. Further, by designing the measuring tube as a contraction of the square pipe conduit, a very stable flow measurement was realized, of which details of contribution to the performance was confirmed through a test.
Keywords: Ultrasonic flow meter, fluid flow, transit time, square pipe, contraction with stable flow profile
1. Introduction
An ultrasonic flow meter is a type of flow meter that measures the velocity of a fluid with ultrasound to calculate volume flow. Using ultrasonic transducers, the flow meter can measure the average velocity along the path of an emitted beam of ultrasound, by averaging the difference in measured transit time between the pulses of ultrasound propagating into and against the direction of the flow or by measuring the frequency shift from the Doppler effect. Ultrasonic flow meters are affected by the acoustic properties of the fluid and can be impacted by temperature, density, viscosity and suspended particulates depending on the exact flow meter. They vary greatly in purchase price but are often inexpensive to use and maintain because they do not use moving parts, unlike mechanical flow meters. There are three different types of ultrasonic flow meters. Transmission (or contra-propagating transit-time) flow meters can be distinguished into in-line (intrusive, wetted) and clamp-on (non-intrusive) varieties. Ultrasonic flow meters that use the Doppler shift are called Reflection or Doppler flow meters. The third type is the Open-Channel flow meter.
Time transit flow meter : Ultrasonic flow meters measure the difference of the transit time of ultrasonic pulses propagating in and against flow direction. This time difference is a measure for the average velocity of the fluid along the path of the ultrasonic beam. By using the absolute transit times both the averaged fluid velocity and the speed of sound can be calculated.
Doppler shift flow meters : Another method in ultrasonic flow metering is the use of the Doppler shift that results from the reflection of an ultrasonic beam off sonically reflective materials, such as solid particles or entrained air bubbles in a flowing fluid, or the turbulence of the fluid itself, if the liquid is clean. Doppler flow meters are used for slurries, liquids with bubbles, gases with sound-reflecting particles. This type of flow meter can also be used to measure the rate of blood flow, by passing an ultrasonic beam through the tissues, bouncing it off a reflective plate, then reversing the direction of the beam and repeating the measurement, the volume of blood flow can be estimated. The frequency of the transmitted beam is affected by the movement of blood in the vessel and by comparing the frequency of the upstream beam versus downstream the flow of blood through the vessel can be measured. The difference between the two frequencies is a measure of true volume flow. A wide-beam sensor can also be used to measure flow independent of the cross-sectional area of the blood vessel.
Open channel flow meters : In this case, the ultrasonic element is actually measuring the height of the water in the open channel; based on the geometry of the channel, the flow can be determined from the height. The ultrasonic sensor usually also has a temperature sensor with it because the speed of sound in air is affected by the temperature.
There have been a lot of researches toward performance improvement of fluid ultrasonic flow meters [1-8]. In [1], it is shown that the pulse-phase bi-directionality ultrasonic flow meter integrated in a microprocessor-based electronics package can achieve very good performance. In [2], the flow visualization studies have been undertaken for the case of an in-line, ultrasonic transducer housing in a
cylindrical cross-section metering duct by direct
than five million. In [4], a new technique is proposed that enables the measurement of the velocity vector in multi-dimensions on a line of the flow field. A system to achieve this goal was developed based on the ultrasonic velocity profiling by using multiple transducers. In [5], a detailed theoretical signal model describing the interaction of sound waves in random continuum and turbulent media had been presented. In [6], it describes design and development of low cost automatic water flow meter which supplies only required amount of water to the crops saving water as well as energy. In [7], it contains review on some important developments of transit time ultrasonic flow meters particularly to improve the accuracy. In [8], some experimental measurements were performed to obtain the specific values of the flow rate measurement uncertainty using the ultrasonic Doppler velocity profile (UVP) method under disturbed flow conditions.
In this paper, through the test of flow meter installation effect, a very stable ultrasonic transit measurement was achieved. Further, by designing the measuring tube as a contraction of the square pipe conduit, a very stable flow measurement was realized, of which details of contribution to the performance was confirmed through a test.
2. Development of a Small Diameter Ultrasonic Flow
Meter
For a transit time ultrasonic flow meter, both transducers serve alternately as transmitter and receiver of ultrasonic waves. This type of meter measures the difference in travel time for pulses transmitted against the flow and pulses transmitted in the direction of the flow rate as shown in Fig. 1.
The two transducers are mounted on the outside of the pipe so that one is a known distance upstream of the other. A pulse will be transmitted by the downstream transducer, for example, and it will be detected by the upstream transducer, giving the 'transit time' for upstream flow. Then the process will be reversed and the upstream transducer will transmit a pulse to be detected by the downstream transducer, to give a 'transit time' in the direction of flow. A microprocessor is typically used to calculate the pipe flow rate based on the difference between the downstream transit time and the upstream transit time.
The flow computer was designed with low power based circuits and parts as it is required to drive in super low power and was implemented with the use of SMD (Surface Mound Device). ARM Cortex-M3 based STM32F103 was used as the main processor responsible for interface, of which block diagram is shown in Fig. 2.
Fig. 1. Installation of a transit time ultrasonic flow meter
Fig. 2. Block diagram of STM32F103
www.ijiset.com
Fig. 3. Analogue driving part circuit
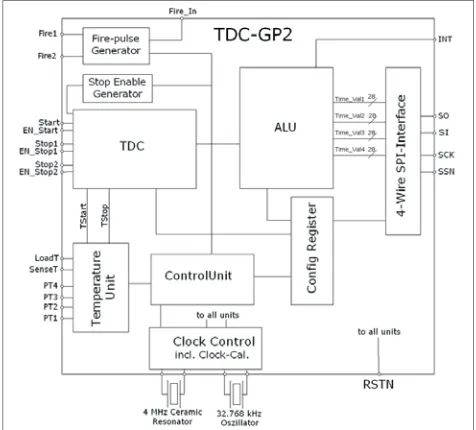
Fig. 4TDC-GP2 block diagram
The circuit using TDC was structured as Fig. 5. The signal, pre-processed through analogue circuit, is entered into TDC processor which is then directly connected to the STM32F103 main processor for control. Through this, velocity measuring capacity at the velocity greater than 0.01 ms was tested. Fig. 5 shows the structure of circuits that operate TDC. Overall, SMD parts were used in the board production. For easy maintenance of the product, total of 3 modules were produced including process board, analogue board, and interface board, with each being connected through exclusive connectors. The actual performance was tested using the completed board and measuring tube. The flow scope was based on 25D, 50D and grade 2 deviation, and the starting flow was also examined.
Fig. 5 TDC driving circuit diagram
3. Experimental Results
In order to evaluate the characteristics of flow part in an ultrasonic flow meter, the facilities of an internationally approved correctional institute was utilized. The scope of
flow measurement was (0.06∼2000) m3/h and CMC
uncertainty of the system was 0.37 % (k=2.0). Water was used as the test fluid of which temperature was kept (18∼25) ℃, during use. Fig. 6 is the schematic design of the related devices.
Fig. 6 Schematic diagram of liquid flow meter appliance
As one of the methods of verifying the accuracy of performance measurement of an ultrasonic flow meter, a test was conducted on velocity as it is proportional to transit time difference. Accurate and stable measurement of time is the most crucial factor of the ultrasonic time measurement method. It is inevitable that various changes are accompanied depending on factors such as signal shape, circuit noise and fluid condition in test sites. Since achieving measurement stability at the velocity suggested
within ±5 % usually requires a level below 0.1∼ 0.2 ㎱,
angle and the velocity of sound was 1435.86 m/s was acquired, of which result is shown in Fig. 7. The result was approximately within ±0.05 ㎱.
Fig. 7 Time measurement result test, Y=∆t (ns)
The increase in the velocity value caused by the change in ultrasonic flow meter cross section was compared 1:1 with the round flow meter by letting the fluid through. It is a case of square pipe inscribed in the diameter of which flow increase effect is shown as the change from Table 1 to 2. This is greatly affected by the inevitable limitation that was intended for easy contraction from a round pipe to a square one in the initial stage of development.
Table 1 shows the velocity value calculated based on the scope of flow from Korea Heating specification. V(start), the velocity at start flow, has a value of 0.06 m/s at approximately 0.02 m/s whereas v(s), the velocity at the overload flow, increases up to approximately 5.7 m/s.
Table 1. Reference velocity calculation in 25 times magnification (Unit: m/s)
diameter velocity (m/s)
start v(i) v(p) v(s)
50 0.04 0.08 2.12 4.24
65 0.03 0.08 2.09 4.19
80 0.02 0.10 2.49 4.97
100 0.02 0.10 2.48 4.95
125 0.02 0.09 2.26 4.53
150 0.03 0.09 2.36 4.72
200 0.02 0.09 2.21 4.42
250 0.06 0.11 2.83 5.66
As a result of producing a contraction of the round pipe, cross section contraction and velocity increase occurred.
Table 2. Velocity increase rate according to change in cross section area by diameter
The ultrasonic flow meter cross section gradually contracts from round pipe to square pipe. At this time, the contraction rate and contraction angle may slightly vary. However, the ultrasonic circuit is equally distributed and placed on the square contraction surface with 150 mm diameter which is large enough to safely estimate the flow distribution in order to describe velocity value by height. At this time, the circuit placement converts the flow with reflected signals so that the cosine effect components are naturally compensated.
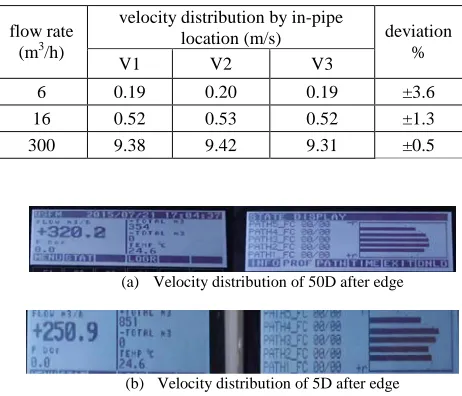
Table 3. Velocity distribution of 150 mm ultrasonic flow meter (Double elbow pipe configuration after edge 0D)
flow rate (m3/h)
velocity distribution by in-pipe
location (m/s) deviation %
V1 V2 V3
6 0.19 0.20 0.19 ±3.6
16 0.52 0.53 0.52 ±1.3
300 9.38 9.42 9.31 ±0.5
(a) Velocity distribution of 50D after edge
(b) Velocity distribution of 5D after edge
Figure 8. Velocity distribution of double elbow pipe configuration after edge (5D)
It was observed that, regardless of the change in flow rate, the velocity distribution status at double elbow pipe configuration after edge 0D was stable at relative deviation of ±3.6 %.
diameter
square pipe size (horizontal and
vertical)
cross section contraction
rate
velocity increase rate
40A
35×35 ㎜
2.52 % 2.58 %
50A 37.6 % 60.29 %
65A 63.1 % 170.80 %
80A
64×64 ㎜ 18.5 % 22.72 %
100A 47.9 % 91.75 %
125A
94×94 ㎜ 28.0 % 38.88 %
www.ijiset.com
4. Conclusions
Through the test of flow meter installation effect, a very stable ultrasonic transit measurement was achieved. Further, by designing the measuring tube as a contraction of the square pipe conduit, a very stable flow measurement was realized, of which details of contribution to the performance was confirmed through a test. The shape of the reduction pipe was naturally reduced from round to square, which brought about reduction of the valve effect caused by the changes in the ultrasonic flow meter cross section from round to square as well. This created a type of wing in the fluid flow that is assumed to perform two functions, which are rectification of the rotating components and the rectification of the asymmetric velocity distribution as the velocity increases. Also, a comparison test was made on the square pipe conduit and round pipe conduit, from which it was concluded that the square pipe conduit is superior in error performance in small diameter than the round counterpart.
Acknowledgments
This work was also supported by the National Research Foundation of Korea (NRF) grant funded by the Korea government (MSIP) (No. 2016011249).
References
[1]Bozidar Dimitrijevic, Velizar Pavlovic, “Ultrasonic fluid flow measurement methods, an overview,” Electronics and Energetics, Vol.8, No.2, pp.299-315, 1995
[2]Neil C. Temperley, Masud Behnia, Anthony F. Collings, “Flow patterns in an ultrasonic liquid flow meter,” Flow Measurement and Instrumentation, Vol.11, pp.11-18, 2000 [3]Kenichi Tezuka, Michitsugu Mori, Takeshi Suzuki,
Toshimasa Kanamine, “Ultrasonic pulse-Doppler flow meter application for hydraulic power plants,” Flow Measurement and Instrumentation, Vol.19, pp.155-162, 2008
[4]Hironari Obayashi, Yuji Tasaka, Seiji Kon, Yasushi Takeda, “Velocity vector profile measurement using multiple ultrasonic transducers,” Flow Measurement and Instrumentation, Vol.19, pp.189-195, 2008
[5]R Velmurugan, P Rajalakshmy, “Ultrasonic flowmeter using cross-correlation technique,” International Journal of Computer Applications, Vol.66, No.10, pp.19-22, March 2013
[6]Ria Sood, Manjit Kaur, Hemant Lenka, “Design and development of automatic water flow meter,” International Journal of Computer Science, Engineering and Applications, Vol.3, No.3, June 2013
[7]G. Rajita, Dr.Nirupama Mandal, “Review on transit time ultrasonic flowmeter,” 2nd International Conference on Control, Instrumentation, Energy & Communication, 2016 [8]Sanehiro Wada, Noriyuki Furuichi, “Influence of obstacle
plates on flow rate measurement uncertainty based on
ultrasonic Doppler velocity profile method,” Flow Measurement and Instrumentation, Vol.48, pp.81-89, 2016
Deok-Woo Park was born in Korea, in 1973. He received the B.S. degree in 1999 from the Dept. of Electrical Eng., University of Hanyang,
Korea. He received the M.S. degree in 2006 from the Dept. of Electrical
and Computer Eng., University of Seoul, Korea. He is a Ph.D. student of the Dept. of Electrical and Computer Eng., University of Seoul, Korea. He works for Korea Testing Certification Institute.
Shang-Yoon Hwang was born in Korea, in 1967. He received the B.S. degree in 1989 from the Dept. of Physics, University of Konkuk. He received the M.S. degree in 1991 from the Dept. of Physics, University of Konkuk. He works for CMENTECH Co. Ltd.
Chungyong Kim was born in Korea, in 1991. He is an undergraduate junior in the Dept. of Electrical and Computer Eng., University of Seoul, Korea.