Volume 2006, Article ID 67960, Pages1–16 DOI 10.1155/ASP/2006/67960
A Robust Formant Extraction Algorithm Combining
Spectral Peak Picking and Root Polishing
Chanwoo Kim,1Kwang-deok Seo,2and Wonyong Sung3
1School of Computer Science, Carnegie Mellon University, Pittsburgh, PA 15213-3891, USA
2Computer and Telecommunications Engineering Division, Yonsei University, Wonju, Gangwon 220-710, Korea 3School of Electrical Engineering and Computer Science, Seoul National University, Gwanak-gu, Seoul 151-744, Korea
Received 22 September 2004; Revised 27 July 2005; Accepted 22 August 2005
Recommended for Publication by Ulrich Heute
We propose a robust formant extraction algorithm that combines the spectral peak picking, formants location examining for peak merger checking, and the root extraction methods. The spectral peak picking method is employed to locate the formant candi-dates, and the root extraction is used for solving the peak merger problem. The location and the distance between the extracted formants are also utilized to efficiently find out suspected peak mergers. The proposed algorithm does not require much computa-tion, and is shown to be superior to previous formant extraction algorithms through extensive tests using TIMIT speech database.
Copyright © 2006 Hindawi Publishing Corporation. All rights reserved.
1. INTRODUCTION
The formant is one of the most important features in speech signals,and is used for many applications, such as speech recognition, speech characterization, and synthesis. Previ-ous formant extraction methods can largely be classified into spectral peak picking, root extraction, and analysis by syn-thesis [1–4]. The spectral peak picking methods and their variants have been widely used for a long time because of low computational complexity, but they often seriously suffer from the peak merger problems [1–3], where two adjoining formants are identified into a single one. The root extraction methods try to find out all the locations of roots by solving a prediction-error polynomial obtained from linear prediction coefficients (LPC), which obviously requires much computa-tion [5]. An efficient method for evaluating the pole locations by iteratively computing the number of poles in a sector in thez-plane has been reported in [2]. However, the accuracy of the root extraction methods can hardly be high because it is not always clear to determine whether a root obtained forms a formant or just shapes the spectrum [5].
In this paper, we propose a new formant extraction algo-rithm that conjoins the spectral peak picking method and the root polishing scheme. In the proposed algorithm, the for-mant candidates are found by using the spectral peak picking method. Later, the possibility of peak mergers for each peak is examined using the screening condition among the formant frequencies of speech. As for the suspected peaks, the number
of poles forming each peak is evaluated using Cauchy’s inte-gral formula. If the number of poles constituting a spectral peak is two, then the root polishing is conducted for separat-ing the merged formants.
In this study, we used the TIMIT core test set, a widely known speech database, to compare the performance of dif-ferent extractors [6]. For this purpose, we used the phone lo-cation information from TIMIT label files and compared the extracted formant values for a specific phone with the for-mant distribution of English vowel phonemes described in [7].
The organization of this paper is as follows: inSection 2, previous works on formant extraction methods are briefly reviewed and discussed. InSection 3, we explain characteris-tics of merged formants.Section 4introduces the proposed robust formant extraction algorithm.Section 5includes sev-eral core experimental results to prove the robustness of the proposed algorithm. We end with the concluding remarks in
Section 6.
2. REVIEW OF THE PREVIOUS WORKS
110 100 90 80 70 60 50
Shor
t-t
er
m
amplitude
spect
ru
m
(dB)
0 500 1000 1500 2000 2500 3000 3500 4000 Frequency (Hz)
(a)
110 100 90 80 70 60 50
LP
-der
iv
ed
amplitude
spect
ru
m
(dB)
0 500 1000 1500 2000 2500 3000 3500 4000 Frequency (Hz)
(b)
Figure1: (a) Short-term amplitude spectrum, and (b) LP-derived amplitude spectrum of “ae” sound.
model in detail. Since the vocal tract itself is a tube with a varying cross-sectional area, it has resonant frequencies like any other tubes. These resonances are called formants, and the frequencies at which they occur are often referred to as the formant frequencies. We will explain the spectral peak picking, root extraction, and analysis-by-synthesis methods, which are the three large categories of formant extraction methods as stated inSection 1. It is an established fact that in most cases, the vocal tract system can be modeled as an all-pole system [1,5]. Thus, the vocal tract systemHv(z) can be appropriately modeled as follows:
Hv(z)=I Gv
k=0αkz−k
, (1)
whereGvis the gain factor. In this equation, we use the sub-scriptvto denote the vocal tract system.
More importantly, it has been established by previous re-search that the coefficientsαk, 0≤k ≤I, are suitably mod-eled by LP coefficients [1]. Thus, by computing LP coeffi -cients, we can model the vocal tract and obtain information on formants.
2.1. Spectral peak picking method
The spectral peak picking method and its variants have been widely used for formant extraction [1–5, 8–10]. In most cases, instead of the short-term spectrum itself, smoothed spectra, such as linear prediction (LP) spectrum or cepstrally smoothed spectrum are often employed [1,3,5]. However, LP spectra are more often used for this purpose, since they show conspicuous peaks. Additionally, it has been verified that the prediction-error polynomial obtained from LP co-efficients is closely related to the vocal tract filter, which
gen-erates the formants [1,5].Figure 1(a)shows the short-term spectrum of the “ae” sound, andFigure 1(b)illustrates the LP spectrum of this signal.
Here, we will briefly explain how the LP spectrum is computed, and how formant frequencies are obtained from this spectrum. Let us denote LP coefficients of a short-term speech signal byak, 0 ≤k ≤NLP, whereNLP is the
predic-tion order. From these LP coefficients, we can construct the following prediction-error filter:
A(z)=
NLP
k=0
akz−k. (2)
As mentioned above, previous studies show that the vocal tract filter is modeled as an all-pole system, and the vocal tract filter in (1) can be obtained from the prediction-error filter in (2) which is also known as the inverse filter (IF) [5,
10].
By performing FFT of sufficient order like 256 or 512, on the zero-padded LP coefficients, we can obtain a reasonable amplitude spectrum of the vocal tract system shown in (1).
2.2. Root extraction method
Formant extraction using the root extraction method is ex-plained in several texts and papers [1,2,5]. In this method, like the spectral peak picking method, we first compute linear prediction (LP) coefficients and obtain the prediction-error filterA(z). Comparing with (1), we can easily find that the roots of this polynomialA(z) correspond to the poles of the vocal tract system. Thus, we can obtain candidates for for-mants by solvingA(z)=0, using numerical methods.
When poles are kept sufficiently apart, and one of these poles,z = r0ejφ0, forms a formant, the formant frequency F, and the formant bandwidthBcan be represented by the following equations [1]:
F= fs
2πφ0, (3)
B= −fs
π ln
r0
, (4)
wherer0is the magnitude of the pole,φ0is the phase of the
pole, fsis the sampling frequency,Fis the formant frequency, andBis the 3-dB formant bandwidth. Thus, if we find the roots of the prediction-error polynomial, we can obtain the formant frequencies using (3). In addition, we can get the bandwidth information from (4).
However, as mentioned earlier, there are several inherent problems in obtaining formant frequencies using the root ex-traction algorithm. Firstly, and most importantly, it is very difficult to tell whether an obtained root just shapes the spec-trum or actually contributes to forming a formant [5]. If we use an LP order of 14 in obtaining A(z), then there may be up to seven complex conjugate root pairs. Among these seven root pairs, we need to select three root pairs if we want to obtain the first three formant frequenciesF1,F2, andF3.
Therefore, the root extraction method is not as reliable as the spectral peak picking method. Secondly, obtaining roots ofA(z) requires very high computational complexity. So, in most cases, this method is not used in real-time implemen-tation, but for research purposes [5].
When we perform polynomial roots solving, first we can employ numerical algorithms such as Laguerre’s method, Muller’s method, the Eigenvalue method, and so on. It is computationally burdensome to obtain all the roots using one of these methods. To reduce the computational amount when a single rootz = z0of a polynomial is obtained, we
deflate the original polynomial by (z−z0) and recursively
apply the roots solving algorithm. However, when deflat-ing, round-offerror often occurs and it can be accumulated. Thus, the obtained roots cannot be quite accurate. To al-leviate this problem, after all of the approximate roots of A(z) = 0 are identified, we further polish roots which will be described inSection 2.4.
2.3. Analysis-by-synthesis method
In the analysis-by-synthesis method, we construct a syn-thetic spectrum and try to obtain minimized errors between the synthetic spectrum and the actual spectrum. The syn-thetic spectrum is obtained using the approximated formant
frequencies. Thus, if the differences between the synthetic spectrum and the actual spectrum are very small, the ap-proximated formant frequencies are close to the actual for-mant frequencies. Analysis-by-synthesis approximations are performed iteratively as follows: firstly, we obtain a rough es-timation on formant frequencies. Secondly, using these esti-mated values, we obtain more accurate values that can reduce the above-mentioned differences between the synthetic and the actual spectra. This process is performed using some sys-tematic procedures, like dynamic programming. After that, if the spectral distance is still larger than a predefined constant, then the second step is repeated. The algorithms introduced in [4,12] describe variants of the analysis-by-synthesis type of formant extractors.
2.4. Root polishing algorithm
As previously mentioned inSection 2.2, roots obtained from the typical roots solving method and the deflation scheme of-ten suffer from accumulated round-offerrors [13,14]. These errors accumulate when successive deflation steps are ap-plied. So, accompanied with the roots solving procedure, root polishing is generally performed to obtain more accu-rate values. The root polishing algorithm works as follows [13]:
(1) Initialization: obtain an approximate rootz=z0, using
the roots solving method described inSection 2.2. Setn=0.
(2) Recursion: repeat (2-a), (2-b), and (2-c) untiln≤N0,
whereN0is the iteration limit.
(2a) obtainzn+1by
zn+1=zn− A
zn
Azn, (5)
whereA(z) is the prediction-error polynomial shown in (2),
(2b) test whether the following stopping condition (6) is met. If so, terminate.
zn+1−zn< ε, (6)
(2c) setn=n+ 1.
(3) Termination: takezn+1as the polished root.
Unlike most root solving methods, the Newton-Raphson algorithm shows quadratic convergence [14]. Thus, the pol-ishing step requires far less computation compared to the roots solving step. We can obtain polished roots with the re-quired accuracy by adjusting the tolerance in (6). If the ap-plication requires more accuracy, then we need to adopt a smaller value forε. Anεvalue of 10−4is generally suitable for
reliably obtaining formant frequencies.
3. CHARACTERISTICS OF MERGED FORMANTS
the magnitude of the poles when these poles form formants. Previous research shows that some of the poles of the vocal tract system filter just shape the spectrum without a direct re-lation to formants [5]. Using information on the bandwidths of formants, we will derive conditions in which poles form formants. And the other condition is related to the phase dif-ference of two adjacent poles when peak merger occurs. Al-though the derivation process tells us that these conditions are necessary, there may be rare exceptions to the obtained condition, since these conditions are based on assumptions obtained from experimental results by Dunn [15]. As estab-lished by previous research, two peaks that are quite close to each other are sometimes merged and appear to be a single peak. As mentioned previously, this is one of the most diffi -cult problems occurring when we use the spectral peak pick-ing method to extract formants. In the proposed system, the peak merger problem is resolved by inspecting the number of poles around the suspected peak using Cauchy’s integral, and subsequently applying the root polishing scheme, which will be described inSection 4. For this purpose, we need to define a region, in thez-domain, where we will employ these pro-cedures. Based on the phase difference information on the merged poles that is derived in this section, we can set an ap-propriate inspection region. Consequently, we only need to inspect poles inside this inspection region, where two poles may result in a single peak. These two conditions, derived in this section, are incorporated in the proposed system in order to efficiently separate a merged peak into two distinct peaks.
3.1. Magnitude condition for forming a formant
It is obvious that a pole whose magnitude is close to 1 will likely form a formant, while one that is far from 1 will not. A condition on the magnitude of a pole that can form a spectral peak can be derived as follows. From (4), we can establish the following relationship:
rmin,i=exp
− π
fsBmax,i
, (7)
whereBmax,iis the maximum bandwidth for theith formant, andrmin,iis the minimum magnitude of a pole that is related to theith formant.
Previously, Dunn investigated into the range of formant bandwidths [15]. From his research, it is known that the maximum formant bandwidths ofF1,F2, andF3are 160 Hz,
200 Hz, and 300 Hz, respectively. In the case of an 8 kHz sam-pling rate, we obtain the following results:
rmin,1=0.9391, rmin,2=0.9245, rmin,3=0.8889.
(8)
However, previous research shows that there exists sig-nificant variability in vowel formant characteristics. Addi-tionally, in deriving (8), the effects of any nearby poles are ignored. Considering these facts, we should allow more tol-erance to (8) for guaranteeing a more reliable condition. Af-ter repeated experiments, we obtained the following as a new
π
−56π −2π
3
−π 2
−π3 −π
6 0 Re π 6 π 3 Im π 2 2π
3 5π
6
1
0.6 0.4 0.2
Figure2: Distribution of poles in speech frames.
condition:
0.8≤r <1.0. (9)
In the above equation, the inequality ofr <1.0 is added due to the stability requirement on poles.
As shown in the following sections, this condition is em-ployed to decide whether a pole obtained by root polishing is related to an actual formant. Note that this condition is not a sufficient condition, but a condition based on experimen-tal results where a pole forms a formant. Thus, it cannot be used as an absolute decision rule. Admittedly, in deriving this condition, we used the experimental results on the formant bandwidths obtained by Dunn [15]. Thus, there may still ex-ist some exceptions to this constraint (9). However, investi-gation into actual speech signals revealed that there seldom are such exceptions. However, by using constraint (9), we can reduce possible errors of obtaining fallacious formants. The distribution of poles of 726 frames in thez-domain is depicted in Figure 2. While many poles are satisfying (9), some of them are not. From this result, we can conclude that the latter poles are probably not directly related to the ac-tual formants. In this figure, we also find the fact that, poles in the high-frequency region generally have smaller magni-tudes, which complies with (8).
3.2. Phase condition for a peak merger
In this section, we will derive a condition on the phase dif-ference between two poles under the following condition: two poles are directly related to two distinct formants and, at the same time, these two formants appear as a single-merged peak in the linear prediction (LP) spectrum.
Generally, the magnitude of the vocal tract system is modeled by the following equation [5]:
Hv
ejω= Gv
N k=0
1−pke−jω, (10)
Im 1
Unit circle
p2
p1
φ2
φ1
r r
1
0 Re
Figure3: Two poles in thez-domain.
kth pole of the system. In this equation,ωdenotes the nor-malized angular frequency, defined asω=2π(f /Fs), where f is the continuous-signal frequency,Fsis the sampling rate. Without loss of generality, let us consider a case where two poles, p1 = r1ejφ1 and p2 = r2ejφ2 in (10), incur a
peak merger problem.Figure 3shows the location of these two poles inz-domain. As stated previously, a peak merger problem occurs when two distinct formants are merged into a single peak. It follows that p1 and p2 are the poles that
form two distinct formants, even though they may appear as a single peak in the LP spectrum. Since these two poles are directly related to distinct formants, they should satisfy the constraint of (9). As shown by a lot of previous research, the peak merger occurs when these poles are very close to each other, which means that the phase difference between these two poles is small. Accordingly, in the vicinity of these two poles, (10) can be approximated by the following two-pole system:
Hv
ejω≈ Gv
1−r1ejφ1e−jω1−r2ejφ2e−jω
, (11)
whereGvis the gain of this modified system.
Additionally, some scrutiny on the spectrum shape re-veals that the largest phase difference is obtained when each peak has the largest possible bandwidth. From (4), we find that it implies the smallest possible value ofr. Thus, we ob-tain the largest phase difference when both magnitudes of the poles are the same and they have the minimum possible value forr. From this fact, we can substituter1andr2in (11) with
a common valuer.
Consequently, the magnitude function of the system function can be represented as shown in (12) by some arith-metic
Hvejω
= Gv
1 +r2−2rcosω−φ 1
1 +r2−2rcosω−φ 2
,
(12)
whereωis a normalized frequency of the sampled discrete-time signal. Real poles cannot constitute the actual formants, as can be seen in (3). Thus, poles that form formants should exist in complex conjugate pairs. Without loss of generality, we will consider two poles with positive phases in (12) since, as mentioned previously, we consider the range of−π≤ω≤
πin the following derivation.
In deriving (12) from (11), we used the property that
|Hv(ejω)| =Hv(ejω)H∗
v(ejω).
If the peak merger occurs, (12) should have a single max-imum value. The condition for this can be derived by diff er-entiating the square of the reciprocal of (12) with respect to ωand, examining whether the number of roots of this deriva-tive is one. The derivaderiva-tive of the squared value of (12) is as follows:
d dω
G2 v Hvejω2
= d
dω
1 +r2−2rcosω−φ 1
×1 +r2−2rcosω−φ2
=2rsinω−φ1
1 +r2−2rcosω−φ 2
+ 2rsinω−φ2
1 +r2−2rcosω−φ 1
=2r1 +r2sinω−φ 1
+ sinω−φ2
−2rsinω−φ1
cosω−φ2
+ cosω−φ1
sinω−φ2
.
(13)
We can further simplify (13) by the addition and the mul-tiplication properties of trigonometric functions into:
d dω
G2 v Hvejω2
=4r2 1 +r2
r sin
ω−φ1+φ2
2
cos
φ2−φ1
2
−sin
2
ω−φ1+φ2
2
=8r2sin
ω−φ1+φ2
2
1 +r2
2r cos
φ2−φ1
2
−cos
ω−φ1+φ2
2
. (14)
Close scrutiny shows that (14) has one to three roots in the range of 0 ≤ ω ≤ π, because 0 ≤ (φ1+φ2)/2 ≤ π
as assumed previously. Specifically, from the equation of sin(ω−(φ1+φ2)/2)=0, we can always obtain one root in
the range of 0≤ω≤π. If ((1 +r2)/2r) cos((φ
2−φ1)/2)<1,
then we can find out that|Hv(ejω)2|has two maximum
val-ues at (φ1+φ2)/2±cos−1(((1 +r2)/2r) cos((φ1−φ2)/2)) and
a single minimum value atω=(φ1+φ2)/2. This case
106 104 102 100 98 96 94 92
A
m
plitude
spect
ru
m
(dB)
0 0.1 0.2 0.3 0.4 0.5 0.6 0.7 0.8 0.9 1 Normalized frequency for discrete-time signal (ω)
|φ2−φ1| =0.3
|φ2−φ1| =0.448
|φ2−φ1| =0.6
|φ2−φ1| =0.8
Distinct peaks Merged peaks |Hv(ejω)|
Figure4: Magnitude plots for different values of|φ2−φ1|, when
r=0.8.
if ((1 +r2)/2r) cos((φ
2−φ1)/2)≥1, then we can easily find
that|Hv(ejω)2|has a single maximum atω=(φ
1+φ2)/2.
Thus, the obtained condition for a peak merger is as fol-lows:
φ1−φ2<2 cos−1
2r 1 +r2
. (15)
It is evident that asrapproaches the unity, the maximum value of|φ2−φ1|satisfying (15) becomes smaller. Thus, in
order to obtain a condition for a peak merger,rshould take the minimum possible value which is in accordance with the previous discussion. From (9) and (15), a condition of|φ1− φ2|<0.442 rad is obtained by lettingr =0.8 in (15).Figure 4
shows the magnitude response of (12) for several different values of|φ2−φ1|whenr = 0.8. From this figure, we can
see that peak mergers actually occur when|φ1−φ2|<0.442,
which exactly complies with our derived condition.
However, in the actual experiments, directly using (15) sometimes results in miss detections, which are largely due to the approximation involved in deriving (15) and interac-tion with other poles. Furthermore, an excessively large angle might lead to an increased false alarm probability, by includ-ing poles related to another peak. In this context, missed de-tection means that we do not detect a peak merger, which is actually present, by simply looking into the number of poles in the vicinity of the suspected peak with a central an-gle specified by (15). Likewise, a false alarm means that we erroneously decide that a peak merger occurs by inspecting the number of poles in the same vicinity around the sus-pected peak. The region used for testing the number of poles will be described in Section 4.3in greater detail. After re-peated experiments, we found a sector of the central angle 0.5498 rad to be appropriate for reducing error rates. Assum-ing an 8 kHz samplAssum-ing rate, this value corresponds to 700 Hz. Therefore, a condition for a peak merger employed in the
Speech
Pre-emphasis
Spectral peak picking
IsF1−F2
merger possible? Yes No
IsF2−F3
merger possible? Yes No
No
Does the peak merger occur? (Cauchy’s integral)
Yes Roots polishing
Magnitude test
Smoothing
Extracted formants
Figure5: Block diagram of the proposed system.
proposed system is that, the difference between two adjacent formant frequencies should be less than 700 Hz as follows:
2Fsπφ1− Fs
2πφ2
<700 Hz, for 8 kHz sampling rate, (16)
where Fs = 8000 Hz is the sampling frequency. Note that (Fs/2π)φi,i =1, 2, is the frequency in Hz that corresponds to the phase of a pole as indicated by (3).
This result is exploited in deriving other conditions in Sections4.2and4.3.
4. PROPOSED METHOD
Note that we employed root polishing instead of direct roots solving method. Polishing two roots around the spec-tral peaks requires far less computation, compared to directly solving all the roots of the linear prediction-error polyno-mial. Also, as shown in the figure, we perform a test us-ing Cauchy’s integral formula, before root polishus-ing, to find out whether the peak comprises two poles or a single pole. Additionally, before the test, we examine whether the peak merger is possible or not, using the data on formants distri-bution [7]. This procedure is shown in detail inSection 4.2. We apply Cauchy’s integral only if the extracted formant fre-quencies satisfy this screening condition. So, the additional computation required for the entire process of peak resolv-ing, in the proposed system, is far less burdensome than that of direct roots solving method.
4.1. Step I: finding the spectral peaks
First, if needed, the original speech signal is down sampled to 8 kHz since the first three formant frequencies are less than 4 kHz. Then, this signal is preemphasized with a preempha-sis coefficient ofμ=0.95, and the spectral peaks are found using LPC spectrum, as in the ordinary spectral peak pick-ing methods [5]. A 14th-order LPC analysis is used. Previ-ous studies show that just increasing the LP-order cannot be the solution to the peak merger problem [3]. Thus, in our cases, Step III and IV are employed to resolve the peak merger problem.
4.2. Step II: the application of screening conditions
Simple formulas for the location of the extracted formants are used to identify, whether or not, they are necessary to resolve the suspected merged peaks. This separation test is based on conditions for peak mergers, which will be ex-plained shortly.
The advantages of this test are two folds. First of all, the amount of computation is reduced significantly, since only a small fraction, about 5% of the peaks, needs to be exam-ined via the subsequent Cauchy’s integral and the root pol-ishing method. Secondly, this screening prevents the unnec-essary resolving of poles. Note that inadequate resolving of poles often leads to accuracy degradation. This is due to the fact that there may be some poles that are not directly re-lated with the formants. As a result, some of them may exist inside the sector that we intend to examine. Detailed expla-nation on this sector is given in the following subsection. As mentioned previously, the conditions (9) and (16) are not mathematically strict conditions, but based on mathematical inference from experimental results. Thus, it is still possible that a small number of the roots that are not directly related to formants may exist in this sector. In this case, erroneous resolving may occur. The following conditions are based on the distribution of formant frequencies and give us informa-tion on the possibility of peak mergers. In sum, the following conditions reduce both the computational requirement and some erroneous resolving cases.
The screening conditions employed are as follows. LetF1, F2, and F3 be the extracted formant frequencies from the
spectral peak picking, andF1,F2, andF3 be their actual
frequencies, respectively.
Condition 1
F2−F1(orF3−F2)>700 Hz in the peak merger case.
Justification for this condition: as shown inFigure 6, we can easily see that the difference betweenF2 andF1 would
be large whenF1is formed by merged formants becauseF2
actually corresponds toF3. This figure shows the case where
the peak in the lower frequency is a merged one. To justify the above condition, let us assume thatF1is a merged formant,
andF2−F1<700 Hz contrary to the above condition. In this
case,F1needs to be resolved intoF1andF2. As mentioned
above,F2 corresponds toF3. Accordingly, from the
above-mentioned assumption, we can obtainF3−F1<700 Hz. It
can be roughly assumed that the resolved formant frequen-cies are located symmetrically centered toF1, which means
(F1+F2)/2=F1. From the condition for a peak merger (14),
it can be derived thatF3−F1<1050 Hz. However,
accord-ing to the possible formants distribution in [5],F3−F1>
1050 Hz. Thus, the assumption is wrong, and it can be stated that the difference betweenF2−F1(orF3−F2)>700 Hz in
the peak merger case.
Condition 2
F2 > 1800 Hz for the peak merger betweenF1 andF2 to
occur.
Justification for this condition: if the first peak is formed owing to the peak merger, then the originally extracted F2
becomesF3. As can be seen in the formants distribution in
[7],F3is larger than 2000 Hz except for “ER” sound. But in
the case of “ER” sound, peak merger cannot happen sinceF1
andF2are widely separated. Thus, ifF2is less than 1800 Hz,
this needs not be resolved.
4.3. Step III: examining peak merger
We will now describe how we can examine the peak merger around a suspected peak that satisfies the screening condition in the previous subsection. Originally, the idea of obtaining the number of poles in a given sector was presented in [2]. We employ Cauchy’s integral formula introduced in their work to find out whether the peak is a merged one. When testing peak merger using Cauchy’s integral formula, we employed LP prediction in the order of 10. If we adopt an LP polyno-mial of a much higher order, then there will be many poles that are not related to the actual formant, so it will become difficult to separate merged peaks using the pole informa-tion.
45 40 35 30 25 20 15 10
LP
-der
iv
ed
amplitude
spect
ru
m
(dB)
0 500 1000 1500 2000 2500 3000 3500 4000 Frequency (Hz)
F1 F2
F1
F3
F2 F3
Not a formant (not sufficiently narrow
bandwidth) (a)
π
−5π 6
−2π 3
−π 2
−π 3
−π6 0Re π 6 π 3 Im π 2 2π
3 5π
6
1 0.8 0.6 0.4 0.2
F2 F1
F1
F3 F
2
F3
Not a formant (not sufficiently narrow
bandwidth
(b)
Figure6: Actual formant frequencies and formant frequencies obtained from spectral peaks when peak merger occurs. (a) LP-derived spectrum, actual formant frequencies (F1,F2, andF3), and formant frequencies obtained from spectral peaks (F1,F2, andF3), (b) pole
locations, actual formant frequencies (F1,F2, andF3), and formant frequencies obtained from spectral peaks (F1,F2, andF3).
performed just once for each peak satisfying the condition in Step II. Secondly, it is very difficult to find out which poles are actually related to formants with Snell’s algorithm, since not all of the poles are related to actual formants, as men-tioned previously. Consequently, Snell’s algorithm shows the performance of a typical formant extractor based on the root extraction algorithm. In contrary, we exploit information on the spectral peak and utilize this integral to resolve the peak merger problems. Thus, we do not suffer from the above-mentioned problem inherent in extractors based on roots solving.
This integration is performed in the vicinity of the peak. Let’s assume that the angle related to the spectral peak is φPEAK. The area that we want to examine is shown in Figure 7(a). In this figure,φ3andφ4are derived by the
fol-lowing equations:
φ3−φ4=700π
4000, (17)
φ3+φ4
2 =φPEAK. (18)
In (17), the reason why we use the central angle of (700/4000)πcan be found in (16). More specifically, this is due to the fact that we want to find whether two poles satis-fying the condition of (9) and (16) exist in the vicinity of a single suspected peak. Additionally, the radii ofr =0.8 and r = 1.0 are given by (9) as a condition. In theF1−F2
re-solving case, ifφ3 ≤ 200π/8000, we takeφ3 = 200π/8000,
because the lowest possible formant frequency is 200 Hz [7].
Along with this, the contour of Cauchy’s integral is shown inFigure 7(b), which is the same as shown in [2]. The reason why we adopt this contour lies in the fact that we can reduce the computational burden significantly compared to the integration along the one inFigure 7(a). When perform-ing the integration along the contour inFigure 7(b), it is pos-sible that poles not meeting the constraint 0.8< r <1.0 are selected. These poles are filtered through the subsequent root polishing algorithm. Note that the root polishing algorithm described in the next subsection gives us the magnitude of the pole as well as its phase.
We can denote the above-mentioned sector inFigure 7(b)
by (19):
Γ1: 0≤r≤2, φ=φ3,
Γ2:r=2, φ3≤φ≤φ4,
Γ3: 0≤r≤2, φ=φ4.
(19)
As shown in [2], we can obtain the number of poles inside this sector by
n(Γ)= 1
2π j
Γ
A(z)
A(z)dz, (20)
where polynomial A(z) is the prediction-error polynomial, andΓis the sector composed of three curvesΓ1,Γ2, andΓ3in
(19). For the integration on the curvesΓ1andΓ3, the
Im φ4
φPEAK
φ3
r=1 r=0.8
Re (a)
Im φ4
φPEAK
φ3
r=2
Re (b)
Figure7: (a) Test area for a peak merger, and (b) contour for Cauchy’s integral.
Γ2, the approximate value ofN|φ4−φ3|was used to reduce
computation as in [2]. In this approximation,Ndenotes the LPC order. For more details on this approximation value, you are referred to [2].
4.4. Step IV: resolving poles by polishing the roots
If the result of Cauchy’s integration in Step III is two, then the two poles that constitute the merged peak are obtained in the following manner. To begin with, it is quite natural that (3) can be applied to these poles because these two poles are directly related to the spectral peak. Thus, the initial ap-proximate phase values of these two values can be given by
φ0(0)=φ (0) 1 =
2πF
fs , (21)
whereφ0(0)andφ(0)1 are the approximate values of the phases
of these two poles, respectively. In the notations of φ(0)0
andφ(0)1 , the subscript 0 and 1 denote each pole, and the
superscript (i) denote the iteration number which will be de-scribed subsequently. In (21),Fis the frequency of the spec-tral peak in Hz to which these poles are directly related, and fsis the sampling frequency of the speech signal. Along with estimating the phase value, we also need to estimate the ap-proximate magnitudes of these two poles. Also note that (3) is derived under the assumption that poles are kept suffi -ciently apart. When two poles form a single peak, they are quite close to each other. Thus, (21) does not yield quite ac-curate values in the merged peak case. However, the obtained values from (21) should be in the neighborhood of the actual roots, so we can obtain more accurate values by the root pol-ishing algorithm, which will be explained in detail. As pre-viously mentioned in (9), the typical range of magnitudes of poles that constitute formants is given by 0.8≤r <1.0. Thus, we adopt the initial approximate value of magnituder0(0)and
r1(0)as follows:
r0(0)=r1(0)=0.9. (22)
Thus, from (21) and (22), we obtain the approximate values of these two rootsz(0)0 andz
(0) 1 by
z(0)0 =z(0)1 =0.9ej(2πF/ fs). (23)
After obtaining the initial approximation of (23), Bair-stow’s algorithm [13], that is, a variation of Newton-Raphson method, is used to obtain the roots by polishing this approx-imate value into the exact value. In Bairstow’s algorithm, we try to seek the quadratic factors. Since the coefficients of the prediction-error polynomialA(z) in (2) are all real, then the complex conjugates ofz(0)0 andz
(0)
1 are also roots ofA(z).
Specifically, the quadratic factor that has a root ofz0(0)
should be the following form:
z2+B(0) 0 z+C(0)0
=0, (24)
where
B0(0)= −z (0) 0 −
z(0)0
∗
= −1.8 cos
2πF fs
, (25)
C(0)0 =z (0) 0
2
=0.81. (26)
If we divide the prediction polynomialA(z) byz2+B(0) 0 z+ C(0)0 , then we obtain the following relationship:
A(z)=z2+B(0) 0 z+C
(0) 0
Q(z) +Rz+S, (27)
to 0. Now, Bairstow’s algorithm works in the following man-ner:
(1) Initialization: obtainB(0)0 andC0(0)from (24) and (25).
Setn=0,
(2) Recursion: repeat (2a), (2b), (and 2c) until n ≤ N0,
whereN0is the iteration limit.
(2a) from B(0)n and C(0)n , obtain Bn(0)+1 and Cn(0)+1 by
employing two-dimensional Newton-Raphson method,
(2b) test whether the coefficient has been converged by applying the following stopping condition. If both of (28) and (29) are met, go to step (3). Otherwise, continue the recursion step.
Bn(0)+1−B(0)n ≤ε1Bn(0)+1 or B (0)
n+1≤ε2, (28)
C(0)n+1−Cn(0)≤ε1Cn(0)+1 or Cn(0)+1≤ε2. (29)
In (28) and (29),ε1andε2are constants for
con-vergence checking. In our system, we adopt the values ofε1=0.001 andε2=0.0001,
(2c) setn=n+ 1.
(3) Termination: obtain z(0n+1) by solving the quadratic
equation:
z2+B(n+1)
0 z+C(0n+1)=0. (30)
Because this equation is quadratic, we generally ob-tain the roots in the complex conjugate form. Among them, the one with the positive phase value is our de-sired rootz(0n+1).
After obtaining the desired value ofz0(n+1), we divide the
prediction-error polynomialA(z) by (z2+B(n+1)
0 z+C0(n+1)).
And we apply the above-mentioned Bairstow’s algorithm once gain to obtainz(1n+1).
This method has the advantage of not requiring complex arithmetic, while the standard Newton-Raphson method re-sorts to complex arithmetic for polishing complex roots. Al-though this method cannot be used broadly, because of the stability problem, in the proposed system, we do not en-counter this problem since the initial approximation (23) is sufficiently close to the accurate roots. We can find that the roots converge with sufficient accuracy, satisfying the stop-ping condition in (28) and (29) after three or four iterations. Sometimes roots withr <0.8 or outside, this sector may be selected. In this case, the obtained roots should be dis-carded due to the constraint (9). After obtaining the roots, the formant frequencies can be obtained by (3). This is a clear advantage compared to the bisection method described in [2] or the conventional roots-extraction-type formant ex-tractor [5,9,10], which directly solvesA(z)=0.
5. RESULTS
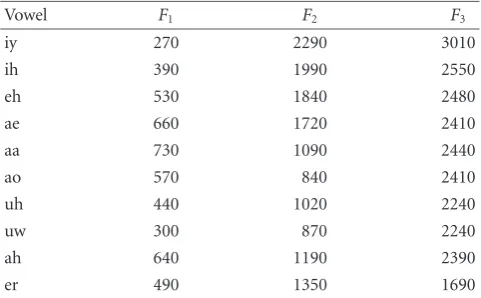
Previous research of formants shows that there are high cor-relations between a specific vowel and its formant frequen-cies [5, 7]. The following Table 1 shows the typical values
Table1: Typical values of formant frequencies.
Vowel F1 F2 F3
iy 270 2290 3010
ih 390 1990 2550
eh 530 1840 2480
ae 660 1720 2410
aa 730 1090 2440
ao 570 840 2410
uh 440 1020 2240
uw 300 870 2240
ah 640 1190 2390
er 490 1350 1690
of formant frequencies that we used for accuracy checking [5,7]. These values are used as the decision criterion whether a peak merger occurred or not in the testing phase.
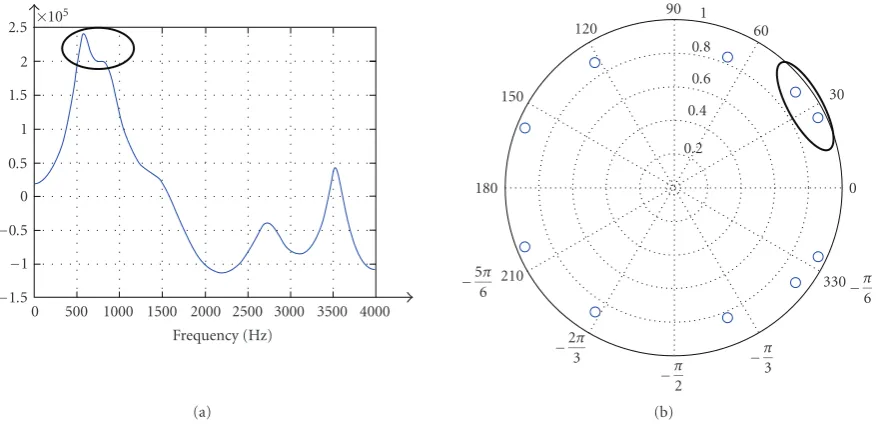
Figure 8 shows a sample speech frame where a peak merger in the formant frequencies occurred. In this frame, the formant frequencies obtained from the peaks with suf-ficient bandwidth areF1 = 593.8 Hz,F2 = 2712.1 Hz, and F3 =3514.4 Hz, respectively. The LP spectrum with LP
or-der 10 in Figure 8(a) confirms this result. However, when tested for peak mergers with this system, the peak in the lower frequency is found to be made of two poles as shown inFigure 8(b), and the subsequent roots testing and polish-ing procedures modify the formant frequencies in this frame toF1=569.5 Hz,F2=854.3 Hz, andF3=2712.1 Hz. In this
case, the pronounced vowel is “AO,” and you can find that the corrected formant frequencies are in accordance with the typical frequencies shown inTable 1.
Figure 9 shows the spectrogram of the word “pineap-ple” and the extracted formant frequencies using the con-ventional spectral peak picking method and the proposed algorithm. At the onset of speech, the first and the second formants are very close, so they form a single peak. In this part of speech, the pronounced phone is /AA/, thus, as shown inTable 1, theF1andF2are very close to each other. The
re-gion in ellipsis inFigure 9(a)denotes the merged peak. And, in this case, the duration of speech where the peak merge oc-curs is rather long, so it is very difficult to correct the result using conventional formant tracking or smoothing methods. But, as shown inFigure 9, the proposed algorithm yields de-sirable results even for this part of the speech.
×105
2.5 2 1.5 1 0.5 0 −0.5 −1 −1.5
0 500 1000 1500 2000 2500 3000 3500 4000 Frequency (Hz)
(a)
−5π 6
−23π
−π 2
−π3
−π6 0 30 60
90 120
150
180
210 330
1 0.8 0.6 0.4 0.2
(b)
Figure8: (a) LP spectrum, and (b) the pole locations of a frame. The ellipses indicate poles forming a peak merger.
useful for detecting errors due to the peak merger for large speech DBs like TIMIT, since a computer program for test-ing this criterion can be easily implemented. If this criterion tells us that a peak merger or extraction error occurs, we also check whether this test result is correct by investigating the extracted formant frequencies and comparing them with the spectrogram of the speech, and identifying the phone label of the speech.
Table 2shows phone label information in a speech sam-ple in a TIMIT DB. This samsam-ple can be found in TEST/ DR1/MJSW0/SI1640.PHN. Since the original TIMIT phone label information is given in units of the sampling index, we changed the base unit from the sampling index to time in this table.
Figure 10shows extracted formant results on this part of speech. InFigure 10(a), the formant extraction result was obtained using the standard ESPS formant extraction algo-rithm incorporated in WaveSurfer [16]. As widely known, the ESPS formant extractor shows good performance in most cases. In obtaining this figure using WaveSurfer, we first down sampled this 16 kHz TIMIT speech sample into 8 kHz one. According to our experiments, errors occur more fre-quently, when we use the ESPS formant extractor for 16 kHz speech samples, rather than 8 kHz speech samples. Figures
10(b)and10(d)show the formant extraction result using the conventional spectral peak picking method and root extrac-tion algorithm without addiextrac-tional smoothing. Compared to these results,Figure 10(c)illustrates the formant extraction result obtained, using the proposed method. As shown in
Figure 10(a), the ESPS formant extractor appears more ro-bust against the peak merger problem. This is because the ESPS formant extractor is not based on the spectral peak picking method, but on the root extraction method. As stated before, most of the formant extractors based on the root ex-traction algorithm have difficulty in selecting roots that are directly related to actual formants. However, in the case of the
ESPS formant extractor, a modified Viterbi algorithm is em-ployed to find the most probable poles related to actual for-mants. By adopting this scheme, the ESPS formant extractor shows sufficiently good performances in most cases. How-ever, even the ESPS formant extractor sometimes misses in selecting some resonances. As shown in this figure, for the /W/ phone, the extractor incorrectly selects the third for-mant frequency. By looking into the spectrogram in detail and following the movement of the spectral peaks, we can find that the fourth formant frequency obtained for the /W/ sound should be the third formant frequency. The proposed algorithm shown inFigure 10(c)shows a better result, even without sophisticated smoothing algorithms. Another ad-vantageous aspect of our proposed algorithm is that it re-quires far less computation compared to the formant ex-tractors based on roots solving, as previously described in
Section 2.Figure 10(b)shows the formant extraction result obtained using the conventional peak picking algorithm. As you can see in this figure, there are many errors in the ex-tracted formant frequency due to the peak merger prob-lems. Compared to this result, our proposed algorithm in
4000 2000 0
Fre
q
u
en
cy
0 0.5 1 1.5 2
Time Merged peak
(a)
4000 2000 0
Fre
q
u
en
cy
0 0.5 1 1.5 2
Time F3
F2
F1
(b)
4000 2000 0
Fre
q
u
en
cy
0 0.5 1 1.5 2
Time F3
F2
F1
(c)
Figure9: (a) Speech spectrogram (ellipsis in this figure denotes the merged peak), (b) formants tracking result with the conventional spectral peak picking method, and (c) formants tracking result with the proposed method.
Table2: Phone location of a portion of a sample speech in TIMIT DB (speech file: TEST/DR1/MJSW0/SI1640.WAV).
Beginning time Ending time Phone name
0.455 0.500 vcl
0.500 0.617 w
0.617 0.702 ah
0.702 0.785 n
0.785 0.805 vcl
Table 3 shows the formant extraction results using the conventional spectral peak picking method for a speech sample in the well-known TIMIT DB. In obtaining these for-mant values, we used an LP order of 14 and an FFT order of 512. The window size is 30ms, and the frame rate is 10ms.
Figure 10(b) illustrates the plot of the formants obtained from this speech sample, in the range of 0.5≤t≤0.65, using the conventional spectral peak picking method. As shown in
Table 3andFigure 10(b), peak mergers occurred many times
in the /W/ phone. This merger occurred since the first and second formant frequencies are very close, as shown in Fig-ures10(a)and10(c).
In contrast,Table 4shows the extraction results when the proposed algorithm is employed. As you can see in this table, the peak merger problems have been successfully figured out.
Figure 10(c)also shows that we obtain the desired formant frequency at this region, and continuity in the extracted for-mant frequency can be maintained.
More detailed information on pole locations and LP spectra can be found inFigure 11 at different time t. Fig-ures11(c),11(d), and11(e)show the cases of peak merger. By comparing with the pole locations in z-plane, you can find that the peak in the lowest frequency around 600 Hz is actually composed of two spectral peaks. As previously mentioned, the /W/ sound is pronounced in this part of speech. However, by employing Cauchy’s integral and root polishing scheme, we can distinguish two resonances and obtain correct values as shown in Figure 10(c) and
Table 3.
After testing our algorithm on this test set, we can con-clude that most of theF1−F2merger problems occured in the
“AA” and “AO” sounds. Note that the difference betweenF1
andF2is very small in these sounds as shown inTable 1. The
“AA” and “AO” vowels constitute about 5.2% of the 10 vowels we tested. The TIMIT core test set had 250 samples. During the test, using these sounds, the proposed system yielded a performance accuracy of 87%, which is significantly higher than that of the spectral peak picking method’s 81.6%. This result proves that the proposed method is robust enough for the peak merger problem. On the other hand, the perfor-mance of the root extraction method is the worst (less than 50%). This is partly because there is no clear way to relate the solved roots to formants. Note too that no smoothing technique was employed for any of the extractors during the evaluation process. For the speech frames, where peak merg-ers do not happen, the proposed algorithm and the spectral peak picking method showed almost the same performance.
6. CONCLUDING REMARKS
4000 3000 2000 1000 0
Fre
q
u
en
cy
(H
z)
vcl w ah n vcl
Time (s)
0.45 0.50 0.55 0.60 0.65 0.70 0.75 0.80 (a)
4000 3000 2000 1000 0
Fre
q
u
en
cy
(H
z)
vcl w ah n vcl
Time (s)
0.45 0.50 0.55 0.60 0.65 0.70 0.75 0.80
(b)
4000 3000 2000 1000 0
Fre
q
u
en
cy
(H
z)
vcl w ah n vcl
Time (s)
0.45 0.50 0.55 0.60 0.65 0.70 0.75 0.80 (c)
4000 3000 2000 1000 0
Fre
q
u
en
cy
(H
z)
vcl w ah n vcl
Time (s)
0.45 0.50 0.55 0.60 0.65 0.70 0.75 0.80 (d)
Figure10: Spectral shape and the location of poles for a speech sample in TIMIT DB(TEST/DR1/MJSW0/SI1640.WAV) (ellipsis in this figure denotes the merged peak). (a) Formant frequencies obtained using WaveSurfer, (b) formant frequency obtained using the spectral peak picking method, (c) formant frequency obtained using the proposed algorithm, and (d) formant frequency obtained using root extraction algorithm.
Table3: Formant extraction results for a speech sample in TIMIT DB using the spectral peak picking method (speech file: TEST/DR1/ MJSW0/SI1640.WAV).
Time (t) F1 F2 F3 Merger
0.50 296.9 859.4 2421.9 Not merged
0.51 312.5 781.3 2531.3 Not merged 0.52 343.8 734.4 2612.4 Not merged
0.53 375.0 718.8 2693.2 Not merged
0.54 437.5 687.5 2765.6 Not merged 0.55 640.6 2812.5 3656.3 Merged
0.56 640.6 2921.9 3687.5 Merged
0.57 671.9 2921.9 3642.1 Merged
0.58 687.5 2921.9 3624.6 Merged 0.59 703.1 2934.1 3613.4 Merged
0.60 843.8 2947.8 3587.2 Merged
0.61 734.5 937.5 2957.2 Not merged 0.62 1000.0 2979.8 3627.4 Merged
0.63 1140.6 3000.0 3650 Merged
0.64 1218.7 2942.1 3592.2 Merged 0.65 859.3 1328.1 2875.0 Not merged
speech database, but also requires very little additional com-putation. The reason for this is, because root polishing needs to be applied only to a small portion of the speech frames.
Table4: Formant extraction results for a speech sample in TIMIT DB using the proposed algorithm (speech file: TEST/DR1/MJSW0/ SI1640.WAV).
Time (t) F1 F2 F3 Merger
0.50 296.9 859.4 2421.9 Not merged 0.51 312.5 781.3 2531.3 Not merged
0.52 343.8 734.4 2612.4 Not merged
0.53 375 718.8 2693.2 Not merged 0.54 437.5 687.5 2765.6 Not merged
0.55 509.6 749.6 2812.5 Resolved
0.56 556.8 651.3 2921.9 Resolved 0.57 579.4 636.3 2932.1 Resolved
0.58 687.5 721.4 2921.9 Resolved
0.59 665.5 785.3 2934.1 Resolved 0.60 666.8 841.7 2947.8 Resolved
0.61 734.4 937.5 2957.2 Not merged
0.62 672.7 1007.0 2979.8 Resolved 0.63 782.1 1140.6 3000 Resolved
0.64 841.2 1218.8 2942.1 Resolved
0.65 841.2 1328.1 2875.0 Not merged
π
−5π
6
−23π
−π
2
−π3 −π
6 0 Re π 6 π 3 Im π 2 2π
3
5π 6
1
0.8
0.6
0.4
0.2
40
35
30
25
20
15
10
5
LP
-der
iv
ed
amplitude
spect
ru
m
(dB)
0 500 1000 1500 2000 2500 3000 3500 4000 Frequency (Hz)
(a)
π
−5π
6
−2π
3
−π2 −
π 3
−π
6 0 Re π 6 π 3 Im π 2 2π
3 5π
6
1 0.8 0.6 0.4 0.2
45 40 35 30 25 20 15 10
LP
-der
iv
ed
amplitude
spect
ru
m
(dB)
0 500 1000 1500 2000 2500 3000 3500 4000 Frequency (Hz)
(b)
π
−56π
−2π
3 −π
2
−π3 −π
6 0 Re π 6 π 3 Im π 2 2π
3 5π
6
1 0.8 0.6 0.4 0.2
45 40 35 30 25 20 15 10
LP
-der
iv
ed
amplitude
spect
ru
m
(dB)
0 500 1000 1500 2000 2500 3000 3500 4000 Frequency (Hz)
(c)
π
−5π 6
−23π
−π2 −π3
−π6 0 Re π 6 π 3 Im π 2 2π
3 5π
6
1 0.8 0.6 0.4 0.2
55 50 45 40 35 30 25 20 15 10
LP
-der
iv
ed
amplitude
spect
ru
m
(dB)
0 500 1000 1500 2000 2500 3000 3500 4000 Frequency (Hz)
(d)
π
−56π
−2π
3 −π
2 −π
3 −π
6 0 Re π 6 π 3 Im π 2 2π
3 5π
6
1 0.8 0.6 0.4 0.2
55 50 45 40 35 30 25 20 15
LP
-der
iv
ed
amplitude
spect
ru
m
(dB)
0 500 1000 1500 2000 2500 3000 3500 4000 Frequency (Hz)
(e)
Figure11: Pole locations and LP spectra for a speech sample in TIMIT DB (TEST/DR1/MJSW0/SI1640.WAV) (ellipsis in this figure denotes the merged peak). (a) Pole location and LP spectrum at time 0.53s, (b) pole location and LP spectrum at time 0.54s, (c) pole location and LP spectrum at time 0.55s, (d) pole location and LP spectrum at time 0.56s, and (e) pole location and LP spectrum at time 0.57s.
performance compared in [8]. We also expect that applica-tions such as speech recognition, formant vocoder, or text-to-speech system (TTS) will benefit from this robust extrac-tor.
ACKNOWLEDGMENT
This study was supported by the National Research Labora-tory program (2000–X–7155), Brain Korea 21 Project (0019-19990027) in Seoul National University, and Yonsei Univer-sity Research Fund of 2005.
REFERENCES
[1] L. R. Rabiner and R. W. Schafer,Digital Processing of Speech Signals, Prentice-Hall, Englewood Cliffs, NJ, USA, 1978.
[2] R. C. Snell and F. Milinazzo, “Formant location from LPC analysis data,”IEEE Transactions on Speech and Audio Process-ing, vol. 1, no. 2, pp. 129–134, 1993.
[3] S. S. McCandless, “An algorithm for automatic formant ex-traction using linear prediction spectra,”IEEE Transactions on Acoustics, Speech, and Signal Processing, vol. 22, no. 2, pp. 135– 141, 1974.
[4] L. Welling and H. Ney, “Formant estimation for speech recog-nition,” IEEE Transactions on Speech and Audio Processing, vol. 6, no. 1, pp. 36–48, 1998.
[5] J. R. Dellar Jr., J. G. Proakis, and J. H. L. Hansen,Discrete-Time Processing of Speech Signals, Macmillan, New York, NY, USA, 1993.
Department of Commerce, National Institute of Standards and Technology, Gaithersburg, Md, USA, 1993.
[7] G. E. Peterson and H. L. Barney, “Control methods used in a study of the vowels,”Journal of the Acoustical Society of Amer-ica, vol. 24, no. 2, pp. 175–194, 1952.
[8] C. Kim and W. Sung, “Vowel pronunciation accuracy check-ing system based on phoneme segmentation and formants ex-traction,” inProceedings of International Conference on Speech Processing, pp. 447–452, Daejeon, Korea, August 2001. [9] J. D. Markel, “Digital inverse filtering: a new tool for formant
trajectory estimation,”IEEE Transactions on Audio and Elec-troacoustics, vol. 20, no. 2, pp. 129–137, 1972.
[10] B. S. Atal and S. L. Hanauer, “Speech analysis and synthesis by linear prediction of the speech wave,”Journal of the Acoustical Society of America, vol. 50, no. 2B, pp. 637–655, 1971. [11] G. S. Kang and D. C. Coulter, “600 bits per second voice
digitizer (linear predictive formant vocoder),” Naval Research Laboratory Report 8043, Washington, DC, USA, November 1976.
[12] C. G. Bell, H. Fujisaki, J. M. Heinz, K. N. Stevens, and A. S. House, “Reduction of speech spectra by analysis-by-synthesis techniques,”Journal of the Acoustical Society of Amer-ica, vol. 33, no. 12, pp. 1725–1736, 1961.
[13] W. H. Press, S. A. Teukolsky, W. T. Vetterling, and B. P. Flan-nery, Numerical Recipes in C, Cambridge University Press, Cambridge, UK, 1992, pp. 376.
[14] R. L. Burden and J. D. Faires,Numerical Analysis, Brooks/Cole, Pacific Grove, Calif, USA, 1997.
[15] H. K. Dunn, “Methods of measuring vowel formant band-widths,”Journal of the Acoustical Society of America, vol. 33, no. 12, pp. 1737–1746, 1961.
[16] WaveSurfer, Center for Speech Technology (CTT) at KTH, Stockholm, Sweden, available at http://www.speech.kth.se/ wavesurfer/.
Chanwoo Kimreceived the B.S. and M.S. degrees in electrical engineering from Seoul National University, Seoul, Korea, in 1998 and 2001, respectively, and is currently working toward the Ph.D. degree at the School of Computer Science, Carnegie Mel-lon University. From 2000 to 2002, he worked on speech recognizers and embed-ded signal processing systems for Edumedia Technologies. From 2003 to 2005, he was
with LG Electronics. His research interests include multimedia sys-tems, speech recognition system, speech analysis, and embedded systems for signal processing.
Kwang-deok Seo received the B.S., M.S., and Ph.D. degrees in electrical engineering from Korea Advanced Institute of Science and Technology (KAIST), Daejeon, Korea, in 1996, 1998, and 2002, respectively. From August 2002 to February 2005, he was with LG Electronics. Since March 2005, he has been a Faculty Member in the Computer and Telecommunications Engineering Di-vision, Yonsei University, Gangwon, Korea,
where he is an Assistant Professor. He has over 30 pending or issued patents and has published over 30 papers in the areas of multimedia coding, multimedia signal processing, and multimedia communi-cation systems. He is a Member of KICS, IEEE, and IEICE.
Wonyong Sungreceived the B.S. degree in electronic engineering from the Seoul Na-tional University in 1978, the M.S. degree in electrical engineering from the Korea Ad-vanced Institute of Science and Technology (KAIST) in 1980, and the Ph.D. degree in electrical and computer engineering from the University of California, Santa Barbara, USA in 1987. From 1980 to 1983, he worked at the Central Research Laboratory of the