Copyright 0 1994 by the Genetics Society of America
Mapping and
Analysis
of
Dairy
Cattle Quantitative Trait Loci by Maximum
Likelihood Methodology
Using Milk Protein Genes
as
Genetic Markers
H. Bovenhuis**’
and
J.
I. Welled
*Department of Animal Breeding, Wageningen Agricultural University, The Netherlands, and +A. R . O . , The Volcani Center, Bet Dagan, Israel
Manuscript received May 23, 1992 Accepted for publication February 1 , 1994
ABSTRACT
Maximum likelihood methodology was used to estimate effects of both a marker gene and a linked quantitative trait locus (QTL) on quantitative traits in a segregating population. Two alleles were assumed for the QTL. In addition to the effects of genotypes at both loci on the mean of the quantitative trait, recombination frequency between the loci, frequency of the QTL alleles and the residual standard de- viation were also estimated. Thus six parameters were estimated in addition to the marker genotype means. The statistical model was tested on simulated data, and used to estimate direct and linked effects of the milk protein genes, plactoglobulin, K-casein, and kasein, on milk, fat, and protein production and fat and protein percent in the Dutch dairy cattle population. PLactoglobulin had significant direct effects on milk yield and fat percent. K-Casein had significant direct effects on milk yield, protein percent and fat yield. pCasein had significant direct effects on milk yield, fat and protein percent and fat and protein yield. Linked QTL with significant effects on fat percent were found for K-casein and pcasein. Since the pcasein and K-casein genes are closely linked, it is likely that the same QTL was detected for those two markers. Further, a QTL with a significant effect on fat yield was found to be linked to K-casein and a QTL with a significant effect on protein yield was linked to plactoglobulin.
N
UMEROUS studies have shown that quantitative trait loci (QTLs) affecting traits of economic in- terest in agricultural species can be detected and mapped by linkage to known genetic markers (reviewed by SOLLER 1990, 1991). Most studies have analyzed crosses between inbred lines. This is a viable option for many plant species, but not for fruit trees and most live- stock species, especially dairy cattle. In these species, as in humans, it is necessary to analyze existing segregating populations. In commercial dairy cattle populations elite sires often have hundreds or even thousands of daughters produced by artificial insemination. Thus, a segregating QTL can be detected by analyzing the prog- eny of a sire heterozygous for a genetic marker (NEIMANN-SORENSEN and ROBERTSON 1961). If the marker is linked to a QTL heterozygous in the sire, then daugh- ters inheriting the different sire marker alleles should also display a difference for the quantitative trait. Even if the sire is heterozygous for the genetic marker, he may still be homozygous for the QTL. Furthermore, even if the sire is heterozygous for both loci, linkage relation- ships between the marker and QTL alleles may be dif- ferent for different sires. Thus, progeny of several sires should be analyzed jointly, and it is necessary to analyze marker effects within sires. This can be done either by analysis of variance (SOLLER and GENIZI 1978) or chi- squared analysis ( GELDERMAN 1975; NEIMANN-SORENSENCenter, Bet Dagan, Israel.
’
H.B. prepared part of this study during a leave at A. R. O., The Volcani
Genetics 137: 267-280 (May, 1994)
and ROBERTSON 1961; WELLER et al. 1990). Because of differing linkage relationships among sires, this “daughter design” has less statistical power than crosses between in- bred lines. To detect a QTL with a substitution effect of 0.1-0.3 phenotypic standard deviation, it is necessaxy to determine the genotypes of thousands of daughters (SOLLER and GENIZI 1978; WELLER et al. 1990). With inbred lines, the same power can be obtained by determining the genotypes of less than 1000 progeny (SOLLER et al. 1976).
If genetic linkage between the QTL and the genetic marker is incomplete, the estimated QTL effects on the quantitative trait will be biased by recombination. Sev- eral studies have shown that, for crosses between inbred lines, maximum likelihood (ML) methodology can be used to obtain unbiased estimates for both recombina- tion frequency and QTL effects
UENSEN
1989; ~ A P P et al. 1990; LANDER and BOTSTEIN 1989; WELLER 1986, 1987). WELLER (1990) constructed a likelihood function for estimating parameters related to a linked QTL for the daughter design. In addition to the genotype effects, residual variance, and recombination frequency be- tween the genetic marker and the QTL, it is also nec- essary to estimate allele frequencies for the QTL.Milk protein content is a major criterion for selection of dairy cattle. Milk protein consists of different fractions of which a-,,casein, a,,-casein, b a s e i n , K-casein, a-lactalbumin and @lactoglobulin are the most impor- tant. @Casein, Kcasein, and @lactoglobulin are poly- morphic in commercial dairy cattle breeds (EIGEL et al.
milk protein genes on production traits in dairy cattle. Most of these analyses estimated the genotype effect on economic traits ( e . g . , GRAML et al. 1985, 1986; GONYON et al. 1987; HAENLEIN et al. 1987). Therefore, only effects of milk protein genes, or very closely linked genes in linkage disequilibrium with milk protein genes, could be detected. Although variants of the daughter design have been employed by a few studies (GELDERMANN et al. 1985; GONYON et al. 1987; HAENLEIN et al. 1987), it is not clear whether the effects found are due to linked QTLs or direct effects of the milk protein alleles.
Unlike restriction fr-agment length polymorphism (RFLP) or variable number of tandem repeat (VNTR) markers, milk protein markers are functional genes. Therefore, it is likely that the milk protein gene itself or a closely linked region (promoter or enhancer) is involved in the regulation of milk protein production. Although models have been described to locate multiple
QTLs
in inbred populations (KNAPP 1991; MARTINEZ and CURNOW 1992), no model has been described yet that accounts for both an effect of the marker and a linkedQm
in segregating populations.The goals of this study were: (1) to construct a statis- tical model that is able to estimate effects of both a marker gene and a linked
QTL
o n a quantitative trait in a segregating population,(2)
to test this model on simu- lated data a n d (3) use the model to estimate direct and linked effects of milk protein genes on milk production traits in the Dutch dairy cattle population.MATERIAL AND METHODS
Likelihood model: In dairy cattle populations sires often have large progeny groups. By determining marker genotypes of sires and their daughters the inheritance of marker alleles can be traced from sires to their daughters. Marker genotypes of dams are not known. To be able to estimate direct and linked effects of a marker, a likelihood model was constructed for a marker locus with alleles M' and M', and a linked QTL with alleles Q' and Q'. Assuming Hardy-Weinberg equilibrium in the sire opulation, the prior probability of the sire being Q Q I , Q'QJ'or QzQ2 for the QTL is p2,2pq or
g,
respectively, where frequencies of QTL alleles Q' and Q' arep
and q, re-spectively. Let us now consider a sire with known marker geno- type M'M'. The prior probabilities of the sire being Q'Q',
Q'Q' or Q'@ for the QTL are
p',
2pq or 4'. Given the QTL genotype of the sire is Q'Q', the sire can transmit only the M'and the Q' alleles. Given a M'M' marker genotype for the daughter it can be concluded that the daughter inherited also an M' allele from the dam. For the QTL the dam could have transmitted a Q' or a Qz allele. If we assume that the marker and the QTL are in linkage equilibrium the probabilities of inheriting a M' marker allele and a Q' or a Q2 QTL allele are
independent. Consequently, a fraction
p
of the M'M' daugh- ters of the M'M' sire will carry the Q'Q' QTL genotype, ie., the probability of obtaining a Q' allele from the dam. Similarly, a fraction q of the M'M' daughters of the M'M' sire will carry the Q'Q' genotype. Assuming additive gene action, normal distribution of the observations within marker-QTL genotypes and linkage equilibrium between the marker and the QTL, a fractionp
of the M'M' daughters of a M'M'/ Q'Q' sire will be normally distributed with a mean determined by the effect of the Q'Q' and the M'M' genotypes on the quantitative trait. Similarly a fraction q will be normally distributed with a mean determined by the effect of the Q'Q' and the M'M' genotypes on the quantitative trait.Given a M'M2 marker genotype for the daughter of an M'M'/Q'Q' sire it can be concluded that the daughter in- herited an M 2 allele from the dam. For the QTL the dam could have transmitted a Q' or a Q2 allele. Because the marker and
the QTL are assumed to be in linkage equilibrium, the p r o b abilities of inheriting a M 2 marker allele and a Q' or a Qz QTL allele from the dam are independent. Consequently, similar to the M'M' daughters, a fraction
p
of the M'M' daughters of the M'M'/ Q'Q' sire will carry the Q'Q' QTL genotype and will be normally distributed with a mean determined by the effect of the Q'Q' and the M'M' genotypes. A fraction q will carry the Q'Q' genotype and will be normally distributed with a mean determined by the effect of the Q'Q' and the M'M2 genotypes on the quantitative trait.If the M'M' sire is Q'Q' for the QTL, the sire can transmit either the Q' or the Q' allele, each with a probability of
5.
Again assuming linkage equilibrium between the marker and the QTL, the probabilities of the daughters being Q'Q', Q'Q' or Q2Qz for the QTL are:p,
1 and i q , respectively. If the sire isQ2Q2 the probability of a d'M' daughter being Q'Q' or Q2Q2
are
p
and q, respectively. Similarly the probabilities of the QTL genotypes for the M'M' daughters of the M'M' sire can be determined. The complete likelihood function of M'M' sires can be described as follows:
ML Mapping of Dairy Cattle QTL 269
The likelihood function shows that differences between the M'M' and M'Mz daughters of a M'M' sire are due to differ- ences between the M'M' and M'M2 marker genotype effects. Therefore, daughters of this sire are only informative with re- spect to marker genotype effects.
Only sires that are heterozygous for both the marker and the QTL are informative with respect to the QTL. This is because the transfer of a marked chromosome section can only be traced for a sire that is heterozygous for the marker. Further, only if the sire is also heterozygous for the QTL, the daughters homozygous for the marker genotype will
L M h - s
p
. f ( ~
PQ'Q' + P M J M J ) + q ' 8 x 9 P Q J Q ~ + P M ' M ' ).
II
p
N M ~ M ~ . ,
,= 1
differ not only because they differ with respect to their marker genotypes, but also because they have different QTL genotypes. If the two loci are in coupling phase (M' and Q' are on the same chromosome) then, except for recombi- nants, daughters that inherit the "-allele will also inherit the @-allele. The opposite is true if the two loci are in repulsion. Under the assumption of linkage equilibrium between the marker and the QTL, the probabilities that an M'M2 sire will have either genotype M'Q'/M2@ or M'@/ M2Q' are pq. The likelihood of M'M2-sire s can now be written as
For heterozygous daughters of double heterozygous sires the M' and Mz allele frequencies were not included in the equa- tions as was suggested by DENTINE and Cowm (1990). There- fore, for these animals the equations are an approximation,
which is exactly correct when either r = 0.5 or when the M' allele frequency is equal to the M2 allele frequency.
where
NMZM~,~ = number of M Z M 2 daughters of sire s
r = recombination fraction between marker and QTL.
Assuming that sires are independent, the natural logarithm of the likelihood for the total population is obtained by sum- mation of the natural logarithm of likelihoods for all sires
M I ) “2) M 3 )
h(L) =
2
In(LMl,,+,)+
2
1n(LMlM2-J+
2
s= I 5= 1 J= 1
where
N(l) = number of sires with M’M’ genotype
N(2) = number of sires with M’M2 genotype
N(3) = number of sires with M 2 M Z genotype.
Since this model includes two fixed effects, the genetic marker and the QTL, there is no unique solution for the main effects. A solution was obtained by setting the mean of the
M’M’ genotype equal to zero. The function was maximized with respect to the remaining five genotype means and with respect to
p ,
r and a, using the downhill simplex method (NELDER and MEAD 1965). The trait values for milk production, fat yield, and protein yield were standardised by dividing by 700 for milk production, by 25 for fat yield and by 20 for pro- tein yield. After maximisation the parameters M’M’, M2M2,Q’Q’, Q’Q’, QzQ2 and u were transformed to their original scale by multiplying by 700 for milk production, by 25 for fat yield and by 20 for protein yield. Starting values used in the maximisation procedure were random numbers drawn from a standard normal distribution. Restrictions for the starting val- ues were: Q’Q’ > 0, Q’Q’ < 0 , u > 0,O <
p
< 0.5 and 0 < r < 0.5. Convergence was assumed when the difference between the simplex point with the highest and the lowest likelihood was less than 0.001. Maximization was restarted using the param- eter values at the maximum as starting values. This whole pro- cedure was repeated using different random numbers as start- ing values as a check to see whether the global maximum was reached.Test statistic: Significance of a linked QTL effect was tested by using the following likelihood ratio test statistic
Likelihood ratio test statistic = ln(LI r = 0.5) - ln(LI r = ?)
where
ln(LI r = 0.5) = the natural logarithm of the likelihood with rfixed at 0.5 and maximized for all other parameters
ln(LI r = ?) = the natural logarithm of the likelihood maximized for all parameters.
Under the null hypothesis of r = 0.5, i.e., no linkage be- tween the marker and a QTL, the test statistic is asymptotically distributed as -
(x:)
(SIMPSON 1989). Significance of markergenotype effects was also tested by a likelihood ratio test, with the null hypothesis that all marker genotypes have the same effect on the production trait. The denominator of the test statistic was computed by maximizing the likelihood for all parameters, while the numerator was computed by maximiz- ing the likelihood function under the constraint that all marker genotype effects are equal, i . e . , set equal to zero. Un- der the null h othesis, this test statistic is asymptotically dis- tributed as -
(x:,f,),
where d.f., the degrees of freedom, equals the difference in the number of parameters maximizedYP
by the full model and the alternative hypothesis. Because for both hypotheses M’M’ was fixed at zero, the d.f. is one less than the number of marker genotypes.
Following LANDERand BOTSTEIN (1989), support intervals for
r were computed by maximizing the likelihood function for the other parameters with r fixed at a range of values; from
r = 0.0 to r = 0.5, with increments of 0.05.
Simulation study: Simulation was used to verify the estima- tion procedure. The additive genetic value of sire i due to many background QTLs or polygenes, each with a small effect, was simulated as a random deviate from a normal distribution with a mean of zero and a standard deviation of a“. The ad- ditive genetic value due to polygenes for daughter j of sire i,
a,,, was simulated as follows
a. = I . a
+
Y 2 2
4
.
a,where
a, = additive genetic value of sire i.
xt, = random number from a standard normal distribution for daughter j of sire i.
aa = the additive genetic standard deviation.
Marker and QTL genotypes of sires were simulated by sam- pling from a uniform distribution using the population gene frequencies. Marker and QTL genotypes of daughters were simulated by sampling from uniform distributions, accounting for the genotype of the sire, mendelian transmission prob- abilities, the recombination fraction between the marker and the linked QTL and the genotype frequencies in the popula- tion. Daughter quantitative trait values were then simulated as;
y!, = ay
+
MARKER,+
QTL,+
wY.
a,where
ys = quantitative trait value of daughter j of sire i.
a, = additive genetic value due to polygenes for daughter j of sire i.
MARKER, = effect of marker genotype k.
QTL, = effect of QTL genotype 1.
wtl = random number from a standard normal distribution for daughter j of sire i.
a, = the environmental standard deviation.
Five thousand daughter records were simulated, divided into 100 half-sib families of 50. The frequency of the M’ and Q’ alleles in the sire and dam population was set at 0.5, a: was 160,000, and a: was 373,333. Ignoring QTL and marker ef- fects, heritability = 0.3, which is similar to the heritability of milk production in the Dutch dairy population. The simulated residual standard deviation ( i . e . , a in the likelihood equa- tions) was computed as the within sire additive genetic vari- ance due to polygenes and the environmental variance, i. e . ,
d
w
= 702.4.ML Mapping of Dairy Cattle QTL 271
between Dutch-Friesians and Holstein-Friesians; the mean fraction of Holstein-Friesian genes of heifers was 0.63.
One milk sample of each cow was used to determine the genotypes for q c a s e i n , h a s e i n , K-casein, and placto- globulin by isoelectric focusing (BOVENHUIS and VERSTEGE 1989). Milk protein gene frequencies were as described by BOVENHUIS and VAN ARENDONK (1991). Pedigree information, heifer breed, and 305-day milk production records for milk, fat and protein yield, and fat and protein percent were obtained from the registration files of the Royal Dutch Cattle Syndicate. Milk production records were based on testday observations every 3 or 4 weeks as part of the national milk recording scheme.
To avoid selection bias, only first lactation records where analyzed. Incomplete lactations with at least 90 days in milk were extended to expected 305day production by the meth- ods of WILMINK (1987), accounting for herd level, calving age, and year-season of calving.
Adjustment for flied effects: Milk, fat, and protein yield, and fat and protein percent were adjusted individually for fixed effects using the following fixed model
ylrrfm = H E ,
+
b,(C; - C.)+
b2(C, - C.1'+
Mk + HF, +where
yilkfm = the production record for each trait for a cow from the ith herd-year-season, of the j t h calving age and kth calving month, of the lth Holstein Friesian genetic group.
HYS, = The ith herd-year-season of calving. Three year-seasons were defined: February 1988 to August 1988, September 1988 to January 1989, February 1989 to August 1989.
C;
= The jth calving age in months.C. = The mean calving age.
6, = The linear regression coefficient of age at calving.
b2 = The quadratic regression coefficient of age at calving.
Mk = The kth calendar month of calving.
HF, = The lth Holstein Friesian genetic group. Nine groups were defined.
eilrfm = The random residual associated with each record.
HYS with <3 records were deleted, leaving 6803 cows and 171 1 HYS. Solutions were obtained by Gauss-Seidel iteration as described by SCHAEFFER and KENNEDY (1986). The data, after adjusting for fixed effects, were used in subsequent analysis.
Because the likelihood functions previously described a s sume underlying normal distributions, the distributions of the adjusted production records for each trait were tested for de- viation from normality using the Kolmogorov D statistic (SAS, 1982). The skewness and kurtosis for the distributions of the adjusted production records for each trait were also calculated
(SAS, 1982).
Milk protein genotypes of sires: Milk protein genotypes of sires were not known and were determined from information on 10,151 daughters, as described by BOVENHUIS a n d V u AREN-
DONK (1991). The model accounted for differences in milk
protein gene frequencies between Dutch Friesian and Hol-
stein Friesian breeds and for the probability of misclassifica- tions. Given the genotypes of the daughters and the param- eters, for each sire the likelihoods for all possible genotypes were calculated. Sires were assigned the genotype with the highest likelihood.
RESULTS
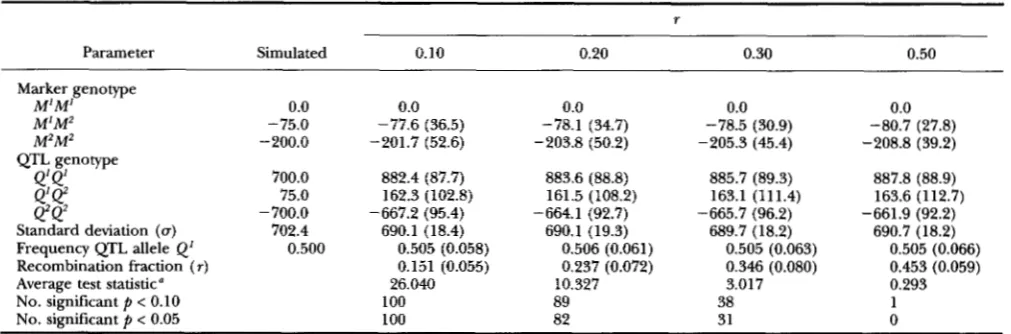
Simulation study: Mean ML parameter estimates a n d empirical standard deviations of estimates computed from 100 replicates for 4 sets of simulated data that differ with respect to the simulated recombination fraction are in Table 1. T h e average test statistic for the 100 replicates was 26.04 for a simulated recombination fraction of 0.10,
10.33 for a simulated recombination fraction of 0.20, 3.02 for a simulated recombination fraction of 0.20 a n d 0.29 for simulated recombination fractions of 0.50. T h e effect of the linked QTL was significant (
p
< 0.05) for all the replicates if the simulated recombination fraction was 0.10. If a QTL unlinked to the marker ( r = 0.5) was segregating in the simulated population, 1 o u t of 100 replicates was significant at the 10% level and none of the replicates was significant at the 5% level.As
com- pared to the expected numbers of 10, forP <
0.10, a n d 5, for P<
0.05, this indicates that the test statistic can be considered conservative. The mean estimated marker genotype effects agree closely to the simulated marker genotype effects of-75
for M1M2 a n d -200 for M2M2.There seems to be a slight tendency for the estimated marker genotype effects to increase as r increases. For r = 0.50 the estimated marker genotype effects differ significantly from the simulated values. Empirical stand- ard deviations of the estimated marker genotype effects ranged from
27
through37
for M1M2 and from 39 through 53 for M2M2. T h e M2M2 genotype effect was estimated less accurately because there were less M2M2than M1M2 observations. For all simulated recombina- tion fractions the difference between the estimated
Q'Q'
a n dQ2Q2
genotype effects was close to 1550. This is larger than the simulated difference of 1400. T h e em- pirical standard deviations of the estimates averaged 88.7 forQ 1 @ ,
108.8 for Q'Q', and 94.1 for Q2Q2. T h e estimated residual standard deviation of around 690 was slightly lower than the simulated value of 702.4. T h e mean estimated frequency of theQ1
allele was 0.505, as compared to the simulated value of 0.5. The mean estimate for the recombination fraction was 0.151 for a simulated recombination fraction of 0.10, 0.237 for a simulated recombination fraction of 0.20, 0.346 for a simulated recombination fraction of 0.30 a n d 0.453 for a simulated recombination fraction of 0.50. The empiri- cal standard deviation of the estimate was 0.06 for a re- combination fraction of 0.10, 0.07 for a recombination fraction of 0.20, 0.08 for a recombination fraction of 0.30 a n d 0.06 for a recombination fraction of 0.50.Descriptive statistics: Observed milk protein geno-
272
TABLE 1
Mean maximum likelihood estimates and empirical standard deviations of the estimates from a simulation study over 100 replicates
~~~~ ~ ~~ ~
r
Parameter Simulated 0.10 0.20 0.30 0.50
Marker genotype
M'M' M'M2
0.0 0.0 0.0 0.0 0.0
-75.0 -77.6 (36.5) -78.1 (34.7) -78.5 (30.9)
M ~ M ~
-80.7 (27.8) -200.0 -201.7 (52.6) -203.8 (50.2) -205.3 (45.4) -208.8 (39.2)
QTL genotype
Q'Q'
700.0 882.4 (87.7) 883.6 (88.8) 885.7 (89.3)Q'Q2
99
887.8 (88.9)
75.0 162.3 (102.8) 161.5 (108.2) 163.1 (111.4) 163.6 (112.7)
-700.0 -667.2 (95.4) -664.1 (92.7) -665.7 (96.2) -661.9 (92.2)
Standard deviation (u) 702.4 690.1 (18.4) 690.1 (19.3) 689.7 (18.2) 690.7 (18.2)
Frequency QTL allele Q' 0.500 0.505 (0.058) 0.506 (0.061) 0.505 (0.063) 0.505 (0.066)
Recombination fraction ( r ) 0.151 (0.055) 0.237 (0.072) 0.346 (0.080) 0.453 (0.059)
Average test statistic" 26.040 10.327 3.017 0.293
No. significant p < 0.10 100 89 38 1
No. significant p < 0.05 100 82 31 0
Sampling standard deviation is based on estimates of 100 replicates. Likelihood ratio test statistic for linked QTL.
not computed for a,,-casein because frequency of the rare allele, C, was very low. No sires were homozygous for this allele, and only one sire was heterozygous for asl-
casein. Frequencies for e a s e i n BB, A'A3, A2A3 and A3B genotypes were also very low. Nearly 97% of the cows had A'A', A'A2, A2A2, A'B and A2B @casein genotypes. Only these genotypes were included in the ML analysis. More than 50% of the sires were heterozygous for e a s e i n . The Kcasein A allele was the most common, and
28%
of the sires were heterozygous. Frequencies for the A and B @lactoglobulin alleles were similar, and 45% of the sires were heterozygous.The basic statistics of the production traits before and after adjustment for fixed effects are given in Table 3. As expected, the means after adjustment for fixed effects are nearly equal to zero, and the standard deviations are lower. Skewness was close to zero, but kurtosis was positive for all traits. The Kolmogorov
D
statistic indicated that the distributions for milk and protein yield and protein percent differed signifi- cantly from normality (
p <
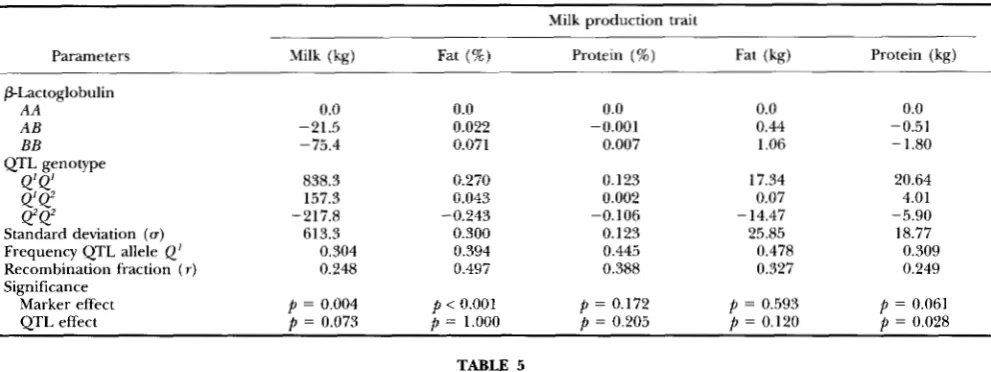
0.05). Thus these traits may not accurately fit the likelihood functions used to es- timate linked QTL-effects.Maximum likelihood estimation: The ML estimates for effects of milk protein genotypes and QTLs linked to the milk protein genes on production traits are given in Table 4 for Plactoglobulin, in Table 5 for Kcasein, and in Table 6 for e a s e i n . Significant effects for the Plactoglobulin locus on milk yield (
p
= 0.004) and fat percent (p
<
0.001) were found. Further, a QTL linked to the Plactoglobulin locus with a significant effect on protein yield( p
= 0.028) was found. Estimates for PlactoglobulinAB
were -21 kg milk and +0.02% fat. Estimates for Plactoglobulin BB were -75 kg milk and +0.07% fat. The estimated difference between the homozygous QTL genotypes was 26.5 kg of protein. The ML estimate for r was 0.25, and the frequency of theTABLE 2
Genotype frequencies (in %) of cy,,-in, &casein, K - C ~ S ~ ~ U
and /%lactoglobulin for 6803 daughters and 114 sires (inferred from information on 10,151 daughters)
Milk protein
genotype Daughters Sires
a,,-Casein
BB BC
PCasein
A'A
A ' A ~
A ~ A ~
A ~ B
A ' A ~ A'B
BB
A2A3 A3B
K-Casein
A A A B BB
96.4 3.6
29.3 42.0 11.2 10.1 5.0 0.5 0.9 0.6 0.3
63.6 32.6 3.7
99.1 0.9
22.8 40.3 24.6 6.1 5.3 0.9 0.0 0.0 0.0
68.4 28.1 3.5 PLactoglobulin
AA 19.2 12.3
A B 50.5 45.6
BB 30.2 42.1
positive
Q'
allele was 0.31. ML estimates for rwithin the parameter space of 0 to 0.5 were also found for milk yield, protein percent and fat yield. For fat % the esti- mate for r was about 0.5.K-Casein had a significant direct effect on milk yield (
p
=0.019), protein percent
( p
<
0.001) and fat yield( p
=0.036). Significant effects of QTLs linked to Kcasein were found for fat percent (
p
= 0.005) and fat yield (p
= 0.01 3). Estimates for Kcasein ABwere -38 kg milk, +0.02% p r e tein and - 1.8 kg fat. Estimates for Kcasein BB were -95ML Mapping of Dairy Cattle QTL 273
TABLE 3
The mean and the standard deviation before adjusting the data for fiied effects and the mean, the standard deviation, the skewness and the kurtosis of the distribution after adjusting for fiied effects based on the 6803 records included in the analysis.
Before After
Trait Mean U Mean U Skewness Kurtosis
Milk (kg) 6137.8 1009.6 -0.05 686.9 0.089 0.547
Fat (%) 4.56 0.445 -0.00 0.352 0.034 0.160
Protein (%) 3.46 0.191 0.00 0.147 0.060 0.087
Fat (kg) 278.5 43.16 -0.00 28.14
Protein (kg) 211.9 32.81 -0.00 20.38 -0.015 0.639
-0.024 0.334
TABLE 4
Maximum likelihood estimates of Plactoglobulin genotypes and parameters that refer to a linked QTL on milk production traits Milk production trait
Parameters Milk (kg) Fat (%) Protein (%) Fat (kg) Protein (kg)
~ ~~ ~
PLactoglobulin
A A 0.0 0.0 0.0 0.0 0.0
A B -21.5 0.022 -0.001 0.44 -0.51
BB -75.4 0.071 0.007 1.06 - 1.80
17.34 20.64
4.01
- 14.47 -5.90
Standard deviation (u) 613.3 0.300 0.123 25.85 18.77
Frequency QTL allele Q' 0.304 0.394 0.445 0.478 0.309
Recombination fraction ( r ) 0.248 0.497 0.388 0.327 0.249
Significance QTL genotype
Q'Q'
838.3 0.270 0.1234'
Q'
157.3 0.043 0.002 0.07Q2Q2 -217.8 -0.243 -0.106
Marker effect p = 0.004 p < 0.001 p = 0.172 p = 0.593
p
= 0.061QTL effect p = 0.073 p = 1.000 p = 0.205 p = 0.120
p
= 0.028TABLE 5
Maximum likelihood estimates of K-casein genotypes and parameters that refer to a l i e d QTL on milk production traits
~~ ~~ ~ ~
Milk production trait
Parameters Milk (kg) Fat (%) Protein (%) Fat (kg) Protein (kg)
K-Casein
A A A B BB
Frequency QTL allele Q' Recombination fraction ( r ) Significance
QTL effect Marker effect
0.0 -38.1 -94.7
956.7 217.2 -204.3
614.8 0.246 0.500
p = 0.019 p = 1.000
0.0 -0.001
0.020
0.295 0.036 -0.249
0.295 0.448 0.277
p = 0.660 p = 0.005
0.0 0.020 0.052
0.110 -0.012 -0.113 0.123 0.474 0.425
p < 0.001 p = 0.468
0.0 -1.82 -2.91
18.94 2.04 -13.31
25.77 0.461 0.273
p = 0.036
p = 0.013
0.0 -0.02 -0.28
26.64 5.56 -5.13
18.84 0.226 0.500
p
= 0.982 p = 1.000The frequency of the positive allele was 0.45. The recom- bination fraction between the QTL afFecting fat yield and K-casein was 0.27 and the frequency for Q' was 0.46. The homozygote QTL genotypes differed 32.3 kg of fat. ML estimates for r were 0.50 for milk yield and protein yield.
pcasein genotypes had significant effects on all milk production traits. Especially cows with pcasein A'B dif- fered from Pcasein A'A' cows: lower milk production ( - 11
7
kg), higher fat percent (+0.04%), higher proteinpercent (+0.03%), lower fat yield ( - 5 . 6 kg) and lower protein yield (-2.9). A significant linked QTL effect was found only for fat percent (
p
< 0.001). The estimated difference between the homozygote QTL genotypes was 0.52% fat. The likelihood was maximum for a recom- bination fraction 0.30, and the estimated frequency of the @-allele was 0.41.TABLE 6
Maximum likelihood estimates of m e i n genotypes and parameters that refer to a linked QTL on milk production trait
Milk production trait
Parameters Milk (kg) Fat (%) Protein (%) Fat (kg) Protein (kg)
pCasein
A ‘A’ 0.0 0.0 0.0 0.0
A r ~ 2
A ~ A ~
A*B
13.2
0.0
-0.031 0.002 - 1.25 0.76
-12.5 0.009 0.008 -0.39 0.22
- 117.2 0.042 0.032 -5.61 -2.93
-5.0 0.015 0.020 -2.26 0.32
536.1 0.305 0.115 17.17 18.83
-8.2 0.081 -0.009 1.76 3.03
-7.47
615.9 0.299 0.122 25.98 18.63
A’B
QTL genotype
Q’ Q’
Q’
Q2Q2Q2 -332.7 -0.217 -0.113 -13.22
Standard deviation (a)
Frequency QTL allele Q’ 0.442 0.405 0.472 0.494 0.318 Recombination fraction ( r ) 0.381 0.298 0.397 0.327 0.499 Significance
Marker effect p = 0.002 p < 0.001 p < 0.001 p = 0.033 p = 0.022
QTL effect p = 0.639 p = 0.002 p = 0.257 p = 1.000 p = 1.000
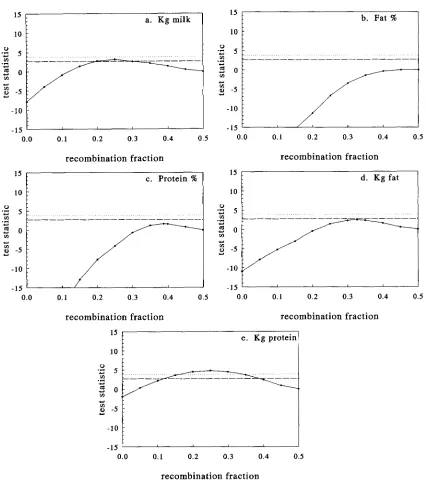
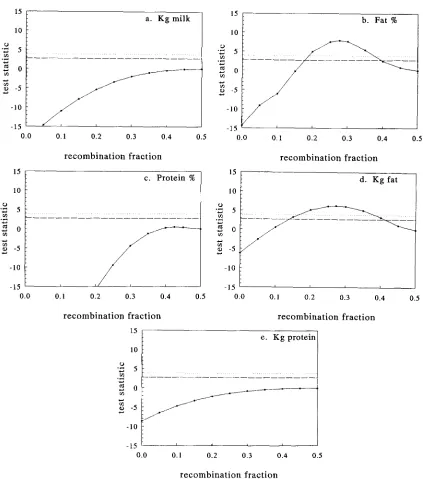
2 for Kcasein and in Figure 3 for Pcasein. The test sta- tistics for significant difference from the null hypothesis of r = 0.5 for
p
<
0.1 andp
<
0.05 are denoted in the figures by horizontal lines. Ten percent support inter- vals are about 20.0’7 recombination frequency for the QTLs linked to Kcasein and @casein affecting fat%, about ?0.11 recombination frequency for the QTL linked to Kcasein affecting fat yield and about 20.15 recombination frequency for the QTL linked to Plactoglobulin affecting protein yield.DISCUSSION
The model: Verification of the model by simulation showed that the model tended to overestimate the re- combination fraction by 0.04 to 0.05. The estimated dif- ference between the homozygous QTL genotypes was about 1550 (i. e . , 2.1 up), whereas the simulated differ- ence was 1400 (1.9 up). Information on the QTL geno- type effects comes from the within sire difference be- tween daughter groups homozygous for the marker of sires heterozygous for the marker. The expectation of this difference for complete additivity is: (1 - 2r)a, where a is half the difference between the means of the two QTL homozygotes. Based on the simulated param- eters, the expected difference between M’M’ and M2M2
daughters is 560 for r = 0.10,420 for r = 0.20 and 280 for r = 0.30. The estimated parameters suggest a dif- ference of 541 for r = 0.10,407 for r = 0.20 and 239 for
r = 0.30. These differ slightly from the values calculated based on simulated parameters. It illustrates, however, that estimates for the recombination fraction and the QTL genotype effects are correlated, and that both are sensitive to small changes in the difference between
M’M’ and M2M2 daughters of a double heterozygous
sire. This is also reflected in the high empirical standard errors found for these parameters in the simulation study, especially when the distance between the marker
and the QTL increases. The empirical standard error for
r when the simulated recombination fraction is 0.50 is 0.059. This is lower than the empirical standard of 0.080 found for r = 0.30 and therefore seems to conflict with the general tendency of the empirical standard error to increase if r increases.
It
should, however, be noticed that r = 0.50 is at the edge of the parameter space. The frequency of the QTL allele was accurately estimated, and with a low standard deviation.MARTINEZ and CURNOW (1992) showed that the posi- tion and the size of the effect of a QTL lying between two flanking markers is affected by QTLs lying outside the marker bracket. By including a second QTL in the model correct results could be obtained. The model used in the present study accounts for both an effect of a marker and a linked QTL on a quantitative trait. To investigate the consequences of not taking into account a simulated marker effect, a model that only accounts for an effect of the linked QTL was studied. This model resulted in a higher test statistic: for a simulated re- combination fraction of 0.5 the average test statistic was 2.317 and 23 out of the 100 replicates were sig- nificant at the 5% level. The average estimated re- combination fraction for this situation was 0.36, i.&,
considerably lower than the average recombination fraction of 0.45 in Table 1. As described by MARTINEZ and CURNOW (1992), if two QTLs are segregating, but the model accounts for only one QTL, the model tends to put a “ghost” QTL somewhere in between the two real QTLs.
ML Mapping of Dairy Cattle QTL 275
15
a. K g milk 15 b. Fat %
5
0
-5
I
-10-15 I
0.0 0.1 0.2 0.3 0.4 0 . 5
_""""_""""""
1
0.0 0.1 0.2 0.3 0.4 0.5
recombination fraction recombination fraction
15 .
c. Protein % 15 .
10
:
3 5
:
10
:
d. K g fat
.-
c) 5 :0
-v):
0 .
.r( c)
9 0 :
z
-5:
Y
c)
v) v ) .
c)
-10 :
-15 -15
0.0 0.1 0.2 0.3 0.4 0.5 0.0 0.1 0.2 0.3 0.4 0.5
recombination fraction recombination fraction
v)
.-
c)9 0
v)
c)
c)
z
- 5 10.0 0.1 0.2 0.3 0.4 0.5
recombination fraction
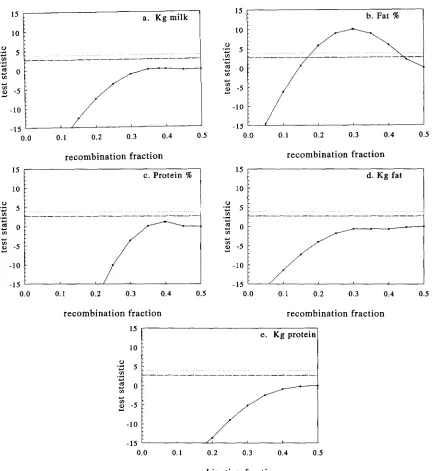
FIGURE l.-The test statistic as a function of r and maximized for the other parameters for the five traits analyzed when Plactoglobulin was used as a genetic marker. The test statistics for significant differences from the null hypothesis of r = 0.5 for
p
< 0.1 andp
< 0.05 are denoted by horizontal lines.p
= 0.05 (.. .
.);p
= 0.10 (---).quantitative trait. However, a very similar situation, with respect to the ML model, could arise by two closely linked loci.
The assumption that the sire population is in Hardy- Weinberg equilibrium with respect to the genotype frequencies of the QTL becomes less important as the number of daughter records increases. With many daughter records, the information on the QTL geno- type of the sire is overwhelmed by the information from the daughters (M. J. MACKINNON and J. I. WELLER, unpublished data; J. I. WELLER, H. PASTERNAK and H. BOVENHUIS, unpublished data). The model further as- sumed linkage equilibrium between the marker and the
QTL. If this assumption is incorrect, the model will not be able to separate accurately marker and QTL genotype effects. This is because estimated QTL genotype effects are affected by marker genotype effects if coupling and repulsion phases do not appear at equal frequencies. It is expected that in this case marker genotype effects will be overestimated and QTL genotype effects will be underestimated, regardless of the number of records analyzed.
H. Bovenhuis and J. I. Weller
15
10
- 5
2 0
.0 3
v1
.3
*
m
v) 4 4 0 -5
-10
-15
1
a. K g milkI
15 .
b. Fat %
u m
.+ * 5
2 0
.* 3
m m
4
* 0 -5
-10
- 1 5
0.0 0.1 0.2 0 . 3 0.4 0.5 0.0 0.1 0 . 2 0 . 3 0.4 0.5
recombination fraction
15
c. Protein X
I
-15
0.0 0.1 0.2 0 . 3 0.4 0.5
recombination fraction
15
d. K g fat
10
-10
1
-15 I
0.0 0.1 0 . 2 0.3 0.4 0.5
recombination fraction recombination fraction
15
e. K g protein
10
-15
'
0.0 0.1 0 . 2 0 . 3 0.4 0.5
recombination fraction
FIGURE 2.-The test statistic as a function of T and maximized for the other parameters for the five traits analyzed when K-casein
was used as a genetic marker. The test statistics for significant differences from the null hypothesis of r = 0.5 for
p
< 0.1 andp
< 0.05 are denoted by horizontal lines.
p
= 0.05 (.. . .
-);p
= 0.10 (--
-).higher. This should not result in serious problems with many daughter records. The information on allele fre- quencies derived from sires will be overwhelmed by in- formation on the daughters. Selection that takes place in the daughters, however, can substantially reduce the difference between marker genotype means, i . e . , be- tween M'M' and M2M2 daughters and thus reducing the power to detect linkage (MACKINNON and GEORGES 1992). To avoid selection in the daughters only first lactation records were analyzed and incomplete lactations were extended to expected 305day production.
The model ignores additive genetic effects due to background QTLs or polygenes. Consequently, differ-
ML Mapping of Dairy Cattle QTL 277
15 .
10
9 0 :
: 'S 5
r
a. Kg milk
0
-v) """"i""""""".
.r(
U
Y
v)
v l :
a, -5 .
-10
-15
:
Y
0.0 0.1 0.2 0.3 0.4 0.5
recombination fraction
15
c . Protein %
0.0 0.1 0.2 0.3 0.4 0.5
recombination fraction
15
10
u 5
9 0
h:
-5.CI 0
v)
.r. Y
v1
Y
Y
-10
15
b. Fat %
10
3 5
9 0
h:
-50
vl
.CI
Y
v)
Y Y
-10
-15
0.0 0.1 0.2 0.3 0.4 0.5
recombination fraction
15
d. Kg fat
10
-15
0.0 0.1 0.2 0.3 0.4 0.5
recombination fraction
I
e . Kg protein0.0 0.1 0.2 0.3 0.4 0.5
recombination fraction
FIGURE 3.-The test statistic as a function of rand maximized for the other parameters for the five traits analyzed when &casein was used as a genetic marker. The test statistics for significant differences from the null hypothesis of r = 0.5 for
p
< 0.1 andp
< 0.05 are denoted by horizontal lines.p
= 0.05 ( e. . .
* .);p
= 0.10 (--
-).effects. Also in the present simulation study, i e . , a situ- ation without linkage disequilibrium between the marker or QTL genotypes and the polygenes, QTL genotype effects were overestimated. This stresses the need for models that simultaneously estimate marker and QTL genotype effects and additive genetic variance due to polygenes in order to obtain more accurate QTL parameter estimates
(J.
I. WELLER, H. PASTERNAK and H. BOVENHUIS, unpublished data).Direct effects of the milk protein loci: The significant effects of Plactoglobulin on milk yield, fat percent and protein yield found in this study are consistent with pre- vious results based on the same data but using a different
analysis (BOVENHUIS et al. 1992). The significant effect of Plactoglobulin on fat percent was reported in several other studies (ALFANDRI et al. 1990; GRAML et al. 1986; HAENLEIN et al. 1987; NGKWAI-HANG et al. 1984). In all these studies Plactoglobulin BB genotype cows had a higher fat percent. Significant effects of Kcasein on milk yield, protein percent and fat yield were also found by BOVENHUIS et al. (1992). The R a s e i n and Kcasein genes are closely linked (GROSCLAUDE et al. 1973; HINES et al.
278 H. I.
that in the present data set pcasein and Kcasein are in linkage disequilibrium, and that the effect of K-casein on milk yield and fat yield is in fact due to the Pcasein gene. The effect on protein percent, however, can be attrib- uted to the K-casein gene. A significant direct effect of Kcasein on protein percent was reported in several other studies (ALEANDRI et al. 1990; GONYON et al. 1987; NGKWAI-HANG et al. 1984). As found in the present study, K-casein BB genotype cows produced milk with a higher protein percent than K-casein AA cows. Some studies indicate that the Kcasein B allele is associated with a higher K-casein production which would explain the higher protein content (VAN EENENNAAM and MEDRANO 1991; VAN DEN BERG et al. 1992).
Significant effects of Pcasein genotypes on milk yield, fat percent, protein percent fat yield and protein yield were found. In a previous study BOVENHUIS et al. (1992) found significant effects on milk yield, fat percent, pro- tein percent and protein yield. However, BOVENHUIS
et al. (1992) indicated that the effect of pcasein on protein percent is in fact due to linkage disequilibrium with the closely linked K-casein gene.
Effects of linked
QTL in
field data: For 15 analyses, it is expected that one analysis should display signifi- cance at the 5% level purely by chance (WELLER et al. 1988). In fact, four significant linked QTLeffects were found, two with respect to fat percent, one on fat yield and one on protein yield. Two of these effects were sig- nificant at the one percent level. Thus it is justified to assume that these are “true” effects. For the nonsignificant effects, was outside or on the edge of the parameter space in four cases, but always at r = 0.5. No cases were found with ML at r = 0, all estimates of rwere >0.2. Apparently when both a direct marker, and a linked QTL effect are postu- lated, the model cannot distinguish between a closely linked QTL and a direct marker effect. All ML estimates for QTL allele frequency were between 0.2 and 0.5.Significant effects of QTLs linked to K-casein and p-casein, which are closely linked, were found for fat percent. The estimates of r, 0.277 and 0.298, for K-casein and @casein, respectively, suggest that the same QTL may have been detected by both markers. The estimated frequencies of the favourable Q’ allele, 0.448 and 0.405 for K-casein and wasein, respectively; and the estimates for the QTL genotype effects presented in Tables 5 and 6 are consistent with this conclusion. Because p-casein is more polymorphic, it is a better genetic marker and estimates of the QTL are expected to be more accurate. This is reflected in the higher significance level for the QTL when using wasein as a genetic marker;
p
= 0.002 us.p
= 0.005 when using Kcasein as a genetic marker. This is the second known case in which location of a QTL by ML in field data was independently confirmed(WELLER 1986).
K-Casein was further shown to be significantly linked to a QTL affecting fat yield. This result, however, could
not be confirmed for the closely linked @casein. The estimates for r (0.273) indicates that this might be the same QTL as the one which affects fat percent. The ge- netic correlation between fat percent and fat yield of 0.39 (VAN DER WEN and DE
BOER
1989) suggests there are some loci affecting both traits, where alleles with a positive effect on fat percent tend to have a positive ef- fect on fat yield. As the optimization is such that the Q’Q’ is always set positive and theQIQ’
is set negative, it is not clear whether the estimate for the Q‘Q’ genotype effect on fat percent in Table 5 corresponds with the Q’Q’ genotype effect for fat yield or with the @@‘genotype effect for fat yield. The frequency of the Q’ allele for fat percent (0.45) and the frequency of the Q’ allele for fat yield (0.46) is slightly in favour of the former explanation.A significant effect (
p
= 0.028) of a QTL linked to P-lactoglobulin on protein yield was found. A QTL linked to P-lactoglobulin affecting milk yield was close to significance( p
= 0.07). The genetic correlation between milk yield and protein yield of 0.87 (VAN DER WERF and DE BOER 1989) suggests that the majority of genes affecting protein yield also affect milk yield. Further, most of the alleles that positively affect pro- tein yield also have a positive effect on milk yield. The estimated recombination fractions for the QTL linked to P-lactoglobulin affecting protein yield and milk yield is similar. The same holds for the frequency of the Q’ allele. This supports the hypothesis that a single locus is responsible for the effects on both traits.A limited number of studies considered effects of genes linked to milk protein genes. GONYON et al. (1987) used analysis of variance, where marker groups were nested within sires, to detect effects of QTL linked to milk protein loci on milk production traits. Significant associations between K-casein and fat percent
( p
=0.001) and protein percent
( p
= 0.047) were found. However, these results could not be confirmed when using the closely linked p-casein as a genetic marker, instead of K-casein. HAENLEIN et al. (1987) performed a similar analysis in another breed, but could not confirm the results found by GONYON et al. (1987). Significant effects by analysis of variance, with marker genotypes nested within sires, could also occur due to a direct effect of the marker gene.ML Mapping of Dairy Cattle QTL 279
effects among 103 sons of two Holstein sires. The analy- sis were based on the predicted transmitting abilities of the sons for milk production traits. Among the offspring of one sire, the Kcasein B allele was associated with a 0.079% decreased transmitting ability for fat percent. For Plactoglobulin a significant chromosome substitu- tion effect was found on fat percent and milk protein yield. The effects of both genes found can be explained from the results of the present study.
The analysis of previous studies (COWAN et al. 1992; GELDERMANN et aZ. 1985; G ~ N Y ~ N et al. 1987; HAENLEIN et al.
1987) did not distinguish between direct effects and effects of linked QTL. Further, these studies did not account for recombination between the marker and the QTL.
Based on the estimated parameters, the additive ge- netic variance accounted for by the QTL linked to the casein genes is 0.035-0.037. The estimated additive ge- netic variance for fat percent in the Dutch cattle popu- lation based on about 400,000 records was 0.096 (VAN DER WERF and DE BOER 1989). The estimated additive genetic variance for fat percent in the present data was 0.128 (SAS GLM type 111, 1982). When using the latter estimate the QTL would explain around 28% of the ad- ditive genetic variation. Genes with effects of this mag- nitude or greater have been detected in commercial ani- mal populations (HANSET 1982), and it may be possible to detect this locus even without the use of genetic mark- ers (HOESCHELE 1988). BOICHARD et al. (1990) used meth- ods derived from segregation analysis to investigate the presence of one major gene affecting fat content. Al- though the null hypothesis of pure polygenic additive inheritance was always rejected, the estimated transmis- sion probabilities for the major gene allele differed strongly from Mendelian rules.
The Jblood group system is linked to Plactoglobulin, with r = 0.18 (HINES et al. 1981). The effect of the J
blood group on milk production traits has also been studied ( e . g . , GONYON et al. 1987; HAENLEIN et al., 1987; NIEMANN-SORENSEN and ROBERTSON 1961). G ~ N Y O N et al.
(1987) found a significant effect of the J blood group system on protein percent (
p
= 0.006). At a population level, associations were found between the Jblood group and fat percent (HAENLEIS et al. 1987; NIEMANN-SORENSEN and ROBERTSON 1961). However, GONYON et al. (1987) did not find a significant effect for fat percent in a within family analysis. It is possible that the QTL affecting pro- tein yield linked to Plactoglobulin could also be de- tected by an ML analysis using the J blood group as a genetic marker.Conclusions: The maximum likelihood model used in this study allowed for direct effects of a marker gene and effects of a linked QTL on a quantitative trait in a segregating population. Verification of the model by simulation showed that the model tended to overesti- mate differences between homozygous QTL genotype effects and recombination fractions. High empirical
standard errors were found for the recombination frac- tion and the QTL genotype effects. The significant di- rect effects of milk protein genotypes found in this study are in agreement with results reported in literature. The significant linked QTL effects found in the present study seem to be supported by results in literature. However, the analysis of previous studies did not distinguish be- tween direct effects and effects of linked QTL. Further, these studies did not account for recombination be- tween the marker and the QTL. The estimates of the recombination fraction, the QTL allele frequency and the estimated QTL genotype effects when using K-casein or @casein as genetic markers indicate that the same linked QTL affecting fat percent has been detected.
The authors wish to express their thanks to SIJNE VAN DER BEEK for his very useful comments on a previous version of this manuscript,
MARGARET MACKINNON for the many discussions, ESTHER VERSTEGE for phenotyping the milk samples and the Royal Dutch Cattle Syndicate for supplying the data and financial support.
LITERATURE CITED
ALEANDRI, R., L. G . BUTTAZZONI, J. C. SCHNEIDER, A. CAROL] and R.
DAVOLI, 1990 The effects of milk protein polymorphisms on milk components and cheese-producing ability. J. Dairy Sci. 73:
BOICHARD, D., J. M. ELSEN, P. LE Rovand B. BONNTI, 1990 Segregation analysis of fat content data in Holstein
*
European Friesian cross- bred cattle pp. 167-170 in Proceedings Fourth World Congress on Genetics Applied to Livestock Production, Vol. XN. Edinburgh. BOVENHUIS, H., and J. A. M. VAN ARENDONK, 1991 Estimation of milkprotein gene frequencies in crossbred cattle by maximum like- lihood. J. Dairy Sci. 74: 2728-2736.
BOVENHUIS, H., and A. J. M. VERSTEGE, 1989 Improved method for
PhastSystem. Neth. Milk Dairy J. 43: 447-451.
phenotyping milk protein variants by isoelectric focusing using
BOVENHUIS, H., J. A. M. VAN ARENDONK and S. KORVER, 1992 Associa- tions between milk protein polymorphisms and milk production traits. J. Dairy Sci. 75: 2549-2559.
COWAN, C. M., M. R. DENTINE and T. COYLE, 1992 Chromosome sub-
stitution effects associated with K-casein and Plactoglobulin in Holstein cattle. J. Dairy Sci. 75: 1097-1104.
DENTINE, M. R., and C. M. COWAN, 1990 An analytical model for the estimation of chromosome substitution effects in the offspring of
Appl. Genet. 79: 775-780.
individuals heterozygous at a segregating marker locus. Theor.
EIGEL, W. N., J. E. BUTLER, C. A. ERNSTROM, H. M. FARREL, JR., V. R.
HARWALKER et al., 1984 Nomenclature of proteins of cow’s milk fifth revision. J. Dairy Sci. 67: 1599-1631.
GELDERMANN, H., 1975 Investigations on inheritance of quantitative characters in animals by gene markers. I. Methods. Theor. Appl. Genet. 46: 319-330.
GELDERMANN, H., U. PIEPER and B. ROTH, 1985 Effects of marked c h r e mosome sections on milk performance in cattle. Theor. Appl. Genet. 7 0 138-146.
GONYON, D. S., R. E. MATHER, H. C. HINES, G. F. W. HAENLEIN,
C. W., ~ Vet al., E 1987 Associations of bovine blood and milk polymorphisms with lactation traits: Holsteins. J. Dairy Sci. 70:
GRAML, R., J. BUCHBERGER, H. KLOSTERMEYER and F. PIRCHNER, 1985
Pleiotrope wirkungen von Plactoglobulin- und casein genotypen auf milchfett- und milchproteinmengen des Bayerischen Fleck- viehs und Braunviehs. 2. Tierz. Zuechtungsbiol. 103: 33-45.
GRAML, R., J. BUCHBERGER, H. KLOSTERMEYER and F. PIRCHNER,
1986 Pleiotrope wirkungen von Plactoglobulin- und casein genotypen auf milchinhaltsstoffe des Bayerischen Fleckviehs und Braunviehs. 2. Tierz. Zuechtungsbiol. 102: 355-370.
GROSCLAUDE, F., J. C. MERCIERand B. R. RIBADFAU DUMAS, 1973 Genetic aspects of cattle casein research. Neth. Milk DairyJ. 27: 328-340.
241-255.
280 H. and
HAENLEIN, G. F. W., D. S. GONYON, R. E. MATHER and H. C. HINES,
1987 Associations of bovine blood and milk polymorphismswith lactation traits: Guernseys. J. Dairy Sci. 70: 2599-2609.
HANSET, R., 1982 Major genes in animal production, examples and perspectives: cattle and pigs, pp. 439-453 in Proceedings Second World Congress on Genetics Applied to Livestock Production, Vol.
VI. Madrid.
HINES, H. C., J. P. ZIKAKIS, G . F. W. HAENLEIN, C. A. KIDDY and C. L. TROWBRIDGE, 1981 Linkage relationships among loci of polymor- phisms in blood and milk of cattle. J. Dairy Sci.
64.
71-76.HOESCHELE, I., 1988 Statistical techniques for detection of major genes in animal breeding data. Theor. Appl. Genet. 76: 31 1-319.
JENSEN, J., 1989 Estimation of recombination parameters between a quantitative trait locus (QTL) and two marker gene loci. Theor. Appl. Genet. 78: 613-618.
KNAPP, S. J., 1991 Using molecular markers to map multiple quantitative loci: models for backcross, recombinant inbred, and doubled haploid progeny. Theor. Appl. Genet. 81:
333-338.
KNAPP, S. J., W. C. BRIDGES and D. BIRKES, 1990 Mapping quantitative trait loci using molecular marker linkage maps. Theor. Appl. Genet. 79: 583-592.
b o r n , S. A,, and C. S. HALEY, 1992 Maximum likelihood mapping of quantitative trait loci using full-sib families. Genetics 132:
1211-1222.
LANDER, E. S., and D. BOTSTEIN, 1989 Mapping Mendelian factors underlying quantitative traits using RFLP linkage maps. Genetics 121: 185-199.
MACKINNON, M. J., and A. J. GEORGES, 1992 The effect of selection on linkage analysis for quantitative traits. Genetics 132:
MARTINEZ, O., and R. N. Cumow, 1992 Estimating the locations and the sizes of the effects of quantitative trait loci using flanking markers. Theor. Appl. Genet. 85: 480-488.
NEIMANN-SOENSEN, A., and A. ROBERTSON, 1961 The associations be- tween blood groups and several production characteristics in three Danish cattle breeds. Acta Agnc. Scand. 11: 163-196.
NELDER, J. A., and R. MEAD, 1965 A simplex method for function minimization. Computer J. 7: 308-313.
NGKWAI-HANG, K F., J. F. HAms, J. E. MOXLEY and H. G. MONARDES,
1984 Association of genetic variants of casein and milk serum proteins with milk, fat, and protein production by dairy cattle. J. Dairy Sci. 67: 835-840.
SAS, 1982 SAS Users Guide: Statistics. Statistical Analysis System In- stitute, Inc., Cary, N.C.
SCHAEFFER, L. R., and B. W. KENNEDY, 1986 Computing solutions to mixed model equations, pp. 382-393 in Proceedings Third World Congress on Genetics Applied to Livestock Production, Vol. XII.
Lincoln, Nebraska.
SIMPSON, S. P., 1989 Detection of linkage between quantitative trait loci and restriction fragment length polymorphisms using inbred lines. Theor. Appl. Genet. 77: 815-819.
1177-1185.
SOLLER, M., 1990 Genetic mapping of the bovine genome using DNA-level markers with particular attention to loci affecting quantitative traits of economic importance. J. Dairy Sci. 73:
SOLLER, M., 1991 Mapping quantitative trait loci affecting traits of economic importance in animal populations using molecular markers, pp. 21-50 in Gene mapping: Strategies, Techniques and Applications, edited by L. B. SCHOOK, H. A. LEWN and D. G .
Mc-N. Marcel Dekker, New York.
SOLLER, M., T. BRODY and A. GENIZI, 1976 On the power of experi- mental designs for the detection of linkage between marker loci and quantitative loci in crosses between inbred lines. Theor. Appl. Genet. 47: 35-39.
SOLLER, M., and A. GENIZI, 1978 The efficiency of experimental de- signs for the detection of linkage between a marker locus and a locus affecting a quantitative trait in segregating populations. Biometrics 3 4 47-55.
THREADGILL, D. W., and J. E. WOMACK, 1990 Genomic analysis of the major bovine milk protein genes. Nucleic Acids Res. 18:
VAN DEN BERG, G., J. T. M. ESCHER, P. J. DE KONINC and H. BOVENHUIS,
1992 Genetic polymorphism of K-casein and @lactoglobulin in relation to milk composition and processing properties. Neth. Milk Dairy J. 46: 145-168.
VAN DER WERF, J. H. J., and W. DE BOER, 1989 Estimation of genetic parameters in a crossbred population of black and white dairy cattle. J. Dairy Sci. 72: 2615-2623.
VAN EENENNAAM, A. L., and J. F. MEDRANO, 1991 Differences in allelic protein expression in the milk of heterozygous K-casein cows. J.
Dairy Sci. 74: 1491-1496.
WELLER, J. I., 1986 Maximum likelihood techniques for the mapping and analysis of quantitative trait loci with the aid of genetic mark- ers. Biometrics 42: 627-640.
WELLER, J. I., 1987 Mapping and analysis of quantitative trait loci in
Lycopersicon. Heredity 59: 413-421.
WELLER, J. I., 1990 Experimental designs for mapping quantitative trait loci in segregating populations. pp. 113-1 16 in Proceedings Fourth World Congress on Genetics Applied to Livestock Produc-
tion, Vol. XI11 Edinburgh.
WELLER, J. I., M. SOLLER and T. BRODY, 1988 Linkage analysis of quan- titative traits in an interspecific cross of tomato ( L . esculentum X L. pimpinellifolium) by means of genetic markers. Genetics 118:
WELLER, J. I., Y. KASHI and M. SOLLER, 1990 Power of daughter and granddaughter designs for determining linkage between marker loci and quantitative trait loci in dairy cattle. J. Dairy Sci. 73: 2525-2537.
WILMINK, J. B. M., 1987 Studies on testday and lactation milk, fat and protein yield of dairy cows. Ph.D. Thesis, Wageningen Agricul- tural University, Netherlands.
2628-2646.
6935-6942.
329-339.