Copyright 0 1993 by the Genetics Society of America
Effects of Multiple Retrovirus Insertions on Quantitative Traits of Mice
Peter D. Keightley,* Martin
J.
Evanst and William
G . Hill*
*Institute of Cell, Animal and Population Biology, University of Edinburgh, Edinburgh EH9 3JT, Scotland and tWellcome/CRC Institute of Cancer and Developmental Biology and Department of Genetics, University of Cambridge, Cambridge CB2 la, England
Manuscript received April 23, 1993 Accepted for publication July 26, 1993
ABSTRACT
To assess the potential to generate quantitative genetic variation by insertional mutagenesis in a vertebrate, lines of mice in which many provirus vector inserts segregated at a low initial frequency on an inbred background (insert lines) were subjected to divergent artificial selection on body weight at 6 weeks and responses and heritability estimates compared to control lines lacking inserts. Heritability estimates were more than 1.5 times greater in the insert lines than in the controls, but because the phenotypic variance was substantially higher in the insert lines the genetic variance was about 3 times greater. Realized heritability estimates tended to be lower than heritabilities estimated by an animal model which utilizes information in covariances between all relatives in the data set. A surprisingly large response to selection occurred in the inbred control line. Insert lines were about 20% less fertile than controls. Division of the selection lines into inbred sublines in the later generations of the experiment revealed substantially greater variation among sublines of the insert lines than among the controls. Heritabilities were similar to typical estimates for the trait in outbred populations. In conclusion, there was clear evidence of extra variation deriving from inserts, which has yet to be attributed to individual genes.
P
ROGRESS in the understanding of the mainte- nance and nature of quantitative genetic varia- tion requires knowledge of the effects of the individ- ual trait loci. T h e effects of quantitative trait loci (QTL) are usually small, the environmental variation large, and effects of tightly linked polygenes difficult to distinguish from one another, so specific informa- tion on the genes causing quantitative genetic varia- tion is hard to obtain. Insertional mutagenesis, the random insertion of foreign DNA into the genome, is a powerful method for generating mutations. Selec- tion on a desired phenotype is often employed to isolate specific classes of mutations. Recently, T. F. C. MACKAY and co-workers have developed inser- tional mutagenesis strategies for the isolation of genes controlling quantitative traits in Drosophila. T h e first such experiments involved dysgenic crosses in which a high rate of uncontrolled transposition ofP
elements occurred. Artificial selection on quantitative traits in populations derived from such crosses led to increased responses relative to “non-dysgenic” controls(MACKAY 1984, 1985). The amount of new genetic variation generated in a dysgenic cross is of the order of 100 times greater than that produced by one gen- eration of spontaneous mutation (MACKAY 1987). Later, by using systems in which transposition can be controlled (ROBERTSON and ENCELS 1989), inbred lines containing different subsets of small numbers of stable
P
element inserts were generated and their effects on various traits measured (MACKAY, LYMANGenetics 135: 1099-1 106 (December, 1993)
and JACKSON 1992). Although most inserts had little or no effect on any trait, about 10% of inserts had detectable quantitative effects, some of several phe- notypic standard deviations. These would be classed as “major genes” if present in a segregating popula- tion. Mutations of large effect tend to be recessive, and most though not all, are highly deleterious with respect to fitness.
Many of the common laboratory mutations of Dro- sophila are caused by transposable element insertions (RUBIN 1983), but in mice it is unclear whether this is also the case, as few previously known mutations have been associated with insertions. Two exceptions are the dilute coat color mutation, caused by the insertion of an ecotropic murine leukemia virus (JENKINS et al.
198l), and the hairless mutation which is associated with the insertion of a non-ecotropic murine leukemia virus (STOYE et al. 1988).
1100 P. D. Keightley, M. J. Evans and W. G. Hill
ating large number of insertions in mice.
In this study, we investigate the effects on quanti- tative traits of the insertion of many retroviral vectors in a population of mice derived from ES cells. Lines derived from this population were artificially selected for increased and decreased body size. T h e genetic background was inbred and the inserts were initially at low frequencies in the population, so any selection response could be attributed to the selection of in- sert(s) which had disrupted a gene affecting the trait. T h e genetic variance estimated from information con- tained in the observed response to selection and from covariances between all relatives is compared to that of controls lacking inserts.
MATERIALS AND METHODS
Base population: Insert lines: The base population for lines containing provirus vector insertions (PVIs) was a cohort of animals bred at the Department of Genetics, University of Cambridge, which was derived from an em- bryonic stem cell line multiply infected with mos"neo retro- virus vectors (ROBERTSON et al. 1986). After infection, stem cells were injected into blastocysts (BRADLEY et al. 1984) in order to generate germ line chimeras. The stem cell line was from the inbred strain 129/Sv which had been made congenic for the Gpi-1' allele by backcrossing for 8 genera- tions (the Gpi-l" allele is normally present in strain 129/Sv). Animals derived from chimeras were therefore initially 99% inbred on the 129/Sv background, but were subsequently crossed for 2-3 generations to inbred 129/Sv homozygous for the Gpi-1" allele. Segregation therefore occurred at the Gpi-1 locus. The base population comprised 53 individuals from 10 different stem cell lines. The overall number of PVIs present in these individuals was about 130, and almost all were in the heterozygous state. Individuals from the same line varied with respect to their complement of PVIs.
Three pairs of divergent selection lines (insert lines R V l , R V 2 , R V 3 ) were established from mice containing different subsets of PVIs. The base population for R V l was 4 stem cell lines and contained a total of about 60 PVIs. RV2 was derived from a different subset of 4 stem cell lines from R V l and contained about 50 PVIs. Line RV3 was derived from a total of 10 different stem cell-derived lines, and contained a total of about 130 PVIs, most of which were common to R V l or RV2. Because the base populations for the different selection lines were crosses of several sublines in which PVIs were segregating, the initial frequencies of the PVIs were low, typically in the range 0.05-0.1.
Control lines: The base population for the controls was inbred strain 129/Sv congenic for the Gpi-1" allele. No PVIs were present, and no manipulation via the embryonic stem cell route had been carried out. One pair of divergent selection control lines was established. An unselected control inbred line of 6 pairs maintained by full-sib mating was also maintained and recorded. Control and insert lines were housed in cages in adjacent racks.
Selection regime: Insert and control lines were main- tained under the same selection regime for the duration of the experiment. Single pair matings had at most two litters. Lines were kept in synchrony as far as possible; high and low lines of the same base population were always so, but for management reasons the time of mating of different lines varied by up to 3 weeks.
T o maximize local inbreeding and thereby increase the
TABLE 1
Scheme of the experiment
Generation Operation
0 Lines established.
1-6 Circular mating. Within family selection in high and low lines.
Selection mostly within families.
7-9 High and low lines subdivided, full sib mating.
10-12 Full sib mating. Selection relaxed.
fixation probability of recessive mutations, in generations 1-6 matings were made between full-sibs in odd numbered generations, and followed a circular scheme (KIMURA and CROW 1963) in even numbered generations. The selection criterion during this period was within litter within sex deviation of body weight at 6 weeks, and one male and one female were selected from each family where possible. Sub- stitutes were taken from related families. Because breeding success was variable and sometimes poor during this period, the number of matings per selection line varied, but in most generations was between 20 and 30.
From generations 7 to 12, to further increase local in- breeding, the selection lines were divided into sublines of three mating pairs per subline. Within a subline, matings were between full sibs and, where possible, all three matings were from the same family. From generations 7 to 10, between family selection was practized within sublines based on family mean 6 week weight corrected for litter size, sex and parity. In large families, selection pressure was also applied within families. In order to reduce the influence of maternal effects on body size, the selection on 6-week weight was relaxed in generations 1 1 and 12, but inbreeding within sublines was continued. Up to 7 sublines were maintained per selection line. The scheme of the experiment is shown in Table 1.
Analysis of retrovirus vectors: The retrovirus vector inserts were analyzed in Southern blots with a neo probe which recognizes a single junction fragment per provirus insert (ROBERTSON et al. 1986).
T o assess the purity of the genetic background of the inbred lines Southern blots were carried out with a probe specific to a broad class of endogenous non-ecotropic murine proviruses. Such proviruses are stable and highly polymor- phic between inbred strains (FRANKEL et al. 1990), and therefore serve as a good indicator of strain purity (BLATT et al. 1983). The probe was the 622-base pair BamHI-EcoR1 fragment of murine retrovirus MCF 247 (HOLLAND, WOZ- NEY and HOPKINS 1983), which recognizes a single junction per provirus in a BamHI restriction digest of genomic DNA.
Southern blotting: Genomic DNA was extracted from tail or from spleen tissue by standard methods. A sample of 10
r g of DNA was digested to completion with BamHI and separated at 2.3 V/cm for 24 hr in a 20-cm 0.7% agarose- TBE gel containing 1 pg/ml of ethidium bromide. The DNA was transferred to a charged nylon membrane (Hy- bond-N+, Amersham Ltd., England) by capillary blotting with 0.4 M NaOH for 18 hr. About 20 ng of probe DNA in
a low melting point agarose gel fragment were labeled with "P by random oligonucleotide primer extension (FEINBERG and V~CELSTEIN 1983) to a specific activity of about 1.5 X
Retroviruses and Quantitative Traits 1101
1-5 days at -70" using an intensifying screen.
Statistical analysis of quantitative data: Realized herita- bility estimation: The realized heritability (FALCONER 1989, Ch. 1 1 ) can be obtained from the observed response to selection, but because of the structure of the experiment, a decline in the genetic variance from inbreeding needs to be accounted for. The heritability in the base population, h& was computed by iterating the following equations in order to find a value of the base population heritability which best predicts R , the observed selection response:
where &,* is the intensity of within family selection, a;, is the phenotypic variance; Vg,( is the genetic variance; V E is the total environmental variance; V, is the variance of environ- mental effects common to littermates; Ne,* is the effective population size for the whole selection line or, where appro- priate, for sublines; t is the generation number; and n is the number of individuals of the same sex recorded per family. The genetic variance at generation t refers to the variance in a selection line, or after division into sublines, the variance in a subline.
Animal model REML estimation of variance components: Genetic and environmental components of variation of 6- week weight were estimated using an animal model with
Restricted Maximum Likelihood (REML) (MEYER 1989). Information from the response to selection and from covar- iances between all relatives in the data set is thereby utilized. The genetic variation in the population is assumed to be the result of the segregation of a large number of genes of small additive effect ("the infinitesimal model"). The variance of environmental effects common to members of the same
litter, V,, and fixed effects of sex, generation number, parity and litter size (6 categories) were also estimated. In cases where data from more than one line were analyzed simul-
taneously, a line X generation effect rather than a genera- tion effect was fitted in order to account for some lines not being strictly contemporary.
RESULTS
Body
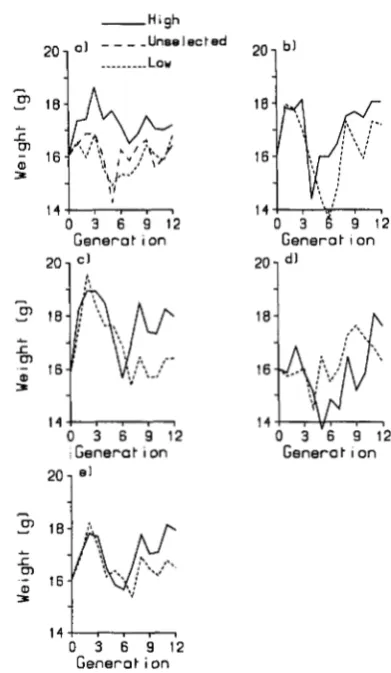
size: Phenotypic means and realized heritabili-ties: Mean 6-week weights of high and low selection lines, corrected for sex, litter size and parity, are plotted against generation number in Figure 1. T h e pattern of response to selection varied markedly along the lines. T h e control lines diverged immediately, but the response at generation
2
was barely exceeded in the last 6 generations. T h e unselected control inbred line mean was similar to the low line. Immediate selection responses did not occur in the insert lines, but RVI and RV2 showed a consistent high-low diver- gence from generation 6 onwards, and RV2 exceeded the divergence of the control in the later generations.RV3 showed little evidence of a selection response. T h e overall high-low divergence for all three insert lines increased slowly, and the control divergence was exceeded in the last
2
generations. A drop in 6-week14 1 s m 1
0 3 6 9 1 2
Generation
0 3 6 9 1 2
.Generation
201
,Ol
b12ol
Generatlon
1 4 1
0 3 6 9 1 2
Generation
FIGURE 1 .-Mean 6-week weight (g) corrected for litter size, sex and parity in high and low selection lines plotted against generation number. (a) Control, (b) R V l , (c) RV2, (d) RV3, (e) all RV.
weight, particularly noticeable in the insert lines, oc- curred at generations 3-6, and may correspond to a decline in the health status of the animals.
Because of the change in the selection regime, which occurred midway through the experiment, and the likely divergence between high and low lines be- cause of a positive maternal environmental covariance between mother and offspring (FALCONER 1965; KIRKPATRICK and LANDE 1989; KEICHTLEY and HILL 1992), inference of the realized heritability is not straightforward. Because selection was relaxed, it can be assumed that the phenotypic means of generations
1102 P. D. Keightley, M. J. Evans and W. G . Hill
TABLE 2
Estimates of cumulative divergences, cumulative selection differentials and realized heritabilities
Line High Low R (g) (SE) i . 1 - 6 i . 7 - I O n N e w V E Vg.0 h:
Control 17.3 16.7 0.68 (0.26) 1.08 0.53 2.6 14.0 2.92 0.38 0.11
R V l 18.3 17.5 0.75 (0.29) 0.98 0.48 2.5 16.4 4.09 0.49 0.11
RV2 18.4 16.7 1.67 (0.22) 1.15 0.78 2.4 21.1 4.23 1.04 0.20 RV3 18.2 16.8 1.34 (0.48) 0.89 0.59 2.5 8.7 4.65 1.19 0.20
All RV 18.3 16.9 1.34 (0.17) 0.91 0.17
Line means and accumulated divergences ( R ) of 6-week weight for generations 1 1 and 12; and realised heritabilities (hi) and base population genetic variances V,,O calculated from the between line divergence. Line means were computed by REML with generation number, sex, parity, litter size and selection line as fixed effects, and litter as a random effect. Standard errors (SE) of line means are about 0.7 times the SE of the accumulated divergence. The intensity of within family selection (L) is with respect to the high-low divergence averaged over generations ( t ) , and is given separately for t = 1-6 and t = 7-10 because of the change in the breeding regime. The between family selection pressure for t = 7- 10 was negligible and was ignored. The effective pouplation size ( N e ) within lines was computed from the pedigree for t = 1-6, and was assumed to be 2 for t = 7-10 because sublines were maintained by full-sib mating.
TABLE 3
Animal model REML estimates of components of variance of 6-
week weight
Support
Line V,@) V E @ ) d@) c2 h2 limits Control 0.59 2.93 3.52 0.30 0.17 0.10-0.25 R V l 2.66 4.09 6.76 0.29 0.39 0.28-0.51 RV2 0.86 4.23 5.08 0.31 0.17 0.09-0.28 RV3 3.69 4.64 8.34 0.27 0.44 0.32-0.54
All RV 1.89 4.34 6.24 0.29 0.30 0.24-0.37
The environmental intraclass correlation of litter mates is cz.
Values of h2 outside the support limits are more than e' = 7.4 times less likely than the ML estimate. These limits are approximately equivalent to 95% confidence limits.
genetic variance is greater by a factor of about 2.5. T h e average performance of the low insert lines was similar to the control low line, and the averages of the high insert lines were greater than the control high line (Table 2), suggesting asymmetry of response.
Animal model REML estimates of components of vari- ance of body size: T h e data from the selection lines were analyzed by animal model REML as described above. Estimates of genetic and environmental com- ponents of variance and heritability estimates along with support limits are shown in Table 3. REML heritability estimates are higher than realized herita- bilities, particularly for the insert lines. T h e heritabil- ity estimate from all three insert lines combined is significantly higher than that from the control (0.01 C P
<
0.05), and is comparable with heritability esti- mates for 6 week weight from many outbred popula- tions (FALCONER 1989). An interesting feature of the estimates of variance components is the inflated phe- notypic variance in the insert lines. Some of this increase may have been due to poor health status, particularly in the early generations. T h e differences in health problems largely disappeared by generation 10, but an increase in phenotypic variance for the insert lines is still apparent in these generations (next9 10 1 1 12 g / l O
"2
G e n e r o t ~ o n Generot ion
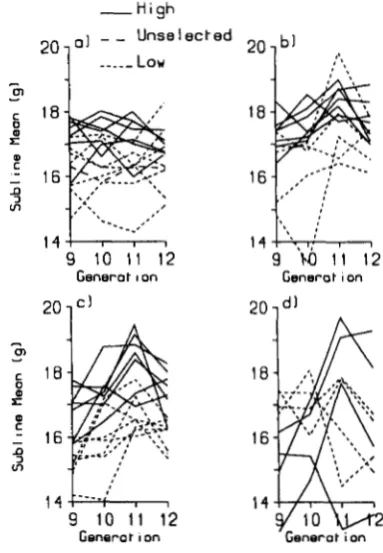
FIGURE 2.-Mean 6-week weight (9) corrected for litter size, sex and parity in inbred sublines at generations 9-12. (a) Control, (b) R V I , ( c ) R V 2 , ( d ) R V 3 .
section). T h e combined animal model REML estimate of the genetic variance for the insert lines is more than threefold higher than for the control (Table 3).
Retroviruses and Quantitative Traits 1103
TABLE 4
REML estimates of components of variation of &week weight in
relaxed selection generations (1 1 and 12) in control and insert lines
Line u%gP) VI(.) (SE) V, (g') (SE) P sp Control 3.59 1.32 (0.21) 0.36 (0.21) 0.37 0.10
RVl 3.91 1.43 (0.28) 0.43 (0.28) 0.37 0.11
RV2 4.37 0.85 (0.20) 0.74 (0.36) 0.19 0.17
RV3 7.42 1.19 (0.33) 3.23 (1.85) 0.16 0.44
AllRV 4.97 1.15 (0.15) 1.18 (0.34) 0.23 0.24
Vi is the estimate of the variance among litters within sublines, and 1' is the intraclass correlation of litter mates. V, is the estimate of variance among sublines, and sp is the intraclass correlation of subline members. Fixed effects of generation number, sex, litter size and parity were also fitted.
TABLE 5
Numbers of individuals and litters in each selection line (including the unselected inbred control), the proportion of mating which failed to produce any pups (alive or dead), and
the mean number of live pups born per litter
Proportion of infertile mat- Line Individuals Litters ings
Live born
(SE) per litter (SE)
Control 3595 664 0.06 (0.01) 5.62 (0.07)
RVl 2462 490 0.21 (0.02) 5.49 (0.08)
RV2 2814 572 0.14 (0.01) 5.57 (0.14)
RV3 1794 365 0.37 (0.02) 5.45 (0.09)
All RV 6902 1397 0.24 (0.01) 5.50 (0.06)
TERSON and THOMPSON 197 1) in which sublines and
litters were fitted as random effects (Table 4). The proportion of variance associated with subline means in the combined insert lines is more than twice that of the controls.
Fitness traits: The mean proportion of infertile
matings and the mean number of live born per litter averaged over generations in control and insert lines are shown in Table 5 . The insert lines were substan- tially less fertile than the controls
(P
<
0.001), and there is evidence of variation in the proportion of infertile matings among the insert lines. The small difference in litter size between the insert lines and the controls does not differ significantly from zeroDistribution of provirus vector inserts: The insert
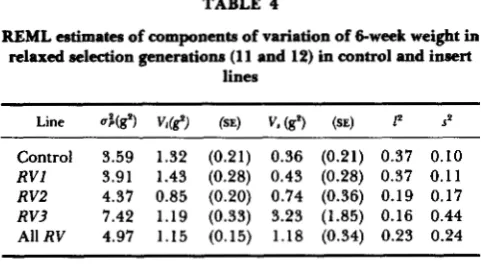
selection line RV2 showed the greatest response to selection. In later generations the average 6-week weight among sublines of its high line approached half a standard deviation heavier than the control's. Any association between a response to selection and a PVI is most likely therefore to be found in this line. T o investigate this possibility, the frequencies of PVIs in RV2 between and within sublines at generation 9 were assessed by Southern blot analysis using the PVI- specific ne0 probe (Figure 3). A summary of the results is shown in Table 6. Several PVIs show divergences
( P
>
0.2).in frequency between the high and the low line, but divergences are expected because of genetic drift. It is not straightforward to test whether any of these divergences are associated with variation in 6-week weight among the sublines because the observations are correlated, but the estimated frequencies of PVIs within sublines were fitted as covariables in a REML analysis of data for the relaxed selection generations (Table 6). Some PVIs are associated with large effects on size, but the estimates should be treated with caution because of the non-independence of the sub- lines.
Genetic background and genetic monitoring: Sin-
gle locus probes: Founder mice for the control lines and one individual from each stem cell line were typed at the Gpi-1 locus, and for hemoglobin phenotypes by electrofocusing (BULFIELD and BANTIN 1981). As ex- pected, the control founders were homozygous for the Gpi-1" allele, whereas Gpi-I" and Gpi-I" alleles segregated in the insert line founders. No variation in hemoglobin phenotype was observed, implying ho- mozygosity at the Hba and Hbb loci (data not shown). In addition, individuals were typed with a probe spe- cific to ecotropic proviruses by Southern blotting (PANTHIER, CONDAMINE and JACOB 1988). No such loci were detected, as is expected for strain 129
UEN-
KINS et a l . 1982) (data not shown).
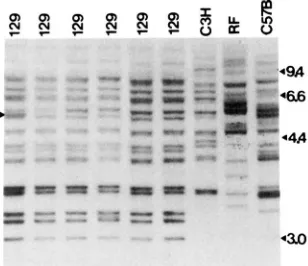
Multiple locus probe: At various times during the experiment, the genetic purity of the lines was moni- tored by Southern blotting with the non-ecotropic provirus probe as described above. Figure 4 shows an autoradiograph from such a Southern analysis of con- trol individuals from generation 6, and also shows individuals from other inbred lines maintained in the laboratory (C57BL/6J, C3H/He, RF/J). A large num- ber of genetic differences among these inbred strains can be recognized, whereas in comparison to the other inbreds the experimental mice are very homogeneous with respect to these markers. In three cases (e.g., Figure
4),
segregation at a non-ecotropic provirus loci was observed, which suggests residual genetic varia- tion, presumably associated with the backcross of the Gpi-1" allele into the 129/Sv founder strain.DISCUSSION
Artificial selection on body weight at 6 weeks was carried out in lines of mice in which a total of about
130 retroviral vector inserts segregated in an inbred background. The genetic variance of the trait was estimated from the response to selection, and from covariances of all relatives in the data set (animal model REML). Both methods give very much higher estimates of the genetic variance of 6-week weight in the insert lines than in control lines lacking insertions.
1104 P. D. Keightley, M. J. Evans and W. G . Hill
Ll L2 H4 H4 H6 L2 L5 H1 L6 H3 H6 L3 H7WI
2 9
94’
6.6,
4.4 b
I
-.I
-
FIGURE 3.-Autoradiograph showing junction
11 fragments corresponding to provirus vector inserts
4~ segregating in high and low sublines of insert line
w
-
D
- “ 4 I O
- v
-
-
17 RV2.w
-
-
41,a
=
-*.Iw 41
-
41TABLE 6
Phenotype frequencies of segregating PVIs in insert line RV2 at generation 9 (numbers homozygous or heterozygous for the PVI)
High subline phenotype frequency
Overall
Low subline phenotype frequency Over-
PVI I 2 3 4 5 6 7 freq. 1 2 3 4 5 6 7 freq.
*
(SE)all Effect (9)
13 2 1 3 2 3 4 0 0.56 1 0 2 0 2 2 0 0 . 2 9
12 0 0 0 2 0 0 1 0.10 3 1 3 1 0 0 1 0 . 4 0
1 1 1 0 3 3 0 10 2 0.61 3 1 3 1 0 0 1 0.40
1 0 2 2 3 3 2 5 0 0.67 3 2 3 3 2 0 2 0 . 7 7
9 0 0 0 0 1 0 0 0.03 0 0 0 0 0 2 0 0.14
8 0 0 0 0 0 0 0 0.00 0 1 3 3 12 0 0 . 5 0
7 0 0 3 0 0 0 0 0.14 0 1 1 0 0 0 0 0 . 0 7
6 2 2 2 2 0 1 0 2 0.69 0 2 2 1 2 0 0 0 . 2 9
5 0 2 0 0 0 0 0 0.14 0 1 0 0 0 0 0 0 . 0 4
4 2 2 0 1 3 1 0 1 0.64 3 1 0 0 0 0 0 0 . 1 8
3 2 2 0 3 3 6 2 0.77 2 1 0 3 0 0 0 0 . 2 5
2 0 0 0 0 0 0 0 0.00 0 1 3 0 0 0 0 0 . 1 8
1 0 0 0 1 0 0 0 0.03 0 0 2 0 0 0 0 0 . 0 6
1.12 (0.39)
0.01 (0.66) 0.49 (0.42) -0.65 (0.34)
-0.91 (0.42)
-
0.45 (0.38)
-0.63 (0.40) 1.13(0.31)
-
Number of individuals typed
2 2 3 3 33 12 03 23 3 2 2
Overall insert frequencies expressed as averages of insert frequencies in the 7 sublines computed from the phenotype frequencies under the assumption of Hardy-Weinberg equilibrium within sublines; estimates of effects associated with the inserts from a REML analysis with the frequency of the inserts within subline fitted as a covariate, and other fixed and random effects as in Table 4, except that a subline effect was not fitted. Frequencies of inserts were simultaneously fitted in the model. PVls which segregated at low frequencies were not fitted in the model as these provided little information for estimating the associated effect. The PVI numbers correspond to those in Figure 3; only proviruses numbered 1-13 could be scored with confidence.
8
44A
FIGURE 4.-Autoradiograph showing non-ecotropic provirus junction fragments in control individuals at generation 6 and in a number of other inbred strains. The arrowhead indicates a segre-
are similar to those typical of outbred populations. This interpretation has to be further examined, how- ever, because a selection response also occurred in the inbred control line, and the heritability estimate was about 15%, greater than expected because the control line was highly inbred. Heritability of 6-week weight in “outbred” populations is typically 40%; in a cross between the inbred strains C57BL/6J and DBA/2J, it was about 25% (G. BULFIELD personal communica- tion). There are several hypotheses that might explain the high heritability estimate and selection response in the control: (1) A gene of large effect on 6-week weight segregated in the base population, which could have been a spontaneous mutation or residual varia-
Retroviruses and Quantitative Traits 1105
allele became fixed in these lines. (b) An animal model REML analysis including a term in the additive ge- netic variance-covariance matrix for an accelerated decline in genetic variance (WRAY 1990; BENIWAL et
al. 1992) indicated that the rate of decline of genetic
variance was faster than expected from drift alone. This could have occurred as a consequence of selec- tion changing gene frequencies. Arguments against the hypothesis of a single gene of large effect in the control are: (a) T h e selection response was extremely rapid, but the mating regime was such that the quick fixation of a gene would be unlikely even if it had a substantial effect (CABALLERO, KEIGHTLEY and HILL
1991). (b) Much of the variation among inbred sub-
lines appeared to be associated with a single low line (Figure
2).
(2) A non-genetic response to selection resulting from the effect of maternal body size on size of offspring (FALCONER 1965; KIRKPATRICK and LANDE 1989). T h e inclusion of a term for a maternal environmental covariance between mother and off- spring removed little of the genetic variance in the animal model REML analysis. We have found, how- ever, evidence of such a non-genetic response in an experiment involving selection on 6-week weight in a different inbred (KEIGHTLEY and HILL 1992). In the present experiment, the divergence between high and low lines did not completely disappear after two gen- erations of relaxed selection, suggesting that there was a genetic difference between the high and low lines, but perhaps the rate of the decay of the maternal effect is on a longer time scale than this (see below). (3) A systematic upward bias in the animal model REML resulting in inflated heritability estimates be- cause environmental covariances are not fully ac- counted for. T h e transmission of disease from parents to offspring, for example, could lead to a positive covariance of the trait between parents and offspring and among members of the same family. Since such “short range” covariance terms provide much of the information for the animal model estimation, but not for estimates based on the selection response alone, the former would be more biased.An interesting aspect of the results is the greatly inflated total phenotypic variance of 6-week weight compared to the controls. For example, the animal model REML estimate of the phenotypic variance for all insert lines combined is nearly twice as high as for the controls. Thus, the heritability estimate, which
was 1.5-1.8 times higher (depending on the method
of analysis) in the insert lines implies a genetic com- ponent of variance 2.5-3.2 times higher. A hypothesis which could explain the increased phenotypic variance is the segregation of deleterious recessive genes, Some of the increased phenotypic variance may, however, have been due to disease which affected the general health and reproductive performance of the colony,
although it is unclear why the controls should have been less susceptible to such effects. It is also possible that the insert lines are subject to some unknown effect of passing through ES cell culture (the control lines were not treated in this way). T h e insert lines had substantially reduced fertility compared to the controls. T h e effect of P element insertion in Dro-
sophila is also a substantial reduction in fitness [about
12% reduction in viability per homozygous insertion (MACKAY, LYMAN and JACKSON 1992)]. T h e insert
lines were known to contain a number of recessive lethal mutations resulting from insertion, for example bulgy eye (Be), which is lethal when homozygous (M. B. CARLTON and M. J. EVANS, unpublished), and nodal, a recessive lethal (CONLON, BARTH and ROB-
ERTSON 1991 ; ZHOU et al. 1993). Moreover, inbreed- ing experiments suggested that approximately 2% of insertions could not be bred to homozygosity, presum- ably on account of prenatal embryonic lethality (M. J. EVANS, unpublished observations).
T h e results from division of the selection lines into sublines in the later generations of the experiment tend to confirm the results from earlier generations. T h e phenotypic variance appeared to remain inflated in the insert lines, and there was substantially more variance in 6-week weight associated with subline means in insert lines. T h e maintenance of a large number of sublines is probably a better strategy than artificial selection for detection of insertional mutants because of the benefit of more rapid inbreeding of mutations, most of which are likely to be recessive. T h e amount of replication of the effect of any one mutation is potentially less, however. In mice, artificial selection is inefficient for selecting insertional mutants in inbreds because their poor reproductive perform- ance allows only weak selection on the quantitative trait.
T h e analysis of the frequencies of the inserts among sublines of one of the insert lines ( R V 2 ) shows diver- gences in the frequencies of a number of them, and statistical analysis suggests that some may be associated with the observed response to selection. Such inserts are candidates for further genetic analysis based on continued breeding of the most extreme insert sub- lines, firstly to determine if the extreme phenotype has a genetic basis, then to associate the extreme phenotype with PVIs by segregating them in an FS population.
This work was funded by the Agricultural and Food Research Council. P.D.K. wishes to acknowledge support from the Royal Society. We are grateful to LINDA MAY for technical assistance.
LITERATURE CITED
1106 P. D. Keightley, M. J. Evans and W. G . Hill
BLATT, C., K. MILEHAM, M. HAAS, M. N. NSBITT, M. E. HARPER and M. I. SIMON, 1983 Chromosomal mapping of the mink cell focus-inducing and xenotropic enu gene family in the mouse. Proc. Natl. Acad. Sci. USA 8 0 6298-6302.
BRADLEY, A., M. J. EVANS, M. H. KAUFMAN and E. ROBERTSON,
1984 Formation of germ-line chimaeras from embryo-de- rived teratocarcinoma cell lines. Nature 3 0 9 255-256.
BULFIELD, G., and G. BANTIN, 198 1 Genetic monitoring of inbred strains of mice using electrophoresis and electrofocusing. Lab. Anim. 1 5 147-149.
BULMER, M. G., 1971 The effect of selection on genetic variabil- ity. Am. Nat. 105: 201-211.
CABALLERO, A., P. D. KEICHTLEY and W. G. HILL, 1991
Strategies for increasing fixation probabilities of recessive mu- tations. Genet. Res. 5 8 129-138.
CHURCH, G. M., and W. GILBERT, 1984 Genomic sequencing. Proc. Natl. Acad. Sci. USA 81: 1991-1995.
CONLON, F. L. M., K. S. BARTH and E. J. ROBERTSON, 199 1 A novel retrovirally induced embryonic lethal mutation in the mouse: assessment of the developmental fate of embryonic stem cells homozygous for the 413.d proviral insertion. Devel- opment 111: 969-981.
FALCONER, D. S., 1965 Maternal effects and selection response. In Genetics Today, Proceedings of the XI International Congress on Genetics, Vol. 3, edited by S. J. GEERTS. Pergamon, Oxford. FALCONER, D. S., 1989 Introduction to Quantitative Genetics, Ed. 3.
Longman, London.
FEINBERC, A. P., and B. VOGELSTEIN, 1983 A technique for radiolabeling DNA restriction endonuclease fragments to high specific activity. Anal. Biochem. 132: 6.
FRANKEL, W. N., J. P. STOYE, B. A. TAYLOR and J. M. COFFIN,
1990 A linkage map of endogenous murine leukemia provi- ruses. Genetics 1 2 4 221-236.
HOLLAND, C. A., J. WOZNEY and N. HOPKINS, 1983 Nucleotide sequence of the gp70 gene of murine retrovirus MCF 247. J.
Virol. 47: 413-420.
JAENISCH, R., 1988 Transgenic animals. Science 2 4 0 1468-1474.
JENKINS, N. A., and N. G. COPELAND, 1985 High frequency germline acquisition of ecotropic MuLV proviruses in SWR/J- RF/J hybrid mice. Cell 43: 8 1 1-8 19.
JENKINS, N. A., N. G. COPELAND, B. A. TAYLOR and B. K. LEE,
1981 Dilute ( d ) coat colour mutation of DBA/2J mice is associated with the site of integration of an ecotropic MuLV genome. Nature 293: 370-374.
JENKINS, N. A., N. G . COPELAND, B. A. TAYLOR and 3. K. LEE,
1982 Organization, distribution and stability of endogenous ecotropic murine leukemia virus DNA sequences of chromo- somes of Mus musculus. J. Virol. 43: 26-36.
KEIGHTLEY, P. D., and W. G. HILL, 1992 Quantitative genetic variation in body size of mice from new mutations. Genetics
KIMURA, M., and J. F. CROW, 1963 On the maximum avoidence of inbreeding. Genet. Res. 4: 399-41 5.
KIRKPATRICK, M., and R. LANDE, 1989 The evolution of maternal characters. Evolution 43: 485-503.
MACKAY, T . F. C., 1984 Jumping genes meet abdominal bristles: hybrid dysgenesis-induced quantitative variation in Drosophila melanogaster. Genet. Res. 44: 231-237.
MACKAY, T. F. C., 1985 Transposable element-induced response to artificial selection in Drosophila melanogaster. Genetics 11 1:
MACKAY, T. F. C., 1987 Transposable element-induced polygenic mutations in Drosophila melanogaster. Genet. Res. 4 9 225-233.
MACKAY, T . F. C., R. LYMAN and M. S. JACKSON, 1992 Effects of P elements on quantitative traits in Drosophila melanogaster. Genetics 1 3 0 3 15-332.
MEYER, K., 1989 Restricted maximum likelihood to estimate var- iance components for animal models with several random ef- fects using a derivative-free approach. Genet. Sel. Evol. 21:
PANTHIER, J.-J., H. CONDAMINE and F. JACOB, 1988 Inoculation of newborn SWR/J females with an ecotropic murine leukemia virus can produce transgenic mice. Proc. Natl. Acad. Sci. USA
PAXTERSON, H. D., and R. THOMPSON, 1971 Recovery of inter- block information when block sizes are unequal. Biometrika 58: 545-554.
ROBERTSON, E., A. BRADLEY, M. KUEHN and M. EVANS, 1986
Germline transmission of genes introduced into cultured plu- ripotential cells by retroviral vectors. Nature 323: 445-448.
ROBERTSON, H. M., and W. R. ENGELS, 1989 Modified P elements that mimic the P cytotype in Drosophila melanogaster. Genetics
RUBIN, G. M., 1983 Dispersed repetitive DNA’s in Drosophila, pp. 329-36 1 in Mobile Genetic Elements, edited by J. A. SHAPIRO. Academic Press, New York.
STOYE, J. P., S. FENNER, G. E. GREENOAK, C. MORAN and J. M. COFFIN, 1988 The role of endogenous proviruses as inser- tional mutagens: the hairless mutation of mice. Cell 5 4 383- 391.
WRAY, N. R., 1990 Accounting for mutation effects in the addi- tive genetic variance-covariance matrix and its inverse. Bio- metrics 46: 177-186.
ZHOU, X., H. SASAKI, L. LOWE, B. L. M. HOGAN and M. R. KUEHN,
1993 Nodal is a novel TGF-&like gene expressed in the mouse node during gastrulation. Nature 361: 543-547.
131: 693-700.
351-374.
3 1 7-340.
85: 1156-1 160.
123: 815-824.