© All right reserved, Wu & Zha v100 1
Public Health Intervention Framework for Reviving Economy amid
the COVID-19 Pandemic (2): Use of Personalized Mitigation
Measures Beyond the Epidemiological Model Limits
Jianqing Wu1, Ph.D., J.D. and Ping Zha2, M.D. (Chi. Med.)Correspondence: [email protected]
1. End the Incurable Era (Independent researcher for cause), P. O. Box 689, Beltsville, MD 20704. www.igoosa.com.
2. Independent Researcher (Not affiliated with any entity), can be reached by using the above address.
Keywords: coronavirus, COVID-19, public health intervention, revive economy, disease severity, epidemiological model and R0.
ABSTRACT
We previously proposed a public intervention framework concept that would allow people to resume personal and economic activities. We showed that intervention measures are used in a quantitative scale to reduce transmission probabilities and disease severity. In this article, we systematically examine the origin, assumptions, performance and limitations of epidemiological models from different views used in past review. We found that nearly all model assumptions fail to hold or are remote from reality; R0 does not exit or has no utility in guiding treatment options; personalized intervention measures are vitally important to COVID-19 due to its transmission characteristic; and current epidemiological models are unable to accurately assess the true benefits of personalized intervention measures. We suggest that poor performance of the models are attributed to flawed assumption that health/disease properties can be treated as transferable properties. The flaw creates a fiction that disease properties such as infection probabilities and death risks can be transferred from any vulnerable persons to anyone in the population and thus severely limit societal ability to fight the pandemic. We finally show that the benefits of
INTRODUCTION
In the first article [1], we proposed a public intervention framework concept. In that framework, intervention measures may include host, viral and environmental factors. Infection properties are treated as continuous quantitative properties, and intervention measures are also used in a quantitative manner to achieve better performance. On such a quantitative scale, all biological properties including viral actions, immune responses, disease severity, etc. can be evaluated. In this article, we will show why intervention measures formulated by using
population approach are insufficient and why all assumptions in epidemiological models fail. We examine all known and implied assumptions, omitted model parameters and limitations in classical epidemiological models to find where the true benefits of personalized preventive and mitigation measures are. In order to assess personalized measures, we consider a transmission network and use it to appraise the benefits of the measures on personal outcomes and population outcome and then explore the best strategy for reviving economy.
ANALYSIS OF LIMITATIONS IN EPIDEMIOLOGICAL MODELS AND POPULATION-BASED APPROACH
To determine the performance of the public health intervention framework, we need to use a suitable model.
A. Origins and Historical Limitations of the Epidemiological Model
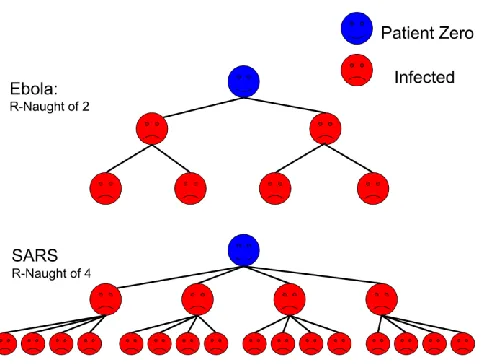
Figure 1. Hypothetical models, R0=2 for Ebola and R0=4 for Sars (From Wikipedia.) Although R0 concerns biological property, this value is estimated with complex
mathematical models developed using various sets of assumptions. Approximate R0 values are often calculated from 3 primary parameters: the duration of contagiousness after a person becomes infected, the likelihood of infection per contact between a susceptible person and an infectious person or vector, and the contact rate and other additional parameters for more complex cycles of transmission [3]. Due to difficulties in counting the number of cases, R0 is nearly always estimated retrospectively from antibody-testing data or by using mathematical models [8]. Even though different infection statuses can be assigned in a model, infection can vary greatly in severity. The disparities in disease severity are especially large for COVID-19 [9, 10].
B. Failed Assumptions in Epidemiological Model for COVID-19
The epidemiological models are very poor [8, 11]. We examine stated and implied assumptions below.
1. Assumption that R0 exists
R0 is an estimate of contagiousness that is a function of human behavior and biological characteristics of pathogens. The key assumption is that all persons are identical. This
assumption can be found from the model development history. R0 was introduced into the
epidemiology literature in the 1950s [2, 3, 4, 5], differences between individual persons were not understood. The assumption that all human beings are identical has been refuted by
overwhelming evidence. The first human genome sequences were published in February 2001 by the Human Genome Project [12], and the role of heritable phenotype changes became research subjects even further later [13, 14]; emotion and stress are found to affect disease outcomes through immune system [15-24]. The role of emotion and chronic stress in cancer was discovered after 1980s [25-29]. The effects of acute and chronic psychological stress in heart attack risk were found later [30, 31]. Stress made humans susceptible to infection, and short-term stress
negatively affects wound healing [32, 33], increases the pro-inflammatory response in caretakers
affects infectious diseases [43-54]. The body of evidence shows that human beings cannot be treated as identical. Personalized medicine concept was proposed in medicine in 2012 [55-56].
The reproduction model was developed several decades before the three-dimensional differences in human beings were understood. All of those factors imply there is no R0 in reality. Determined R0 values depend on human host conditions, infectious agents, epidemiological data and mathematical models. The limited utility is shown in a large number of studies dated after
1950’s. More than 20 different R0 values (range 5.4–18) were reported for measles for various areas and periods [57], and a review in 2017 identified feasible measles R0 values of 3.7–203.3 [58]. The wide ranges highlight the effects of local social-behavioral and environmental factors. The effective reproduction number can also be specified at a particular time t which can be used to trace changes in Rt [59, 60]. The R0 is so erratic and highly variable that the model cannot be used to optimize personalized measures for personal benefits.
2. All susceptible persons are equally likely to become infected
Great difference in personal health and susceptibility to COVID-19 infection are hidden in erratic and widely variable R0 values. This means that society generally cannot, with limited exceptions, rely on this model to seek personalized measures for personal protection. The mass-action assumption that all individuals are equally likely to become infected used in
compartmental models also fail [8]. In Maryland, almost 48% deaths are of the vulnerable persons in nursing homes [61, 62].
3. New cases do not depend on time, or models lack real speed element
New cases do not depend on time or time is not considered although the word rate has a speed-like element [63]. The model recognizes the rate element only partially and indirectly. If the disease course and transmission time window are fixed, a large R0 would tell rapid growth of new cases. This implies faster growing speed. However, the model does not address speed of the disease course for an infected person, and how faster the disease is transmitted to others. Even in a complex compartmental model, time is used only as a parameter for the population, but not for the disease course of a person [78]. Due to lack of real speed component, the model lacks utility to seek health intervention measures that are directed to altering the kinetic of disease course. Humans resist the virus largely by two immune responses: the innate immune response to initial viral attacks [64] and the adoptive immune response [65-69]. R0 may be indirectly related to the speed competition between early viral activities and innate immune responses.
4. Most models generally do not consider disease severity
large number of factors influencing disease severity cannot be used as model parameters. Even if disease severity is defined by some components, the model is unable to take as model parameters factors that influence disease severity.
5. Oversimplified transmission contacts
In epidemiological models, contacts are not-defined or insufficiently defined [71]. The probability of transmission per contact cannot be determined accurately because contacts can vary by types, duration, intense levels, etc. Since contacts cannot be defined, there is no way to determine what contacts affect personal outcome and population outcome.
6. Ignoring differences in transmission routes
Transmissions by skin contacts, blood, inhalation and other transmission routes are expected to have completely different disease consequences [72]. This is not considered in the models. In a realistic model, different parameters consistent with different transmission routes should be associated with specific persons. This would result in different R0 values. Exposure routes and viral amounts may affect disease initiations, development and death risk.
7. An implied assumption that health/disease properties are transferable
Due to influences of population approach, the epidemiological model is based on an implied assumption that all health properties can be summed and averaged [8, 71]. This assumption implies that disease from person A is same as disease of person B and curing X% a population is treated as same regardless of who are actually cured. R0 is actually a
mathematically determined value. Examining mathematical operations, we see that transmission contacts on some persons can be offset by avoiding contacts on others; one infection on a person can be offset by avoiding infection on another person; and vulnerability to infection attributable to obesity is same as that attributable to a toxic heavy metal.
The transfer of infection from one person to another cause different consequences to involved persons. Since the model allows for swapping disease statuses and outcomes between different persons, such a model must lack sensitivity for assessing validity of the personalized measures for specific persons. Thus, data mathematically derived from a population cannot be used for personalized use [73]. This problem should be seen from the car repairing model: most
mechanical properties such as coolant flow, engine power, engine speed, load capacity…. can be
added up for cars across different makes and models, but cannot be applied to any particular car in car repairs. The obvious reason is that multiple systems including the cooling system, the exhaustion system, the combustion system, etc. must work precisely in balance. The coolant flow cannot be altered according to the population-derived average. This requirement is very similar to a human body where organ functions must be in precise balance.
with low vitamin levels but may intoxicate those with high vitamin levels. The health property value derived mathematically from a population cannot be used as the basis for correcting subtle imbalance. This flaw has not been recognized before [8, 71, 74].
Mathematical operations of health/disease properties is not improper if they are used to eliminate measurement errors, provide ballpark estimates, predict disease courses, or provide policies supports. They may be used to predict how strong public intervention measures affect disease course [74-77]. The failure of this assumption is distinctively associated with treatment of diseases that arise from subtle imbalance. This requirement is another version of long-held notion that diseases must be treated by using matched treatments but not randomized
treatments. Any properties derived from population data cannot be used to optimize
personalized measures for correcting subtle imbalances. For this reason, there is no need to consider proposed alternative R0s [8]. We believe that no model can ever contain enough model details that are comparable to what is necessary for treating all persons by matched treatments.
C. Limitations of the Population-Based Approach
Epidemiological research methodology reflects the formation of population research
model. R0 reflects the assumption that all persons are identical. Around 1950’s, three -dimensional differences between different persons were unknown.
The R0 was actually pooled from a large number of different Ri values. Even for an infected person and all exposed persons, the actual Ri value would depend on an overwhelming number of environmental and social-cultural factors [8, 71, 74]. Although R0 is sensitive in evaluating strong intervention measures, the model cannot be used to optimize intervention measures that must be tailored to specific persons. The model actually dismisses from model parameters all health properties such as age, heart disease, lung disease, obesity, immune problems, diabetes, emotional condition, other risk factors, etc [7, 8, 78]. The model does not pay attention to differences in transmission routes such as skin contacts, blood, vector, and inhalation [78]. By such oversimplification, the model essentially turns each person into a widget with an
assumption that disease happens like an intrinsic event that can be measured by same
probability. The models naturally preclude the need to use personalized intervention measures and severely limit societal ability to mitigate the pandemic.
Many limitations can be seen in a compartmental model [78], which uses about 20
parameters with 8 initial parameters. The model’s structure is a matter of chooses, and most
model input values are estimates. The model does not take parameters on health properties. We expect to see different R values for different infected persons and a progressively reduced Ri with time, but the model attempts to produce a value by complex mathematical operations.
[73]. Thus, the real benefits of personalized measures cannot be recognized by the population-based method.
Due to the inherent limitations of the population approach, the epidemiological models are useful for studying strong intervention effects such as locking down city, personal isolation or quarantine [8, 71, 78], and mask-wearing (out in closed public places such as groceries stores, trains, planes, ships, offices, etc), vaccination [74, 75, 76], and antiviral drugs.
Intervention measures that can be tuned by current epidemiological models may not be able to stop transmission in many situations as shown below.
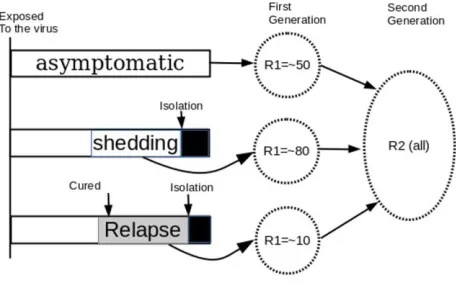
Figure 2. the COVID-19 virus can transmit from person to person in advance of detecting, tracing and personal isolation. The COVID-19 disease can transmit by asymptomatic persons or infected persons before symptoms appear, and thus detecting infected persona and personal isolation cannot be used as exclusive means to stop transmissions. Diagnostic methods may have 30% errors [79]; CDC estimated 25% of infected persons may have no symptoms but the field test results show as much as 50% error rates [80, 81], and incubation times differ from one day to potentially more than 14 days [82]. Like other influenza, acquired immunity may be of limited protection [70]; re-infection may be prevented in a short term in an animal study [83] and this finding cannot explain a relapsed disease which was confirmed [84].
If test results are wrong by 30%, isolation and removal will not achieve intended benefits. Since one in every three tested persons was not diagnosed; and each of the false negative persons has varying times to transmit the virus to other persons before the person develops enough
symptoms for removal. Depending on each person’s activities and people around him, he may
transmit the virus to one, several, tens and even potentially hundreds of uninfected persons in the first generation. Before the first generation of infected persons develop symptoms and identified, some of them have already transmitted the virus to a second generation of persons. Due to
inaccuracies in incubation times, test timings, contacts, etc., it is impossible to break the chain of transmissions by tracing and isolating infected persons.
The estimated values of R0 generated by mathematical models are dependent on numerous decisions made by the modeler and many model parameters [8, 74, 78, 85, 86, 87]. Furthermore, many of the parameters included in the models used to estimate R0 are merely guesses [8, 78, 88, 89]. This problem becomes more obvious for complex models that use more model parameters [74, 89]. Thus different models with different assumptions produce different R0 values even when they are computed by using same epidemiological data [8, 74, 86, 90, 91]. For those reasons, mathematical models have limited utility for predicting future cases in a long time period. Even a fairly complex model constructed for COVID-19 does not include model parameters for personalized measures [78]. This model divides the population as susceptible, exposed, infectious but not yet symptomatic, infectious with symptoms, hospitalized and
recovered groups as compartments, and further classify population into quarantined susceptible, isolated exposed, and isolated infected compartments. Despite the complexity, the model assumes that all people are same and do not take personalized measures as model parameters. They are sensitive to strong measures such as locking down cities, personal isolation, and population vaccination [74, 75, 76].
E. Discover True Benefits of Personalized Measures
Due to R0 concept failure, population methodological flaw, and mathematical errors, personalized protective and mitigation benefits cannot be assessed. Therefore, we must explore personalized measures outside the epidemiological model limits.
Figure 3 shows a transmission network from patient zero, to the first generation of infected persons and a second generation of infected persons. The size of circles represents vulnerability and disease severity of infected persons.
We could look at how infection grows by examining transmission chains. In a new breakout, if an initial infection is not stopped, the infection causes R1 new infections. For each newly infected person, the virus then infects R2 persons; this would result in R1*R2 cases in the second generation and R1*R2*R3 cases in the third generation. However, due to variations, the persons in R1 are different; and R2 has different values depending on the infected persons. Thus, we use Ri to denote R2.1, R2.2, R2.3, R2.4, R2.5, R2.6. When Ri is used for a specific infected person, its value would depend on all exposed persons. The overall performance of the intervention measure is mainly reflected in the final number of infected persons, number of deaths, and number of disabled persons.
A person might be exposed to multiple contact chances, and may escape one, two, and even several, but will not escape from all potential contact chances. This person will most probably be infected sometime later. After susceptible people are reduced, the number of new cases will be limited by available susceptible persons. With time passing, the effective
reproduction number would go down because people do everything to reduce contact and reduce transmission probability. Thus, Ri is highly variable.
The strategy is to reduce every Ri value in the transmission network and reduce death risk and disability risk for every infected person. The benefits of personalized measures can be
evaluated without using the solution of the model. The chain from the patient zero, R1 and R2 is a series of transmissions. There might be other series of transmission chains. This figure provides a hint that preventing the infection zero could stop a series of infections and preventing the
infection at R2,3 could have the effect of stopping 20 infections, but do not stop the some of the persons from being infected by a different series of infections. Some persons might be infected by multiple chains if no preventive measures are used, but other similar measures may hinder or block multiple infection chains in the network.
Personalized measures have both personal benefits and population benefits. A large number of personalized measures can be taken by all people to reduce contact number, the transmission probability for each contact, and disease severity of each infection. Those measures reduce Ri for each infection node. Since the population performance of the mitigation measures is a refection of all individual cases, reductions in all Ri values for all persons must lead to a
reduction in R0. Even if the measures do not reduce the total infection number and case growth rate for the population, they can still reduce death rate and disability rate. If the six deaths are avoided in Figure 3, the intervention measures are successful, regardless of total infection cases. 2. Explore personalized preventive and mitigation benefits beyond the model limits
population outcome can be achieved only by tuning personalized measures for individual persons. All personal outcomes contribute to the outcome of the population. If a person has better health, the person will not become infected, is infected at a lower probability, or gets the disease in a lower severity. The person contributes to the population by reducing each Ri in the transmission network. If every person in the population does the same, their efforts will result in smaller Ri values in the transmission network. The outcome of the population is much better as compared a hypothetical reference without using the personalized measures.
3. Get more benefits of personalized measures by doing-more
In the classical epidemiological model, many model parameters and most case data are accepted in a two-value scale. In reality, all viral properties, health properties and intervention measures have bell-shaped probability density profiles. When any such a property is converted into a two-value scale, a small tail always falls outside the two-value flipping point. Failure is the nature rather than an exception.
The only strategy for defeating this common error is creating higher safety margins: (1) a larger distance may be used for social distancing between an immune-suppressed person and an infected person because the immune-suppressed person has diminished antiviral ability; (2) high-quality masks are worn by people who are exposed to the virus for extended time each day; (3) for people with extensive personal interactions, face-shield may be used to reduce the amount of the virus that could reach the face and respiratory track; (4) comprehensive measures may be taken to reduce risk of outbreak in nursing homes because old people in nursing homes are more vulnerable to the virus; (5) for facilities that are of strategical importance, intervention measures cannot rely on viral test statuses and tracing contact histories. More rigid intervention measures should be taken to prevent viral transmission.
Stronger measures, better protective equipment, and multiple protective devices or measures are used to offset errors attributable to test method sensitivity, incubation time,
asymptomatic infections, etc. Stopping a seed or early infection is particularly important because it has the effect of stopping all infections in many generations. However it dose not stop some of the persons from infected by different series of infections. Even stopping an early infection is not a sure shot because people contact each other in many ways in various times. Therefore, only doing-more strategy will translate into a better population outcome.
4. Improve personal health as the fundamental measure
It is hard for a person to avoid every contact in his life. Avoiding once, twice and even ten times by luck is not the same as avoiding all. A most reliable mitigation measure is improving personal health as a fundamental solution.
responses and viral loads [64, 65]. An initial infection may be controlled by innate responses. Thus, people can improve their ability to resist viral infection and reduce disease severity.
To reduce effective Ri values, the best approach is using multiple measures to reduce viral amounts in exposures and improve personal resistance to the virus. For each node in the
network, the health condition of the infected person and all exposed persons must affect the Ri value. The health conditions of all people determine the finally realized Ri values. If all people improve their ability to resist the virus, the number of infected persons will be reduced. When the measures are sufficiently effective, Ri will be reduced to 1 or less for very infected person and the pandemic will end.
5. Achieve personalized mitigation benefits by reducing disease severity
For COVID-19, disease severity is one thing that can be identified and reduced.
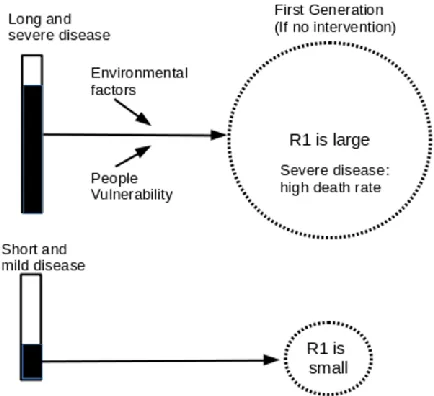
Figure 4. Disease severity affects both R0 value and death rate. Current models do not have suitable model parameters for disease severity. If measures are directed to reducing disease severity, different measures are applied to different persons.
Since disease severity can be reliably predicted by looking at their personal medical
histories, the measures can be tailored to such persons. If death rate is reduced to sufficiently low, the pandemic would become a mild flu.
F. Recognize Personalized Protective and Mitigation Benefits from Existing Epidemiological Models
The traditional models cannot reliably and accurately show benefits of personalized measures. Their true benefits may be reflected in population death rate and disability rate, but no body can tell. We will show where the benefits are hidden.
1. The benefits of personalized measures can be revealed by making plus and minus changes to model parameters
Due to large errors and inaccuracies in model structure, parameters, and model decisions, epidemiological models generally cannot be directly used to assess the benefits of personalized measures. This does not means the models cannot be used to assess relative benefits of
personalized measures. It is possible to determine disease outcome by reducing transmission rate by a certain percent, as it was done in a study, where epidemiological models show 10% reduction in transmission rate can reduce hundreds of thousands of deaths [92]. Such a method may also be used to predict money saved [93]. When a model is used to determine incremental benefits, most errors affecting the baseline is expected to drop out. However, one difficulty is that most personalized measures cannot be directly used as model inputs. Additional work must be done to establish how other measures quantitatively reduce reducing transmission probabilities. Moreover, the measures must be tailored to persons on basis of their health conditions such as obesity, inactivity, immune-compromise, chronic diseases, etc. Few studies have been attempted to evaluate personalized benefits.
2. Benefits of personalized measures are hidden in a reduced R0 value, which cannot be determined accurately
The benefits of personalized measures may be reflected in the R0 value. Even though the measures cannot be accepted as model inputs, they affect model outcome through epidemiologic data. If a significant number of people in the population have improved their resistance to the virus and improved their survival probability from infections, there will be fewer infection cases and fewer deaths. The R0 would become smaller. Personalized measures affect R0 through the following factors: (1) Epidemiologic triad (agent, host, and environmental factors) [94] affect R0. This implies that those factors influence R0. This means that pre-exposure physiological changes, post exposure remedial measures, and multiple factors treatments are important; (2) The value of R0 is a function of human social behavior and organization, as well as the innate biological characteristics of particular pathogens [71]; (3) Policy environment, various aspects of
environment, and other factors that influence transmission dynamics and, thus, are relevant for the estimation of R0 values [94]; and (4) Any factor having the potential to influence contact rate, including population density, social organization, seasonality, frequencies of human–human or human–vector interactions in a time or space [8, 71, 74].
influencing factors so that the modeler can attribute the lower R0 to the measures. In reality, there is no way to predict how the measures actually reduce R0 because there is no way to make the comparison. The benefits are reflected on R0, but there is no way to tell how much of the R0 value have been reduced by personalized measures. That is why no credit would be given to personalized measures.
3. Benefits of personalized measures may be falsely rejected as errors
One biggest problem is that models are unable to take different values for different persons. When a mitigation measure is weak, compared with other influencing factors, it may exhibit as having no effect; and when one single mitigation measure is used among many influencing factors, the true benefits of the measure cannot be determined [73]. If only 5 of one hundred persons use the mitigation measure, even though the five have benefited from it, the benefit is not revealed in the population outcome. To show this problem in an example, if
additional distance is used by all people, the extra distance has no benefit on healthy and young persons. Prior-exposure measure, heightened protection, and post-exposure remedies may show little benefits on those who are healthy and their benefits. True benefits can be found only on vulnerable persons. This is why population trials will eliminate all weak factors by mistake. The worst problem is that when a personalized protective and mitigation measure has both positive benefit and negative benefit, the positive benefit will be nullified by the negative benefit due to mathematical averaging. Wearing masks by an infected person is predicted to increase viral redistribution or re-infection within the lungs, but wearing masks by uninfected person in an in-house public area can provide the best protection [96]. The negative benefits of mask-wearing by infected persons are hidden in the population data.
G. Discussion
Public health intervention measures cannot break the chain of infection reliably. The root causes of failure include a large number of asymptomatic persons, poor viral detection
sensitivities, varying incubation times, etc. R0 can be very large (R0=6.5). If asymptomatic person restarts an outbreak, the person can infect many persons before his infection status is found. Due to long incubation times, and the invisible transmission manner, the attempt of stopping chain of infection by conducting tests and removal is deemed to fail. Because of psychological impacts of death threats, small outbreaks cause population panic and thus disrupt economy.
Our analysis supports the conclusion by Li et al. “... in almost every aspect that matters, R0
is flawed” after they compared performance for a number of mathematical models [8]. The only
reason for continuing using it is “is all that we have” [8]. The authors noted as reason of R0
failure, “the mismatch between individual-based parameter and a population-level compartment
model.” Our finding is that all flaws are on the population approach and the models ignore reality that people vary greatly in their abilities to resist the virus. The model has bound our hands to fight a pandemic that is actually close to influenza for the majority of people.
R0 is especially poor for COVID-19 because the model focuses on disease transmissions, which are the less important part of the disease. Thus, intervention measures tuned by the model are not necessarily the best for mitigating death rate and disability rate. Also, R0 from most models is not a measure of the disease severity or the rapidity of a pathogen’s spread through a
Epidemiological models cannot differentiate differences between different persons. Any R0 value could support a large number of combinations of different persons with different outcomes. Naturally, personalized measures are nearly always falsely rejected as having no benefits. Their true benefits may be falsely rejected as a result of averaging positive and negative benefits. With limited exceptions, R0 should not be used to evaluate personalized measures.
Some epidemiological models may be used to study relative benefits by determining the reduction in one or more model parameters. The models may reveal some benefits of
personalized measures through model parameters such as transmission rates. Personalized measures can also be hidden in R0 though modeled epidemiological data, but cannot be correctly attributed to the measures.
All epidemiological models use an assumption that all health properties are transferable between individual persons. This presumption holds in applications unrelated to medicine, but always fails if the model are used as guidance for formulating treatment methods for individual persons. The failure is anticipated whenever model outputs are used on multiple component systems where all components must be maintained in precise balance. This flawed assumption is directly responsible for transferring death risks from a small number of distinctive vulnerable people to the whole population and cause the society to ignore the most important disease feature that disease severity varies from no-sign to death. This fact implies there is a great room for intervention. When the death rate is sufficiently low, occasional outbreaks will not disrupt economy.
It has been suggested that wearing masks when out in public, in combination with
complementary public health measures could stop community spread [95]. Due to a high R0 and invisible transmissions, an active person expects to be in multiple infection chances. It would be hard to escape from all infection chances. The best strategy for surviving from the pandemic is using personalized protective measures and personalized mitigation measures to increase personal resistance to the viral and reduce disease severity of infected persons. We have found that multiple treatments can be used to break the limits of flawed population trials [73]. However, a model could easily have more than 100 parameters [74], and none of them are directed to details for treating diseases.
LIMITATION OF THIS STUDY
The validity of this study is limited to COVID-19. The utilities of R0 and mathematical models depends on pathogens.
FUNDING STATEMENT
The author(s) declared that no grant was used in support of this research project.
CONFLICT OF INTERESTS
None
ADDITIONAL INFORMATION
Additional information is provided in a supplemental document and some information will be stored in igoosa.com online database. This article may be used by any person for personal use as fair use; any use for research and development and public welfare is permitted by default.
REFERENCES:
1. Wu, JQ, and Zha P. Public Health Intervention Framework for Reviving Economy Amid the COVID-19 Pandemic (1): A Concept. https://osf.io/hjgw8
2. Heesterbeek JAP. A brief history of R0 and a recipe for its calculation. Acta Biotheor. 2002;50:189–204.
3. MacDonald G. The analysis of equilibrium in malaria. Trop Dis Bull. 1952;49:813–29. 4. MacDonald G. The epidemiology and control of malaria. London: Oxford University Press; 1957.
7. Diekmann O, Heesterbeek JAP, Metz JAJ. On the definition and the computation of the basic reproduction ratio R0 in models for infectious diseases in heterogeneous populations. J Math Biol. 1990;28:365–82.
8. Li J, Blakeley D, Smith RJ. The failure of R0. Comput Math Methods Med. 2011;2011:527610.
9. CDC, Severe Outcomes Among Patients with Coronavirus Disease 2019 (COVID-19) —
United States, February 12–March 16, 2020. The report was posted online on March 18, 2020 as an MMWR Early Release. Weekly/March 26, 2020/69(12);343-346.
10. Verity R, Okell LC, Dorigatti I et al. Estimates of the severity of coronavirus disease 2019: a model-based analysis. Lancet Infect Dis 2020. Published Online March 30, 2020. https://doi.org/10.1016/Published online March 30, 2020 https://doi.org/10.1016/S1473-3099(20)30243-7.
11. Devine M. Another blow dealt to public faith in scientific models: Devine. Accessed at https://nypost.com/2020/04/25/coronavirus-models-deal-another-blow-to-faith-of-americans-devine/
12. Pennisi E (February 2001). The human genome. Science. 291 (5507): 1177–80. 13. Misteli T (February 2007). Beyond the sequence: cellular organization of genome function. Cell. 128 (4): 787–800.
14. Bernstein BE, Meissner A, Lander ES (February 2007). The mammalian epigenome. Cell. 128 (4): 669–81.
15. Segerstrom SC, Miller GE. Psychological stress and the human immune system: a meta-analytic study of 30 years of inquiry. Psychol Bull. 2004 Jul;130(4):601–30.
16. Steptoe A, Hamer M, Chida Y. The effects of acute psychological stress on circulating inflammatory factors in humans: a review and meta-analysis. Brain Behav Immun. 2007 Oct;21(7):901–12.
17. McCann SM. Neuroimmunomodulation: Molecular aspects, integrative systems, and clinical advances. Ann N Y Acad Sci, 840,1-1998 May 1
18. Dhabhar FS. Effects of stress on immune function: the good, the bad, and the beautiful. Immunol Res. 2014 May;58(2-3):193–210.
19. Webster Marketon JI, Glaser R. Stress hormones and immune function. Cell Immunol. 2008 Mar-Apr;252(1-2):16–26.
20. Allen AP, Kennedy PJ, Cryan JF, Dinan TG, Clarke G. Biological and psychological markers of stress in humans: focus on the Trier Social Stress Test. Neurosci Biobehav Rev. 2014 Jan;38:94–124.
22. Hu D, Wan L, Chen M, Caudle Y, LeSage G, Li Q, Yin D. Essential role of IL-10/STAT3 in chronic stress-induced immune suppression. Brain Behav Immun. 2014 Feb; 36:118–127.
23. Cohen S, Janicki-Deverts D, Doyle WJ, Miller GE, Frank E, Rabin BS, et al. Chronic stress, glucocorticoid receptor resistance, inflammation, and disease risk. Proc Natl Acad Sci USA. 2012 Apr;109(16):5995–9.
24. Schakel L, Veldhuijzen DS, Crompvoets PI, et al. Effectiveness of Stress-Reducing Interventions on the Response to Challenges to the Immune System: A Meta-Analytic Review. Published online 2019 Aug 6. doi: 10.1159/000501645: 10.1159/000501645
25. Cross J, Emotional expression in cancer onset and progression, Soc. Sci. Med. Vol. 28. No. 12 pp. 1239-1248, 1989.
26. Moreno-Smith M, Lutgendorf SK, Sood AK. Impact of stress on cancer metastasis. Future Oncology 2010;6(12):1863-1881.
27. Sloan EK, Priceman SJ, Cox BF, et al. The sympathetic nervous system induces a metastatic switch in primary breast cancer. Cancer Research 2010;70(18):7042-7052.
28. Lutgendorf SK, Sood AK, Anderson B, et al. Social support, psychological distress, and natural killer cell activity in ovarian cancer. Journal of Clinical Oncology 2005;23(28):7105-7113.
29. Lutgendorf SK, DeGeest K, Dahmoush L, et al. Social isolation is associated with elevated tumor norepinephrine in ovarian carcinoma patients. Brain, Behavior, and Immunity 2011;25(2):250-255.
30. Brydon L, Magid K, Steptoe A. Platelets, coronary heart disease, and stress. Brain Behav Immun (2006) 20: 113–119.
31. Sundquist J, Li X, Johansson SE, Sundquist K. Depression as a predictor of hospitalization due to coronary heart disease. Am J Prev Med (2005) 29: 428–433.
32. Kiecolt-Glaser JK, Marucha PT, Malarkey WB, Mercado AM, Glaser R (1995) Slowing of wound healing by psychological stress. Lancet 346: 1194–1196.
33. Walburn J, Vedhara K, Hankins M, Rixon L, Weinman J. Psychological stress and wound healing in humans: a systematic review and meta-analysis. J Psychosom Res. 2009
Sep;67(3):253–71.
34. Kiecolt-Glaser JK, Preacher KJ, MacCallum RC, Atkinson C, Malarkey WB, Glaser R (2003). Chronic stress and age-related increases in the proinflammatory cytokine IL-6. Proc Natl Acad Sci USA 100: 9090–9095.
35. Pedersen AF, Zachariae R, Bovbjerg DH. Psychological stress and antibody response to influenza vaccination: a meta-analysis. Brain Behav Immun. 2009 May;23(4):427–33.
36. Pedersen A, Zachariae R, Bovbjerg DH. Influence of psychological stress on upper respiratory infection—a meta-analysis of prospective studies. Psychosom Med. 2010
Oct;72(8):823–32.
Psychological Effects of Quarantine, Toronto, Canada. Emerg Infect Disv. 10(7); 2004 Jul;10(7),1206-12.
38. Peña J, Chen-Harris H, Allen JE, et al. Sendai virus intra-host population dynamics and host immunocompetence influence viral virulence during in vivo passage. Virus Evol. 2016 Jan; 2(1): vew008.
39. Monteiro R, Azevedo I. Chronic Inflammation in Obesity and the Metabolic Syndrome, Mediators of Inflammation, 2010, pii:289645.
40. Nieman DC, Henson DA, Nehlsen-Cannarella SL, et al. Influence of Obesity on Immune Function, Journal of the American Dietetic Association, 1999; 99: 294–9.
41. Kanneganti TD, Dixit VD. Immunological Complications of Obesity, Nat Immunol, 2012;13:707–12.
42. Smith AG, Sheridan PA, Harp JB, et al. Diet-Induced Obese Mice have Increased Mortality and Altered Immune Responses when Infected with Influenza Virus, Journal of Nutrition, 2007;37:1236–43.
43. Levander OA. Nutrition and Newly Emerging Viral Diseases: An Overview, Journal of Nutrition, 1997;127: 948S–50S.
44. Beck MA, Williams-Toone D, Levander OA. Coxsackievirus B3-Resistant Mice Become Susceptible in Se/Vitamin E Deficiency, Free Radical Biology and Medicine, 2003;34:1263–70.
45. Beck MA. Selenium and Vitamin E Status: Impact on Viral Pathogenicity, Journal of Nutrition, 2007;137: 1338–40.
46. Beck MA, Handy J, Levander OA. Host Nutritional Status: The Neglected Virulence Factor, Trends in Microbiology, 2004;12:417–23.
47. Beck MA, Levander OA, Handy J. Selenium Deficiency and Viral Infection, Jourrnal of Nutrition, 2003;133: 1463S–7S.
48. Beck MA, Nelson HK, Shi Q, et al. (2001) Selenium Deficiency Increases the Pathology of an Influenza Virus Infection, The FASEB Journal, 15: 1481–3.
49. Nelson HK, Shi Q, Van Dael P, et al. Host Nutritional Selenium Status as a Driving Force for Influenza Virus Mutations, The FASEB Journal, 2001; 15: 1846–8. 10.1096/fj. 01-0115fje.
50. Alice M, Tang ES, Semba RD. (2013) Nutrition and Infection, in: Kenrad E., Nelson C.M.W., editors. (eds.) Infectious Disease Epidemiology: Theory and Practice, 3rd edn. Burlington, MA: Jones & Bartlett Learning.
51. Chandra RK. Nutrition and The Immune System: An Introduction, American Journal of Clinical Nutrition, 1997;66: 460S–3S.
53. Ritz BW, Gardner EM. Malnutrition and Energy Restriction Differentially Affect Viral Immunity, Journal of Nutrition, 2006;136:1141–4.
54. Schaible UE, Kaufmann SH. Malnutrition and Infection: Complex Mechanisms and Global Impacts, PLoS Medicine, 2007;4: e115.
55. Ogino S, Fuchs CS, Giovannucci E. How many molecular subtypes? Implications of the unique tumor principle in personalized medicine. Expert Rev Mol Diagn. 2012;12(6): 621–8.
56. Ogino S, Lochhead P, Chan AT, et al. Molecular pathological epidemiology of
epigenetics: Emerging integrative science to analyze environment, host, and disease. Mod Pathol. 2013;26(4): 465–84.
57. Anderson RM. Directly transmitted viral and bacterial infections of man. In: Anderson RM, editor. The population dynamics of infectious diseases: theory and applications. London: Chapman and Hall; 1982. p.1–37.
58. Guerra FM, Bolotin S, Lim G, Heffernan J, Deeks SL, Li Y, et al. The basic reproduction number (R0) of measles: a systematic review. Lancet Infect Dis. 2017;17:e420–8.
59. Nishiura H, Chowell G. The effective reproduction number as a prelude to statistical estimation of time-dependent epidemic trends. In: Chowell G, Hyman JM, Bettencourt LMA, Castillo-Chavez C, editors. Mathematical and statistical estimation approaches in epidemiology. Dordrecht (the Netherlands): Springer Netherlands; 2009. p.103–21.
60. Mercer GN, Glass K, Becker NG. Effective reproduction numbers are commonly overestimated early in a disease outbreak. Stat Med. 2011;30:984–94.
61. Associated Press, Thu 2 Apr 2020. Coronavirus outbreaks like 'wildfire' at US nursing homes under lockdowns. Measures including a ban on visits and daily health screenings of staffers either came too late or were not rigorous enough. Accessed at
https://www.google.com/search?channel=cus2&client=firefox-b-1-d&q=maryland+oldly+care+covid-19.
62. Janney E, MD Coronavirus: Nearly 48 Percent Of Deaths Are In Nursing Homes: Nursing homes are a hot spot for the new coronavirus in Maryland, according to new data provided by the Maryland Department of Health. Apr 29, 2020. Accessed at
https://patch.com/maryland/baltimore/md-coronavirus-nearly-48-percent-deaths-are-nursing-homes
63. Heesterbeek JAP, Dietz K. The concept of R0 in epidemic theory. Stat Neerl. 1996;50:89–110.
64. Handfield C, Kwock J, and MacLeod AS. Innate Antiviral Immunity in the Skin. Trends Immunol. 2018 April; 39(4): 328–340.
65. Yoo J-K, Kim TS, Hufford MM, Braciale TJ. Viral infection of the lung: Host response and sequelae. J Allergy Clin Immunol. 2013 December; 132(6): doi:10.1016/j.jaci.2013.06.006.
66. Nutt, Stephen L.; Hodgkin, Philip D.; Tarlinton, David M.; Corcoran, Lynn M. The
67. Park WB, Perera RA, Choe PG et al. Kinetics of serologic responses to MERS coronavirus infection in humans, South Korea. Emerg. Infect. Dis. 2015;21:2186–2189.
68. MacLennan, ICM; Toellner, K-M; Cunningham, AF et al. Extrafollicular antibody responses. Immunological Reviews.2003,194:8–18.
69. Shlomchik, Mark J.; Weisel, Florian. Germinal center selection and the development of memory B and plasma cells. Immunological Reviews. 2012; 247 (1): 52–63.
70. Wu, JQ and Zha, P. Treatment Strategies for Reducing Damages to Lungs in Coronavirus and Other Lung Infections (February 6, 2020). Available at SSRN:
https://ssrn.com/abstract=3533279 or http://dx.doi.org/10.2139/ssrn.3533279
71. Delamater PL, Street EJ, Leslie TF, Yang YT, Jacobsen KH. Complexity of the Basic Reproduction Number (R0). Emerging Infectious Diseases www.cdc.gov/eid. Vol. 25, No. 1, January 2019.
72. Wu, JQ and Zha, P. Association of COVID-19 Disease Severity with Transmission Routes and Suggested Changes to Community Guidelines (March 13, 2020). Available at
https://www.researchgate.net/publication/339916625, https://www.preprints.org/manuscript/202003.0246/v1
73. Wu, JQ and Zha, P. Randomized Clinical Trial Is Biased and Invalid In Studying Chronic Diseases, Compared with Multiple Factors Optimization Trial (November 4, 2019). Available at SSRN: https://ssrn.com/abstract=3480523 or http://dx.doi.org/10.2139/ssrn.3480523
74. Ridenhour B, Kowalik JM, Shay DK. Unraveling R0: considerations for public health applications. Am J Public Health. 2014;104: e32–41.
75. Anderson RM, May RM. Infectious diseases of humans: dynamics and control. Oxford: Oxford University Press; 1991.
76. Anderson RM. The concept of herd immunity and the design of community-based immunization programmes. Vaccine. 1992;10:928–35.
77. Plans Rubió P. Is the basic reproductive number (R0) for measles viruses observed in recent outbreaks lower than in the pre-vaccination era? Euro Surveill. 2012;17:22.
78. Tang B, Wang X, Li Q et. al. Estimation of the transmission risk of 2019-nCov and its implication for public health interventions. https://ssrn.com/abstract=3525558
79. Yang Y., Yang M., Shen C. et al. Evaluating the accuracy of different respiratory
specimens in the laboratory diagnosis and monitoring the viral shedding of 2019-nCoV infections. medRxiv preprint doi: https://doi.org/10.1101/2020.02.11.20021493.
80. Ma J, Lew L. and Jeong-ho L. A third of coronavirus cases may be ‘silent carriers’,
classified Chinese data suggests. 22 Mar, 2020. South China Morning Post. Accessed at
81. Arons MM, Hatfield, KM, Reddy SC, et al. Presymptomatic SARS-CoV-2 Infections and Transmission in a Skilled Nursing Facility. NEJM.org. April 24, 2020. DOI:
10.1056/NEJMoa2008457
82. Lauer SA, Grantz KH, BA, MHS QB et al. The Incubation Period of Coronavirus Disease 2019 (COVID-19) From Publicly Reported Confirmed Cases: Estimation and Application. Ann Intern Med. Annals.org on 10 March 2020. doi:10.7326/M20-0504
83. Bao L, Deng W, Gao H et al. Reinfection could not occur in SARS-CoV-2 infected rhesus macaques. Preprint at bioRxiv https://doi.org/10.1101/2020.03.13.990226 (2020).
84. Chen D, Xu W, Lei Z et al. Recurrence of positive SARS-CoV-2 RNA in COVID-19: A case report. Int J Infect Dis. 2020 Apr; 93: 297–299.
85. Keeling MJ, Grenfell BT. Individual-based perspectives on R0. J Theor Biol. 2000; 203:51–61.
86. Breban R, Vardavas R, Blower S. Theory versus data: how to calculate R0? PLoS One. 2007;2:e282.
87. Artalejo JR, Lopez-Herrero MJ. On the exact measure of disease spread in stochastic epidemic models. Bull Math Biol. 2013;75:1031–50.
88. Khan A, Naveed M, Dur-E-Ahmad M, Imran M. Estimating the basic reproductive ratio for the Ebola outbreak in Liberia and Sierra Leone. Infect Dis Poverty. 2015;4:13.
89. Roberts M, Heesterbeek H. Bluff your way in epidemic models. Trends Microbiol. 1993;1:343–8.
90. Bani-Yaghoub M, Gautam R, Shuai Z, van den Driessche P, Ivanek R. Reproduction numbers for infections with free-living pathogens growing in the environment. J Biol Dyn. 2012;6:923–40.
91. Nishiura H. Correcting the actual reproduction number: a simple method to estimate R 0 from early epidemic growth data. Int J Environ Res Public Health. 2010;7:291–302.
92. Roberts MG. The pluses and minuses of R0. J R Soc Interface. 2007;4:949–61. 93. Pellis L, Ball F, Trapman P. Reproduction numbers for epidemic models with households and other social structures. I. Definition and calculation of R0. Math Biosci. 2012;235:85–97.
94. Lloyd-Smith JO, Schreiber SJ, Kopp PE, Getz WM. Superspreading and the effect of individual variation on disease emergence. Nature. 2005;438:355–9.
95. Howard J, Huang A, Li Z. et al. Face Masks Against COVID-19: An Evidence Review. Preprints (www.preprints.org) 12 April 2020 doi:10.20944/preprints202004.0203.v1