IJEDR1602292
International Journal of Engineering Development and Research (www.ijedr.org)1626
PG Student, Assistant Professor, Assistant Professor1Department of Mechanical Engineering, New Horizon College of Engineering, Bangalore – 560103 3Vemana Institute of Technology, Bangalore –560034.
________________________________________________________________________________________________________
Abstract - A leaf spring is a basic type of spring, usually utilized for the suspension as a part of wheeled vehicles. Leaf Springs are long and contract plates joined to the casing of a trailer that rest above or beneath the trailer's hub. For sheltered and happy with riding, to keep the street stuns from being transmitted to the vehicle segments and to defend the inhabitants from street stuns it is important to decide the most extreme safe anxiety and diversion. The goal is to discover the hassles and distortion in the leaf spring by applying static burden on it and decide the normal recurrence of the leaf spring with various cell strong basic leaf spring. These qualities are figured logically, by utilizing limited component investigation. Along these lines in the present work, leaf spring is composed by considering static burden on vehicle. The model of leaf spring is made in CATIA V5 and examination is done utilizing ANSYS 14.5 workbench. The outcome for anxiety, Strain, twisting and normal frequencies are contrasted and leaf spring with non-cell strong structure and investigation result.
Index Terms – ANSYS, Leaf spring, Static and Dynamic analysis
I.INTRODUCTION
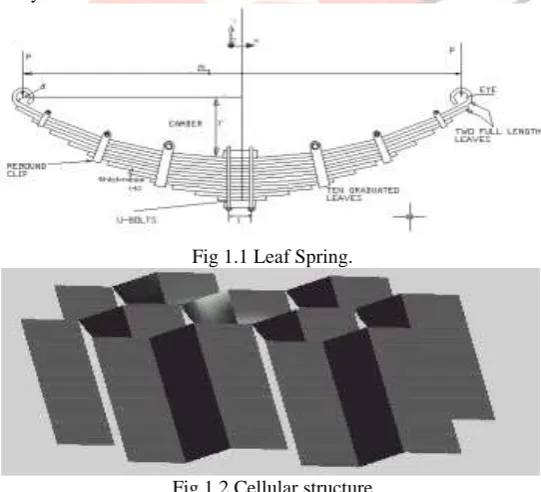
A leaf spring is a simple form of spring, commonly used for the suspension in wheeled vehicles. Leaf Springs are long and narrow plates attached to the frame of a trailer that rest above or below the trailer's axle.
Honeycomb is a structure made up of hexagonal cells (Figure 1). It derives its name from its close resemblance to a bee honeycomb, though there is no variation in the depth direction. The honeycombs of hexagonal cell structure are characterized by considerable rigidity in shear, high crushing stress, almost constant crushing force, long stroke, low weight and relative insensitivity to local loss of stability.
Fig 1.1 Leaf Spring.
Fig.1.2 Cellular structure
The honeycomb sandwich construction is one of the most valued structural engineering innovations developed by the composites industry. Used extensively in aerospace and many other industries, the honeycomb sandwich provides the following key benefits over conventional materials:
- Very low weight - High stiffness - Durability
IJEDR1602292
International Journal of Engineering Development and Research (www.ijedr.org)1627
II.ANALYSIS OF LEAFSPRING
In the last few years SOLID WORKS software has become increasingly popular and is nowadays intensively used in geometric modeling. Since their conceptual simplicity allows for more flexible and highly efficient processing.
By obtaining the manufacturing and geometric dimensions of the component, draw the section of the component create the solid model by direct extrusion. All of the models were built in SOLID WORKS , converted into .igs files, and imported into Static Structural projects within ANSYS Workbench 15 within Design Modeler, the geometry was slightly modified before it was imported into ANSYS Mechanical. as shown in Figure .
Tetrahedron Method is used as well as Mapped Face Meshing on select faces. Edge sizing and face sizing were also used to get more elements on faces of interest and reduce the elements on less important faces such as the outer surface of the block.
After achieving an appropriate mesh, boundary conditions were applied to the model. The displacement boundary conditions are detailed in Figure 2.1
Fig.2.1 Meshing of leaf spring 2.1 Vibration Analysis
The differential stiffness matrix is a function of the geometry, element type and applied loads. This is the reason why the differential stiffness is also called the geometric stiffness matrix.
2.2 PROCEDURE FOR FREE VIBRATION ANALYSIS
ANSYS WORKBENCH is used to solve Natural frequency, following is the procedure listed below 1. Select modal analysis.
2. Import model igs file.
3. Imported model should be mesh of 100 relevance. 4. Apply the boundary conditions.
5. Solve the current model
6. Get the solution of total deformation for 6 modes.
7. Note down the natural frequency of the component at different modes.
8. Repeat the same procedure for the components of solid structure, cell structure and foam filled cell structure. 2.3 STATIC ANALYSIS SIMULATION
Leaf spring Analysis
Figure: Shows model of Structural steel view
IJEDR1602292
International Journal of Engineering Development and Research (www.ijedr.org)1628
Figure: Shows deformation results of Structural steelFigure: Shows von misses stress results of Structural steel
Figure: Shows von misses strain results of Structural steel
Figure: Shows single plate honeycomb model view
IJEDR1602292
International Journal of Engineering Development and Research (www.ijedr.org)1629
Figure: Shows deformation results of Single plate honeycomb viewFigure: Shows von misses stress results of Single plate honeycomb view
Figure: Shows von misses strain results of Single plate honeycomb view
Figure: Shows 3 plate honeycomb model view
Figure: Shows 3 plate honeycomb meshed model view
IJEDR1602292
International Journal of Engineering Development and Research (www.ijedr.org)1630
Figure: Shows 3 plate von misses stress results of Single plate honeycomb viewFigure: Shows 3 plate von misses strain results of Single plate honeycomb view 2.4 MODAL ANALYSIS SIMULATION
a).Structural Steel leaf spring simulation
Figure: Shows the mode 1 total deformation result
IJEDR1602292
International Journal of Engineering Development and Research (www.ijedr.org)1631
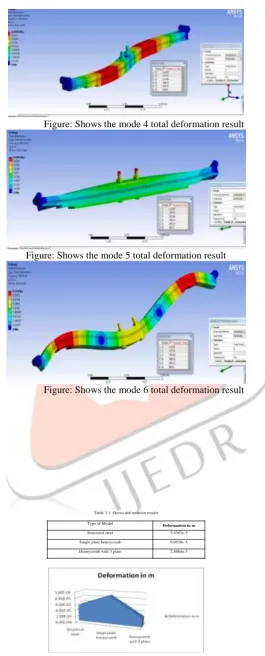
Figure: Shows the mode 3 total deformation resultFigure: Shows the mode 4 total deformation result
Figure: Shows the mode 5 total deformation result
Figure: Shows the mode 6 total deformation result
Figure: Shows the X directional deformation result
IJEDR1602292
International Journal of Engineering Development and Research (www.ijedr.org)1632
Figure: Shows the Z directional deformation resultb).Single plate honeycomb leaf spring simulation
Figure: Shows the mode 1 total deformation result
Figure: Shows the mode 2 total deformation result
Figure: Shows the mode 3 total deformation result
IJEDR1602292
International Journal of Engineering Development and Research (www.ijedr.org)1633
Figure: Shows the mode 5 total deformation resultFigure: Shows the mode 6 total deformation result c).Honeycomb 3 plate leaf spring simulation
Figure: Shows the mode 1 total deformation result
Figure: Shows the mode 2 total deformation result
IJEDR1602292
International Journal of Engineering Development and Research (www.ijedr.org)1634
Figure: Shows the mode 4 total deformation resultFigure: Shows the mode 5 total deformation result
Figure: Shows the mode 6 total deformation result
III.RESULT AND DISCUSSION
Deformation
Above analysis observation shows that deformation is decreases in honeycomb of 3 plates.
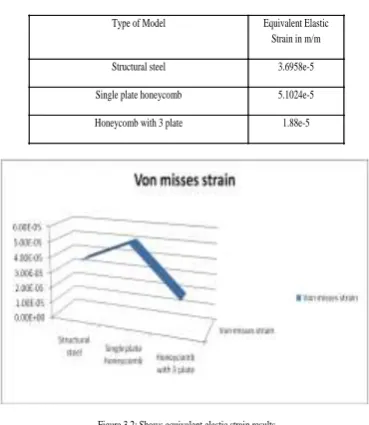
Strain
Table 3.1: Shows deformation results
Type of Model Deformation in m Structural steel 5.4363e-5 Single plate honeycomb 9.0938e-5 Honeycomb with 3 plate 2.8684e-5
IJEDR1602292
International Journal of Engineering Development and Research (www.ijedr.org)1635
Above analysis observation shows that equivalent elastic strain is goes on decreasing by increasing the number of plates with cellulor sloidsAbove analysis observation shows that equivalent elastic strain is goes on decreasing by increasing the number of plates with cellulor sloids
Stress
Above analysis observation shows that stress is decreases in honeycomb of 3 plates.
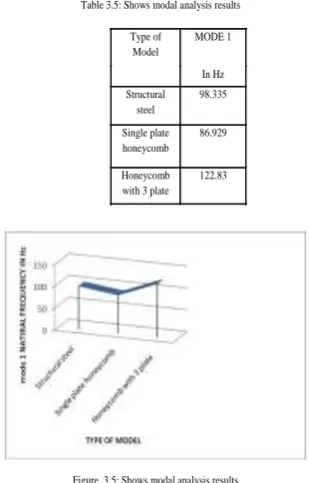
Modal analysis
WITHOUT FOAM FILLED CELLS
Table 3.2: Shows equivalent elastic strain results
Type of Model Equivalent Elastic Strain in m/m
Structural steel 3.6958e-5
Single plate honeycomb 5.1024e-5
Honeycomb with 3 plate 1.88e-5
Figure 3.2: Shows equivalent elastic strain results
Table 3.4: Shows stress results
Type of Model Von mises Stress in Pa
Structural steel 5.07E+07
Single plate honeycomb 4.44E+07
Honeycomb with 3 plate 3.93E+07
IJEDR1602292
International Journal of Engineering Development and Research (www.ijedr.org)1636
The above observation shows that natural frequency of the cellular solids leaf spring increases due to reduction of mass it induces more vibration.WITH FOAM FILLED CELLS
The above observation shows that natural frequency of the cellular solids with foam filled leaf spring decreases due to increases of mass it prevents more vibration.
IV.CONCLUSIONS
1. Deformation goes on decreases by introducing cellular solid structure leaf spring. 2. Stress and strains also decreases by introducing cellular solid structure leaf spring.
3. Use of cellular solid’s structural leaf spring increases the self-vibration because of mass reduction. 4. Use of weight less foam filled cellular solid’s structural leaf spring decreases the self
5. Vibration because of increasing the mass without increase of weight.
6. Use of cellular solids ‘structural leaf spring gives the better structural strength and foam
7. Filled cellular solids ‘structural leaf spring gives both structural strength and better damping capacity.
V.SCOPE FOR FUTURE EXPLORATION
1. Above analysis can be done for different models with different aerospace structural materials. Figure .3.5: Shows modal analysis results
Table 3.6: Shows modal analysis results
Type of Model MODE 1 In Hz Structural steel 98.335 Single plate honeycomb 66.929 Honeycomb with 3 plate
40.83
IJEDR1602292
International Journal of Engineering Development and Research (www.ijedr.org)1637
2. Above analysis can be done for different models with composite materials.3. Above analysis can be done for different models with Z-directional loading.
REFERENCES
[1] Marcelino P, Nascimento, Herman J.C, Voorwald, Joao da C, Payao Filho, “Fatigue strength of tungsten inert gas repaired weld joints in airplane critical structures”, Journal of Material processing Technology, Vol.211, 2011, pp 1126-1135.
[2] Ossa E.A, “Failure Analysis of civil aircraft landing gear”, Engineering Failure Analysis, Vol.13, 2006, pp 1177-83. [3] Joy Xiaoya Tao, Steve Smith, Andrew Duff “The effect of overloading sequences on landing gear fatigue damage”, International Journal of Fatigue, Vol.31, 2009 pp 1837-1847.
[4] De Farias Azevedo CR, Hippert E, “Fracture of an aircrafts landing gear”, Engineering Failure Analysis, Vol.9, 2002, pp 265-75.
[5] Ossa E.A, “Failure Analysis of civil aircraft landing gear”, Engineering Failure Analysis, Vol.13, 2006, pp 1177-83.
[6] C.R.F Azevedo, E. Hippert Jr. G. Spera, P. Geraradi, “Aircraft landing gear failure: fracture of outer cylinder lug”, Engineering Failure Analysis, Vol.9, 2002, pp 1-15.
[7] L.A.L Franco, N.J Lourenco, M.L.A, Graca, “Fatigue fracture of a nose landing gear in military transport aircraft”. Engineering Failure Analysis, Vol.13, 2006, pp 474-47.
[8] Iqbal Rasool Memon, Xing Zhang, Deyu Cui, “Fatigue life prediction of 3D problems by damage mechanics with two-block loading” International Journal of fatigue , Vol.24, 2002, pp 29-37.
[9] Jing Li, Zhong-Ping Zhang, Qiang Sun, Chun-Wang Li, “Mulitiaxial fatigue prediction for various metallic materials based on the critical plane approach” International Journal of fatigue, Vol.33, 2011, pp 90-101.
[10] Ali Fatemi, Nima Shamsaei “Multiaxial fatigue: An overview and some approximation models for life estimation” International Journal of fatigue, Vol.33, 2011, pp 948-958.
[11] Ellyin F, “Fatigue crack growth and life prediction”, London Champan and Hall,1997, pp 912-924
[12] Aleksandar Grbovic, Bosko Rasuo, “FEM based fatigue crack growth predictions for spar of light aircraft under variable amplitude loading”, Engineering Failure Analysis, Vol.26, 2012, pp 50-64.
[13] F. Walther, D Eifler, “Fatigue life calculation of SAE 1050 and SAE 1065 steel under random loading”, International Journal of Fatigue, Vol.29, 2007, pp 1885-1892.
[14] B. Li, L. Reis, M. de Freitas, “Simulation of Cyclic Stress/Strain Evolutions for Multiaxial Fatigue Life Prediction”, International Journal of Fatigue, Vol.28, 2006,a.451-458.
[15] “R.E Peterson the stress concentration design factors”, john Wiley and sons, 1967,a.259-264.
[16] Ralph I Stephens, Ali Fatemi, Robert R Stephens, Henry O Fuchs, “Metal Fatigue in Engineering”, Wiley Inter Science, Second edition, 2001, pp 99-117.