Volume 8, No. 1, Jan-Feb 2017
International Journal of Advanced Research in Computer Science
RESEARCH PAPER
Available Online at www.ijarcs.info
A Study and Analysis of Land Use Classification using Geographical Information
System
Tejas Satishbhai Mehta
Research Scholar, School of Computer Science Dr. Babasaheb Ambedkar Open University,
Ahmadabad (Gujarat) India
Dr. Dhaval R. Kathiriya
Director - Information Technology (Professor-Computer Science)
Anand Agricultural University, Anand (Gujarat) India
Abstract: Land use and land cover knowledge has become very important for country to overcome the problems of uncontrolled development, environmental quality, decreases in agricultural lands and destruction of wetlands.A “geographic information system” (GIS) is a computer-based tool used to create, manipulate, analyze, store and display information computer-based on its location. Geographic Information Systems are very helpful in agricultural application.Knowledge of current land use is essential to support analysis and management of land, vegetation, water resources and quality, and the maintenance of biodiversity. This study focuses on to store and integrates data for GIS study. This was done for Land Usage Statistics of Gujarat state districts. Spatial analysis methods and statistical methods were performed on the data.
Keywords: Geographical Information System, GIS, Land Usage, agriculture, Analysis
I. INTRODUCTION
Land use and land cover knowledge has become very important for country to overcome the problems of uncontrolled development, environmental quality, decreases in agricultural lands and destruction of wetlands. Land use data are needed in the analysis of environmental processes and problems that must be understood if living conditions and standards are to be improved or maintained at current levels. Land Use Classification (LUC) is required to calculate land area and its effect on eco-system. The standard nine-fold land use classification is used for GIS analysis. This classification has covers the total area of land that needs to be classified without considering that it is being used for any other economical activity. Land cover classification can be analyzed with GIS software and output will be used for projecting changes in land cover in relation to land use. Land Use Classification gives very useful insights for agricultural decision.
II. THE OVERVIEW OF GIS
Geographic Information Science (GIS) is the science concerned with the systematic and automatic processing of spatial data and information with the help of computers. It helps to solve spatial problems with computers. Geographic Information System stores, analyzes, and display spatial data. Some major terms related to GIS are:
• Geographic relates to the surface of the earth. • Information is a knowledge derived from data.
• System is a group of interacting, interrelated, or interdependent elements forming a complex whole.
Elements of GIS
A Geographical Information System made up with five critical components: People, Data, Hardware, Software, and Procedure.
1. People: People are the most important part of a GIS. They define and develop the procedures used by a GIS. It can overcome shortcoming of the other 4 elements.
2. Data: Data is the information used within a GIS since. It is possible that a GIS incorporates data from multiple sources. So, its accuracy defines the quality of the GIS and it determines the types of questions and problems that may be asked of the GIS.
3. GIS software: It consists all the software used for databases, drawings, statistics, and imaging. There are different types of software like paid or open-source are available in market. It is important to select GIS software with appropriate needs and skill, which is used on type of problems that the GIS may be used to solve.
4. Hardware: Computer hardware decides speed of GIS, and supported GIS software. It may also control the types of the people working with the GIS.
[image:1.595.328.562.397.729.2]5. Procedures: The procedures or methods are used to input, analyze, and query GIS data. It determines the quality and validity of the final product. The procedures are simple steps taken in a well defined and consistent method to produce correct results from the GIS system.
Figure 1. Elements of GIS
Types of GIS Data
geographical position of a feature, while attribute data or tabular data shows characteristics of spatial features.
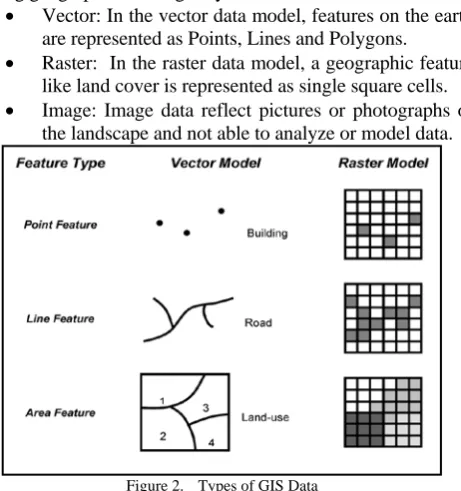
Three basic types of spatial data models have evolved for storing geographic data digitally.
• Vector: In the vector data model, features on the earth are represented as Points, Lines and Polygons.
• Raster: In the raster data model, a geographic feature like land cover is represented as single square cells. • Image: Image data reflect pictures or photographs of
[image:2.595.51.282.99.345.2]the landscape and not able to analyze or model data.
Figure 2. Types of GIS Data
Attribute values in a GIS are stored as relational database tables. Each feature (point, line, polygon, or raster) within each GIS layer will be represented as a record in a table.
III. THE APPLICATIONS OF GIS IN AGRICULTURE
Geographic Information Systems are very helpful to measure climate change, to forecast crop yield and crop quality. It is also possible to map geographic and geologic features of current farm-land. It is used by agricultural scientists and farmers to create more effective and efficient farming techniques to increase food production. Some major applications of GIS in agriculture are:
Climate Change
(Schlenker, Hanemann, & Fisher, 2007) Studied how surface water availability, soil characteristics, and climatic variables capitalize into farmland values, and how these values would be affected by changes in the climatic variables. Using a micro-level data set of individual farms in California they found a major effect of water availability on farmland values, controlling for other influences.
Crop Yield Forecast
(Basso, Cammarano, & Carfagna, 2013) Stated that yield forecast using agrometeorological inputs is used in many yield forecasts research and programs. An algorithm model is build using a matrix with historic yield and several agrometeorological parameters like temperature and rainfall. Then, a prediction algorithm is used for yields and agrometeorological parameters. The NASS (2006) program uses a statistical model to forecast crop yield and production. They use two methods to forecast yield, the former refer to the use sample-derived models for forecasting yields and their component; the latter, is use models at state and regional levels.
Crop Quality
(Nishiguchi & Yamagata, 2009) Reviewed that improving agricultural efficiency is an issue not just for developed
countries but for the entire world including emerging economies, and it is recognized that encouraging greater efficiency will intensify the need for greater use of information technology on the farm. The Hitachi Software Engineering Co., Ltd.’s agricultural information management system uses GIS technology to utilize and provide unified management of farm information about things like products, producers, yields, and quality. They show relationship between cultivation records and parameters such as product yield and quality can be presented visually by incorporating functions such as management of production records to support the recording of past production information for use in checking the appropriateness of agricultural chemical use.
Effective Farming Techniques
In summation (Limpisathian, 2011) wrote that precision farming looks to be a promising agriculture concept that seems to be overall beneficial to all involved; from the farmers themselves to the consumers like us. It looks to improve the efficiency of agriculture while also saving the environment. But ultimately, there are still some possible limitations of the concept. Due to the fact that it relies so much on the farmers and since the GIS software can only interpret the data that the farmer gives it, if the data that the farmer fed it is incorrect the resulting calculation will therefore be incorrect.
Geostatistical Analysis of Soil Nutrients Based on GIS (Yangbo, Donglin, Guobin, Xuetao, Zhiwei, & Wei, 2013) Stated that one of the basic conditions for crops to grow, soil has been changing under the combined influence of different factor from their study. The condition of soil nutrients is relevant with the speed of crop growth, state of development, yields and arrangement of crops, proper application of fertilizers and anthropic factor etc. Due to the combined effect of these factors, soil nutrients, nutrients content and patterns of distribution differentiate in different areas.
The crop disease and pest warning and prediction system (Luo J., 2009) Studied on crop diseases and pest, and found crop diseases and insect pests were all important biological hazard in agricultural production. For many years, crop diseases and pest restricted seriously the agricultural sustainable development. Statistics from the UN Food and Agriculture Organization showed the world grain yield lost 10% because of pests and 14% because of diseases for many years. At the same time, the world cotton yield lost 16% because of pests and 14% because of diseases. The paper introduced a warning system of diseases and pests which were established based on GIS (geographic information system) and RS (remote sense).
Land use classification
Wise land-use planning helps in making knowledgeable decisions about land use and the environment (Amber & John, December 2000). Holistic planning involves input from multiple, interrelated data sources and types. In order to accomplish this feat a great deal of information must be considered simultaneously. Physical and chemical soil information is a vital component in the planning process, reflecting directly upon land-use suitability.
displayed in a variety of overlap, scales, and combinations to fit the needs of the user.
IV. LAND USE CLASSIFICATION
In the agricultural census, the area of the holding is classified according to its main land use. Knowledge of current land use is essential to support analysis and management of land, vegetation, water resources and quality, and the maintenance of biodiversity. Land is the major agricultural and natural resources with significant impact on economic, environmental and social aspects of a nation and the world.
Technical Committee on Co-ordination of Agricultural Statistics (TCCAS), set up in 1948 by the Ministry of Food & Agriculture, INDIA recommended a nine-fold land-use classification and also recommended standard concepts & definitions for all the states to follow. The nine fold classification of Land use has been adopted by all the states since 1950-51. AS per (Concepts and Definitions, 2017) given by Directors and Economics and Statistics, INDIA for land use statistics, major area classified as:
• Geographical Area: The latest figures of geographical area of the State/Union Territories are as provided by the Office of the Surveyor General of India
• Reporting Area for Land Utilization Statistics: The Reporting area stands for the area for which data on land use classification is available. In areas where land utilization figures are based on land records, reporting area is the area according to papers prepared by the village accountants. In some cases, the village papers may not be maintained in respect of the entire area of the State. In such cases, estimates of classification of area from agriculture census, 2000-01 and 2005-06 are adopted to complete the coverage.
• Forest Area: This includes all land classified either as forest under any legal enactment, or administered as forest, whether State-owned or private, and whether wooded or maintained as potential forest land.
• Barren and Un-culturable Land: This includes all land covered by mountains, deserts, etc. Land, and which cannot be brought under cultivation.
• Land under Miscellaneous Tree Crops, etc.: This includes all cultivable land used for some agriculture use but not included in ‘Net area sown’ like Land under casuring trees, thatching grasses, bamboo bushes and other groves for fuel.
• Culturable Waste Land: This includes land available for cultivation, whether taken up or not taken up for cultivation once, but not cultivated during the last five years or more in succession including the current year for some reason or the other.
• Fallow Lands other than Current Fallows: This includes all land, which was taken up for cultivation but is temporarily out of cultivation for a period of not less than one year and not more than five years.
• Current Fallows: This represents cropped area, which is kept fallow during the current year.
• Net Area Sown: This represents the total area sown with crops and orchards. Area sown more than once in the same year is counted only once.
• Total Cropped Area: This represents the total area sown once and/or more than once in a particular year, i.e. the area is counted as many times as there are sowings in a year. This total area is also known as total cropped area or total area sown.
• Area Sown more than once: This represents the areas on which crops are cultivated more than once during the agricultural year. This is obtained by deducting Net Area Sown from Gross Cropped Area.
V. LAND USE CLASSIFICATION ANALYSIS USING GIS
Agriculture is a purely land based activity. Contribution of land in agricultural output is more than other sectors. Quality of land has a direct bearing on the productivity of agriculture. It is clear that the scope for bringing in additional land under net sown area is limited. There is, thus, a need to evolve and adopt various land-saving technologies. A technology which raises the yield of any particular crop per unit area of land is important to increase yield. A technologies increase the total output per unit area of land from all crops grown by increasing net sown area again in one agricultural year. We have studied Land Use Classification (LUC) statistics of Gujarat state with following stages:
1. Collection of Land Usage Classification databases from government department involved in agriculture.
2. Integration of shapefile and database in GIS.
3. Performing various queries and results from GIS map.
Collection of land usage databases
[image:3.595.305.551.450.603.2]As per (Web Based Land Use Statistics Information) the total reporting Area for Land Use Statistics of the Gujarat state is 18868100 Ha. It has been classified according to different uses of land. The net area sown under cultivation during the year was 9746900 Ha, which occupies 51.66% of the total reporting area in the State. The total cropped area is 11256900 Ha, which is 59.66%. The total area sowed more than once from cropped area is 1510000 Ha, which is 15.49% of net area sown (Table – I).
Table I. Total Area and Classification of Area ict of Gujarat State for the Year Ending 2004-05
Area (Hectare) Gujarat
Total Area 18868100
Forests Area 1853600
Not Available for cultivation 3754200
Uncultivated Land Area 2831000
Fallow Land Area 682400
Net Area Sown 9746900
Net Area Sown (%) 51.66
Cropped Area 11256900
Cropped Area Sown (%) 59.66
Area Sown More Than Once 1510000
Net Area Sown Again (%) 15.49
Source: (Web Based Land Use Statistics Information)
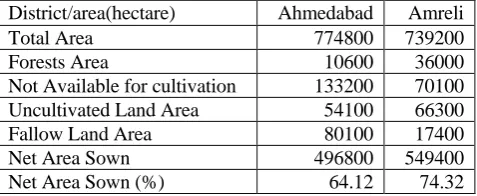
As we can see from (Table- II) districts of Gujarat land use statistics details, we can easily found that some districts are performing well in net sown area while some needs improvement to increase net sown area.
Table II. Total Area and Classification of Area in some District of Gujarat State for the Year Ending 2004-05
District/area(hectare) Ahmedabad Amreli
Total Area 774800 739200
Forests Area 10600 36000
Not Available for cultivation 133200 70100 Uncultivated Land Area 54100 66300
Fallow Land Area 80100 17400
Net Area Sown 496800 549400
[image:3.595.308.547.686.784.2]Cropped Area 576000 584400 Cropped Area Sown (%) 74.34 79.06 Area Sown More Than Once 79200 35000 Net Area Sown Again (%) 15.94 6.37
Source: (Web Based Land Use Statistics Information)
Integration of shapefile and tabular database in GIS
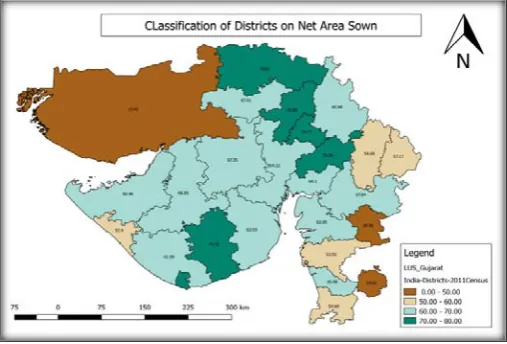
[image:4.595.36.277.55.111.2]The ESRI Shape file or simply a shape file is a popular geospatial vector data format for geographic information systems software. ESRI (Environmental Systems Research Institute) is a leading developer of GIS software and the Shape file format used by their products is one of the most popular mediums for storing vector map data. An ESRI shape file is actually composed of three separate files: a main file with a .SHP extension, an index file with a .SHX extension, and a dBase file with a .DBF extension that contains the associated attribute data QGIS is a user friendly Open Source Geographic Information System (GIS) licensed under the GNU General Public License. QGIS is an official project of the Open Source Geospatial Foundation (OSGeo). We have integrated Gujarat state administrative shapefile and Land Use statistics tabular database with help of QGIS. It shows classification of districts of net sown area (Fig. 3)
Figure 3. Classification of districts on net area sown in GIS
Districts are divided in 5 categories for classification. We have found that major districts are above 50% category.
Results from GIS map
[image:4.595.37.291.318.490.2]As we mentioned, it is not easy to increase net sown area, but, it is possible to increase area which is sown again in a year. It helps to increase total cropped area. We found some interesting results from GIS map.
Figure 4. Classification of districts on net area sown again in GIS
Gujarat districts are classified with 5 ranges respective to net area sown again after performing queries on GIS database. Major districts are in below 30% category. Some districts have value more than 30%. It is possible and easy to increase sown area instead of trying to add new agriculture land for sowing.
Table III. Comparision of net sown area again
Category (Area Sown More Than Once)
Total Area
Net Area Sown
Croppe d Area
Area Sown More Than Once
Area Sown More Than Once (%)
I (<30%) 15882700 7763200 8554800 791600 10.19 II (>30%) 2985400 1983700 2702100 718400 36.21
Average of area sown more than once for category-I districts is 10.19% while Average of area sown more than once for category-II districts is 36.21% (Table-III). If average of districts of area sown more than once of category-I will increase to 25% then it will increase in total 1149200 Ha. This area will be available for sown again, which helps to strong our economy as well as makes farmer richer.
VI. CONCLUSION
This research used a GIS in order to perform spatial query on land usage statistics of Gujarat state. It is not easy to increase agricultural land a by agriculture department or authorities, but, it is possible to increase area which is used to sown again in a year. It helps to increase in total cropped area. There is average of only 10.19% of land area is used for sowing again in 20 districts of Gujarat. If this average of districts will increase to 25% from 10.19%, then it will increase in total 1149200 Ha. This area will be available for sown again, which helps to strong our economy as well as makes farmer richer.
VII. REFERENCES
[1] Amber, L., & John, M. (December 2000). Using GIS as an Agricultural Land-Use Planning Tool. Department of Crop and Soil Environmental Science - College of Agriculture and Life Sciences - Virginia Tech.
[2] Basso, B., Cammarano, D., & Carfagna, E. (2013). Review of crop yield forecasting methods and early. First Meeting of the Scientific Advisory Committee of the Global Strategy to Improve Agricultural and Rural Statistics. Italy: FAO Headquarters.
[3] Limpisathian, P. (2011). Geographic Information System in Agriculture and Precision Farming.
[4] Luo J., H. W. (2009). The crop disease and pest warning and prediction system. In Computer and Computing Technologies in Agriculture II, Volume 2: The Second IFIP International Conference on Computer and Computing Technologies in Agriculture (CCTA2008), October 18-20, 2008, Beijing, China (pp. 937-945). Boston, MA: Springer US.
[5] Nishiguchi, O., & Yamagata, N. (2009). Agricultural Information Management System. Improving Agricultural Efficiency Through Information Technology, Hitachi Review , 58 (6).
[6] Schlenker, W., Hanemann, W. M., & Fisher, A. C. (2007). Water Availability, Degree Days, and the Potential Impact of Climate Change on Irrigated Agriculture in California. Climatic Change , 81 (1), 19.
[image:4.595.37.293.608.773.2]on GIS and Geostatistics in the Typical Plain and Hilly-Ground Area of Zhongxiang, Hubei Province. Open Journal of Soil Science , 3, 218-224.