Article
1
A Rapid Method to Evaluate Bacterial Content in Food
2
Mustafa Al-Adhami 1,2, Marisa Patsy 1, Elizabeth Tan1, Dina El-Oseily1, Govind Rao1,3, and Yordan
3
Kostov1,3,*
4
1 Center for Advanced Sensor Technology, University of Maryland Baltimore County, Baltimore, MD, 21250,
5
USA; [email protected]
6
2 Department of Mechanical Engineering, University of Maryland Baltimore Count, Baltimore, MD, 21250,
7
USA; [email protected]
8
* Correspondence: [email protected]; Tel.: + (410) 455-6569
9
10
Abstract
:
The importance of detecting bacteria in various food products is ever-increasing, due to11
recent food trends that lend themselves to food contamination. Additionally, the detection of
12
probiotics in food products is of increasing importance to consumers, who realize the benefits of
13
probiotics on one’s diet. Existing technologies for detection of bacteria in food are accurate, but most
14
are slow, increasingly costly and unsuitable for applications outside of research laboratories. Optic
15
approaches have recently emerged as an alternative, allowing rapid detection of bacterial presence.
16
This study employs a portable kinetics fluorometer, fabricated in-house, in conjunction with NADH
17
sensitive fluorescence reporter for analysis of various food products. The presence of bacteria is
18
detected in 5 minutes. Both pathogenic and probiotic bacteria were detected in food products, such
19
as raw chicken and beef, spoiled lettuce and contaminated water, yogurt, and kombucha tea. The
20
cellular activity of two probiotic pills was also verified. All samples displayed varying levels of
21
bacterial activity. The study indicates the viability of biosensors being used as an alternate method to
22
detect bacteria in food products – and the viability of a fluorescence-based biosensor to detect viable
23
bacteria. The approach is suitable for both laboratory and field determinations.
24
Keywords: optic biosensor; fluorescence; bacterial detection;
25
26
1. Introduction
27
In 2018, an E. coli outbreak due to contaminated romaine lettuce sickened nearly 200 people
28
across the United States, and led to the deaths of five people [1]. Food contamination most often
29
occurs at various stages at the production level; this, coupled with the rising popularity of raw foods
30
and fresh produce [2], makes the detection of pathogens in food increasingly important.
31
Ready-made meals also have the potential to host pathogenic bacteria [3,4], and should therefore be
32
a source of concern. As long as these food products remain popular with buyers, the detection of
33
potentially harmful bacteria should be a primary concern in order to protect consumers and ensure
34
food quality.
35
On the other hand, there are types of beneficial bacteria, or probiotics, that are present in
36
many types of food, and consumers are increasingly aware of the benefits presented by these
37
probiotics. However, “there is no FDA regulatory definition for the term probiotic” and thus the
38
labeling of foods that may contain them is somewhat ambiguous [5]. It is of increasing interest to be
39
able to analyze these foods for the presence of probiotics. Despite improvements in bacterial
40
detection technology, there is still a need for universal bacterial detection processes [6].
41
There are various widely accepted methods for microbial detection that have been
42
traditionally employed in the past. One of the oldest techniques is the culture-based approach. What
43
this method offer in terms of accuracy, reliability, and cost-effectiveness, it lacks in efficiency; most
44
culture-based procedures require 2 to 3 days for preliminary identification of pathogens [7].
45
Another slightly more advanced category of approaches are immunoassays, which rely on
46
the binding of antibodies to antigens [8]. These tests are easier to perform, produce more timely
47
results, and are generally more cost-effective than methods that require bacterial culture. However,
48
they are not always accurate, as false positive results are possible. Additionally, it is favorable to use
49
monoclonal antibodies as opposed to polyclonal antibodies for immunoassays because they are
50
more sensitive and return more precise results; however, they are also much more costly [9].
51
A slightly different approach involves the use of nucleic acid-based detection methods such
52
as polymerase chain reaction (PCR), nucleic-acid sequence-based amplification (NASBA), and
53
loop-mediated isothermal amplification (LAMP); these methods focus on targeting and amplifying
54
specific gene sequences of pathogens for identification. These techniques are popular because they
55
are accurate, sensitive, and increasingly time-efficient [10]. However, there are disadvantages to
56
these methods as well. Not only are they a much more expensive alternative [7], but they present
57
more procedural difficulties and are not as easily transferrable to on-site work, as opposed to a
58
research setting [8].
59
The most recently adopted method of detection is biosensors, generally comprised of a
60
bioreceptor and a transducer, which translates the reactions within the sensor into electrical signals
61
[7]. The optic biosensor has proven to be a highly specific type of biosensor in terms of detecting
62
pathogens. Optic biosensors utilize transducers to detect the physical changes of an analyte after
63
bonding with a biological recognition element; this change is then converted into qualitative or
64
quantitative units in order for easy interpretation by the end user [11]. The use of biosensors in the
65
evaluation of food quality is limited; however, there are many advantages that make them a viable
66
option. Along with their high sensitivity and specificity, they require much less extensive sample
67
preparation, making it a simpler and more time-efficient method [11]. They are also smaller in size,
68
and their portability makes them an attractive option for on-site work. The drawbacks of optical
69
biosensors, and all biosensors, are the high cost and necessary quality assurance that is often
70
associated with the increased efficiency of the product [7].
71
The focus of this study is rapid identification of viable bacterial cell activity in a variety of
72
food sources using an optical sensor that monitors the change in fluorescence of resazurin dye.
73
Resazurin, which is blue and non-fluorescent, is reduced to resorufin, which is pink and highly
74
fluorescent [12]. Resazurin dye is commonly used to indicate cell viability, and was first used to
75
detect the presence of bacteria in spoiled milk by Pesch and Simmert in 1929 [12].
76
2. Materials and Methods
77
This study examined the presence of both beneficial and harmful bacteria in various food
78
samples. The tests were conducted under laboratory conditions using sterile equipment and aseptic
79
techniques. In order to estimate the activity of the bacteria, the results were compared to a 1000
80
cfu/mL of E.coli in lysogeny broth (LB) media. The samples were measured using a
81
fluorescence-based microfluidic device that was fabricated in-house [13,14]. The device automates
the detection of the change in fluorescence of resazurin dye in the presence of viable cells. The device
83
operation and sample preparation are briefly discussed below.
84
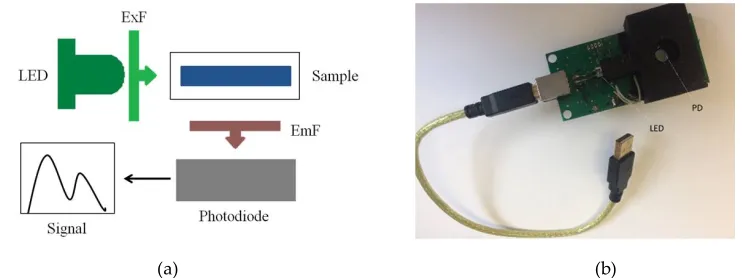
The kinetics fluorometer is a single-excitation, single emission photometer that can detect
85
and plot the change in fluorescence of a sample. The block schematics of the device are presented in
86
Figure 1(a). The green denotes the excitation light path (light source, filter, aperture, direction of the
87
excitation light), while the red denotes the emission light path. The excitation and emission light
88
paths are oriented perpendicularly to each other [13]. A prototype of the portable device is shown in
89
Figure 1(b).
90
91
(a) (b)
92
Figure 1. (a) Block schematic of the portable kinetic fluorometer, detailing the function of the device. (b)
93
Prototype of the device, labeled with the cassette holder, photodiode (PD), emission and extraction filters
94
(EmF and ExF).
95
The microfluidic cassette acts as a sample holder for the device. It is fabricated using three
96
poly (methyl methacrylate) (PMMA) sheets; one 1.5 mm in thickness, and two 0.2 mm thick. A laser
97
cutter is used to cut the 1.5 mm sheets, as well as to engrave the channels. The cassette channel is set
98
to hold 350 μL of a sample. The reading chamber was designed in a way that allows the most
99
efficient filling of the cassette when the sample is injected.
100
After the slides have been cut, each side is sanded for 5 seconds using wet, fine sandpaper.
101
Two holes are drilled into the side of the slide using a 1/32 carbide drill bit. Then they are coated
102
with 70% ethanol and bonded in a conventional oven. This process requires a vice clamp, two metal
103
plates, and two rubber sheets. One side of the cassette is bonded at a time, using the setup described
104
in Figure 2. The pressure from the clamp presses the acrylic sheets onto the slide, allowing them to
105
bond. The rubber sheets and metal plates serve to protect the slide and maintain constant application
106
of heat. The clamp setup is left in the oven for 4 minutes to allow the 0.2 mm sheet to bond to the
107
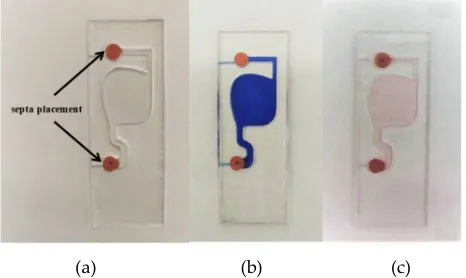
slide. After one side is finished, two rubber septa are placed in the cassette channel, as demonstrated
108
in Figure 3. After this, the other side of the cassette is bonded in the same way as the first.
109
Figure 2. The setup, within the vice clamp, that is placed in the oven. The rubber sheets protect the slide
111
from direct contact with the metal plates.
112
113
(a) (b) (c)
114
Figure 3. (a) An empty microfluidic cassette showing septa placement, (b) a cassette with a
115
non-fluorescent sample, (c) and a cassette with a fluorescent sample.
116
One traditional method of binding acrylic is utilizing high temperatures; however, coating
117
the acrylic in ethanol, then using heat and pressure, removes the internal stresses from the acrylic
118
slide and allow it to bond to two sheets of 0.2 mm acrylic at a lower temperature, forming the
119
microfluidic cassette [15]. PMMA cassettes enhance the accuracy of the device due to their optical
120
characteristics that ensure a high sensitivity to changes in fluorescence.
121
10 mg of resazurin dye powder was mixed with 1.0 mL of filtered water to create a master
122
mix in a 1.5 mL centrifuge tube. This mixture was then shaken to ensure a homogeneous solution.
123
This experiment tested several food samples for viable cells. Contaminated water, chicken,
124
and beef were tested for pathogenic bacteria. The presence of probiotics was tested in commercial
125
and homemade yogurt, kombucha tea, and two types of probiotic pills.
126
Three milliliters of creek water was spiked with 103 cfu/mL E.coli. The mixture was added to
127
47 mL of LB media. This mixture was then incubated at 37 °C in a shaker at 150 rpm for 2 hours. 1
128
mL of the resulting cell culture was mixed with 5.0 μL of resazurin dye. The meat samples were
129
tested in a similar way; 1 cm3 of each meat was dipped in 50 mL of respective media, and then
130
quickly removed. It was then incubated under the same conditions as the water sample. Lettuce
131
samples were tested by dropping one piece of lettuce in 50 mL of clean LB media, then incubating for
132
2 hours at 37oC and 150 rpm.
133
Both commercially produced and homemade yogurts were tested twice: once when they
134
were fresh and again one week later, after being left in a refrigerator. The yogurts, along with the
135
kombucha tea, were each tested using a standard set of procedures, shown in Figure 4. First, 3 mL of
136
the sample was added to 47 mL of LB media. This mixture was then incubated at 37 °C in a shaker at
137
150 rpm for 2 hours. 1 mL of the resulting cell culture was mixed with 5.0 μL of resazurin dye, 350
138
μL of which is injected into the microfluidic cassette and then tested for cell activity.
139
140
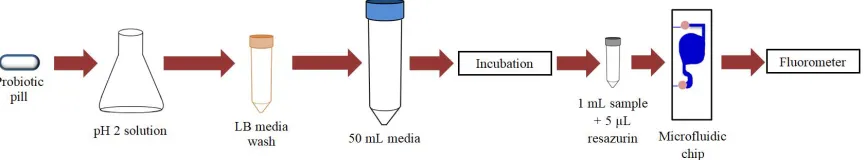
Additionally, two types of probiotic pills were tested: bifidobacillus and lactobacillus, both
142
of which have the same colony forming units per mL (cfu/mL). The bifidobacillus pills were added
143
to 50 mL of LB media, and then incubated at 37°C in a shaker at 150 rpm for 2 hours. 1 mL of the
144
resulting culture was then mixed with 5.0 μL of dye, and 350 μL was injected into the microfluidic
145
cassette. This process was repeated for a second trial. The lactobacillus pills were tested twice; one
146
trial was conducted the same way as the bifidobacillus. The lactobacillus pills were also tested after
147
going through stomach-like conditions, simulated by placing the pills in a solution of pH 2.0 until
148
they dissolved. The bacteria pellets were then washed with LB media five times to get rid of the
149
acidic solution, then placed in LB media and incubated according to the procedure previously
150
described. The full procedure is detailed in Figure 5.
151
152
Figure 5. Flowchart detailing the process used to test probiotic pills after exposure to a stomach-like
153
environment.
154
After the samples were prepared and mixed with resazurin dye, they were injected into the
155
microfluidic cassette. Once the cassette was inserted into the device, the control program was
156
initiated. The program continuously measured and displayed the fluorescence intensity every three
157
seconds. The control program also calculated the running value of the slope of the fluorescence
158
intensity change. A linear relationship exists between the amount of bacterial activity in a sample
159
and the change in fluorescence of resazurin dye; therefore, the steeper the slope, the more active
160
bacteria the sample contains.
161
3. Results
162
The metabolic activity of the various samples was evaluated in duplicates. Negative controls
163
were used for each individual sample. The contaminated water was compared against water filtered
164
through 0.2 micron filter, the yogurts against milk, the kombucha against filtered kombucha (black
165
tea), and the media containing probiotic pills against plain media. Both meats were tested multiple
166
times over a several-day time period, with fresh raw beef/chicken used as a negative control. Lettuce
167
was tested after being left in a sealed refrigerated bag for 2 weeks, and was compared to fresh
168
lettuce. All tests were performed at room temperature for 5 minutes and the activity was compared
169
to a 1000 cfu/mL concentration of E.coli in media. Figure 6 demonstrates the dynamics of the test.
171
Figure 6. A hypothetical test run demonstrating the difference between sterile media and media
172
containing bacteria. Contaminated media should result in a positively sloped line, while sterile media
173
should have a slope of near-zero.
174
3.1. Pathogen Results
175
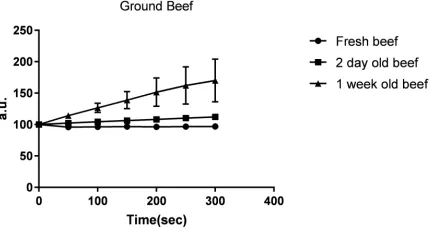
Ground beef and chicken, both raw, were tested and compared to their negative controls.
176
The ground beef was tested three times: once fresh, again after being left at room temperature for 2
177
days, and finally after 7 days at room temperature. As shown in Figure 7, the fluorescence intensity
178
increased significantly on Day 2 and Day 7 when compared to the low change in fluorescence of the
179
negative control (fresh beef).
180
181
Figure 7. The fluorescence intensity (a.u.) of beef at different time intervals.
182
The chicken was tested twice: once fresh, to act as the negative control, and again two days
183
later, after having been left at room temperature. The fluorescence intensity increased when the
184
chicken was measured on the second day; the difference in the change in fluorescence intensity
185
between these two samples is indicated in Figure 8.
186
187
Figure 8. The fluorescence intensity (a.u.) over time of spoiled chicken as compared to raw chicken.
188
Contaminated lettuce was also tested; lettuce was left in a sealed plastic bag in a refrigerator
189
for 2 week, then the bacteria was cultured and tested. This lettuce was compared to a fresh piece of
lettuce. The spoiled lettuce displayed much more bacterial activity than the fresh lettuce. Figure 9
191
displays the changes in fluorescence of both samples.
192
193
Figure 9. The fluorescence intensity (a.u.) over time of spoiled lettuce was compared to fresh lettuce.
194
Contaminated creek water was also tested, against filtered water. As expected, the
195
contaminated water displayed much more bacterial activity than the filtered water, which displayed
196
almost no activity. Figure 10 compares the slopes of fluorescence change of the two samples.
197
198
Figure 10. The fluorescence intensity (a.u.) of contaminated creek water over time compared to that of
199
filtered water.
200
3.2. Probiotic Results
201
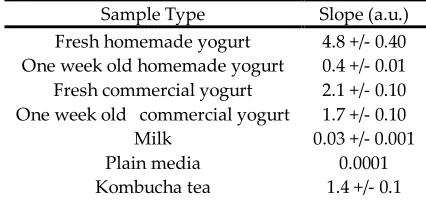
Kombucha tea, homemade yogurt, and commercial yogurt were tested and compared to
202
each other; the resulting slopes of the change in fluorescence for each test are shown in Table 1.
203
Different yogurts vary in activity levels because they have distinctive recipes that lead to the use of
204
different strains. Although most commercial yogurts are enhanced with probiotics, the commercial
205
yogurt tested initially displayed less activity when compared to the homemade yogurt, with slopes
206
of 2.1 and 4.8, respectively. One week later, however, the homemade yogurt dropped in activity
207
while the commercial yogurt did not display this same decrease in activity; the slopes decreased by
208
4.4 and 0.4, respectively.
209
Table 1. All tested probiotic sources and the slope of the resulting absorbance values, representative of the
210
activity of the probiotic.
211
Sample Type Slope (a.u.) Fresh homemade yogurt 4.8 +/- 0.40 One week old homemade yogurt 0.4 +/- 0.01 Fresh commercial yogurt 2.1 +/- 0.10 One week old commercial yogurt 1.7 +/- 0.10
Milk 0.03 +/- 0.001
Plain media 0.0001
Filtered Kombucha tea 1.0 +/- 0.1
Plain media 0.0001
103 cfu/mL E. coli (control) 0.2 +/- 0.01
Similarly, kombucha tea also showed high cell activity, with a slope of 1.4. Upon testing the
212
filtered kombucha (black tea), it was noticed that the tea behaved similarly to a contaminated
213
sample. Kombucha tea is made by adding what is commonly referred to as a SCOBY, a symbiotic
214
culture of bacteria and yeast, to green or black tea. The bacteria and yeast both aid in the
215
fermentation of the tea, and some of the added bacteria are similar to the probiotics found in
216
yogurts, although they are not as prevalent in the tea [16]. Table 1 shows the activity of the probiotics
217
in various food sources, represented by their slopes.
218
In addition to yogurt and kombucha tea, probiotic pills of different strains were tested
219
against each other in different concentrations. In order to demonstrate the device sensitivity, the
220
probiotic pills samples were diluted. Table 2 shows the different concentrations of bifidobacillus and
221
lactobacillus pills and their corresponding slopes. It was shown that bifidobacillus was more active
222
than lactobacillus. Differences in initial bacterial concentration, bacterial generation time, or
223
environmental tolerance could all have contributed to this distinction. The fluorometer clearly
224
distinguished between the two different probiotics, as well as the different concentrations. The
225
largest standard error was 0.5, calculated for a 25% concentration of lactobacillus.
226
Table 2. Various concentrations of probiotic pills, and the corresponding slopes of the absorbance values.
227
Slope (a.u.) Percent Concentration (%) Bifidobacillus Lactobacillus
50 2.1 +/- 0.11 1.4 +/- 0.2
25 1.5 +/- 0.06 1.0 +/- 0.5
12.5 1.0 +/- 0.02 0.4 +/- 0.0
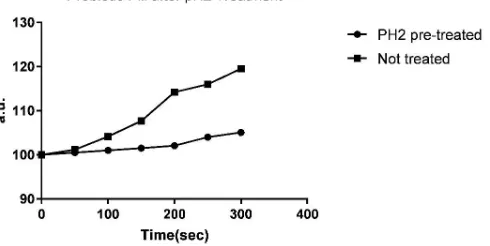
The lactobacillus probiotic pills were also tested after being pre-treated in a pH 2
228
environment. This was done to simulate the activity of the probiotic after passing through
229
stomach-like conditions. Figure 11 shows the results of this trial; the pH pre-treated probiotic
230
exhibited much less cell activity than its non-treated counterpart.
231
232
Figure 11. The fluorescence intensity (a.u.) of probiotic pills over time. One trial was performed after the
233
pill was exposed to an acidic environment, to simulate stomach-like conditions.
234
4. Discussion
235
The optical biosensor was indeed able to detect the presence of both pathogenic and
236
probiotic bacteria. Between each test for pathogenic bacteria, both the beef and chicken were stored
237
at room temperature; bacteria is known to grow most rapidly between 40°F and 140°F, therefore it is
238
expected that the amount of bacteria in the sample would continue to increase as time progressed
[17]. The results obtained from the kinetic fluorometer support this statement. The fresh beef, which
240
served as a negative control, showed no bacterial activity. When tested seven days later, however,
241
the fluorescence had increased significantly, indicating an increase in bacterial activity. This
242
principle also holds true for chicken: when tested two days later, the fluorescence of the chicken had
243
increased much more than that of the fresh, raw chicken.
244
The results of the probiotic testing give insight into the cell activity in probiotic-heavy foods
245
such as yogurt and kombucha. Some commercial yogurts are subjected to heat treatment, a process
246
meant to prolong shelf life that also kills most of the live cultures that were used to produce the
247
yogurt. Yogurts that bear the “Live and Active Culture” seal, such as the yogurt that was tested in
248
this study, must contain 100 million cultures per gram when the yogurt is manufactured, a standard
249
set by the National Yogurt Association [18]. However, there is no set way to determine how much
250
bacteria is present in homemade yogurt, because the amount of starter culture used is variable.
251
Additionally, most homemade yogurts are not heat-treated after fermentation because they do not
252
need to have a very long shelf life.
253
Commercially produced yogurt maintained a steadier level of bacterial activity, most likely
254
because of the additional steps in the manufacturing process that retain bacterial cultures or provide
255
a more suitable environment for their preservation. This phenomenon could be further expanded
256
upon by testing various types of commercially produced yogurt, some heat-treated, as well as
257
homemade yogurts with different concentrations of starter cultures. Further testing may elucidate
258
the reasons behind commercial yogurt’s apparent ability to sustain probiotic cultures more
259
efficiently than homemade yogurt.
260
Testing kombucha tea for bacterial activity revealed a less-than-expected difference between
261
kombucha, which contains probiotics, and regular black tea. This indicates that the mechanisms of
262
the sensor may not have accounted for interference due to caffeine or other compounds present in
263
regular tea.
264
When the probiotic pills were tested, both pills displayed high levels of bacterial viability.
265
Additionally, testing the pill after exposure to a strongly acidic environment resulted in a large
266
decrease in activity. The pH range for optimal lactic acid bacteria activity, including lactobacillus
267
activity, is 6.3-6.9 [19], and very acidic environments have been shown to greatly impact the viability
268
of these bacteria [20]. This indicates that the passing of probiotic bacteria, unprotected, through the
269
stomach would significantly reduce the activity of the bacteria.
270
5. Conclusions
271
In this study, we showed that our approach allows for field detection of the presence of
272
bacteria, either probiotic or pathogenic, in various food products based on viable cell activity. To
273
study the bacterial activity, the fluorescence change in resazurin dye over time was examined by a
274
portable microfluidic based kinetics fluorometer. The use of a portable biosensor such as the one
275
described in this study would be beneficial in the food industry, as an on-site rapid way to test the
276
quality and safety of food products.
277
278
Author Contributions: Conceptualization, Yordan Kostov, Govind Rao, and Mustafa Al-Adhami.;
279
methodology, Mustafa Al-Adhami.; validation, Mustafa Al-Adhami, Marisa Patsy, Elizabeth Tan, and Dina
280
El-Oseily.; formal analysis, Mustafa Al-Adhami and Yordan Kostov.; investigation, Mustafa Al-Adhami.;
281
writing—original draft preparation, Mustafa Al-Adhami and Marisa Patsy.; writing—review and editing,
283
Yordan Kostov.; visualization, Mustafa Al-Adhami.; supervision, Yordan Kostov.; project administration,
284
Yordan Kostov and Govind Rao.; funding acquisition, Yordan Kostov.
285
Funding: This research was funded by DARPA, Biologically-derived Medicines on Demand (Bio-Mod) Project
286
Grant N66001-13-C-4023 and FDA Grant 1U01FD004275.
287
Acknowledgments: We thank David Burgenson and Dr. Abhay Andar for their assistance and technical
288
support through the course of this project.
289
Conflicts of Interest: The authors declare no conflict of interest. The funders had no role in the design of the
290
study; in the collection, analyses, or interpretation of data; in the writing of the manuscript, or in the decision to
291
publish the results.
292
References
293
1. Phillips K. Five dead, nearly 200 sick in E. coli outbreak from lettuce. And investigators are
294
stumped. The Washington Post.
295
https://www.washingtonpost.com/news/to-your-health/wp/2018/06/02/five-dead-nearly-200-sic
296
k-in-e-coli-outbreak-from-lettuce-and-investigators-are-stumped/?noredirect=on&utm_term=.a
297
6bc6dad3049. Published June 2, 2018. Accessed June 5, 2018.
298
2. Manfreda G, De Cesare A. Novel food trends and climate changes: impact on emerging
299
food-borne bacterial pathogens. Current Opinion in Food Science. 2016;8:99-103.
300
https://doi.org/10.1016/j.cofs.2016.04.007. Accessed June 6, 2018.
301
3. Chajecka-Wierzchowska W, Zadernowska A, Nalepa B, Sierpinska M, Laniewska-Trokenheim
302
L. Retail ready-to-eat food as a potential vehicle for staphylococcus spp. harboring antibiotic
303
resistance genes. J Food Prot. 2014;77(6):993-8.
304
https://search.proquest.com/docview/1534514750?accountid=14696.
305
4. Pothakos V, Stellato G, Ercolini D, Devlieghere F. Processing Environment and Ingredients Are
306
Both Sources of Leuconostoc gelidum, Which Emerges as a Major Spoiler in Ready-To-Eat
307
Meals. Applied and Environmental Microbiology. 2015;81(10):3529-3541. doi:10.1128/aem.03941-14.
308
5. Sanders ME, Levy DD. The science and regulations of probiotic food and supplement product
309
labeling. Annals of the New York Academy of Sciences. 2011;1219.
310
doi:10.1111/j.1749-6632.2010.05956.x.
311
6. Andjelković U, Šrajer Gajdošik M, Gašo-Sokač D, Martinović T, Josić D. Foodomics and Food
312
Safety: Where We Are. Food Technology and Biotechnology. 2017;55(3):290-307.
313
doi:10.17113/ftb.55.03.17.5044.
314
7. Law JW-F, Ab Mutalib N-S, Chan K-G, Lee L-H. Rapid methods for the detection of foodborne
315
bacterial pathogens: principles, applications, advantages and limitations. Frontiers in
316
Microbiology. 2014;5:770. doi:10.3389/fmicb.2014.00770.
317
8. Mandal PK, Biswas AK, Choi K, Pal UK. Methods for Rapid Detection of Foodborne Pathogens:
318
An Overview. American Journal of Food Technology. 2011:87-102. doi:10.3923/ajft.2011.87.102.
319
9. Lipman NS, Jackson LR, Trudel LJ, Weis-Garcia F. Monoclonal Versus Polyclonal Antibodies:
320
Distinguishing Characteristics, Applications, and Information Resources. ILAR Journal.
321
2005;46(3):258-268. doi:10.1093/ilar.46.3.258.
322
10. Hashemi E, Forouzandeh M. Designing a new biosensor “DNA ELISA” to detect Escherichia coli
323
using genomic DNA and comparison of this method to PCR-ELISA. Journal of Enzyme Inhibition
324
& Medicinal Chemistry [serial online]. January 2018;33(1):722-725. Available from: Academic
325
Search Complete, Ipswich, MA. Accessed June 5, 2018.
11. Ivnitski D, Abdel-Hamid I, Atanasov P, Wilkins E. Biosensors for detection of pathogenic
327
bacteria. Biosensors and Bioelectronics. 1999;14(7):599-624.
328
https://doi.org/10.1016/S0956-5663(99)00039-1. Accessed June 6, 2018.
329
12. Rampersad SN. Multiple Applications of Alamar Blue as an Indicator of Metabolic Function and
330
Cellular Health in Cell Viability Bioassays. Sensors. 2012;12(9):12347-12360.
331
doi:10.3390/s120912347.
332
13. Al-Adhami M, Tan E, Rao G, Kostov Y. A highly sensitive microfluidic device for bacterial
333
detection in blood serum. 2017 IEEE Healthcare Innovations and Point of Care Technologies
334
(HI-POCT). 2017. doi:10.1109/hic.2017.8227601.
335
14. Al-Adhami M., Tilahun D., Rao G., Gurramkonda C., Kostov Y. (2017) Rapid Detection of
336
Microbial Contamination Using a Microfluidic Device. In: Rasooly A., Prickril B. (eds)
337
Biosensors and Biodetection. Methods in Molecular Biology, vol 1571. Humana Press, New
338
York, NY
339
15. Tsao C-W, Devoe DL. Bonding of thermoplastic polymer microfluidics. Microfluidics and
340
Nanofluidics. 2008;6(1):1-16. doi:10.1007/s10404-008-0361-x.
341
16. Villarreal-Soto SA, Beaufort S, Bouajila J, Souchard J-P, Taillandier P. Understanding Kombucha
342
Tea Fermentation: A Review. Journal of Food Science. 2018;83(3):580-588.
343
doi:10.1111/1750-3841.14068
344
17. United States Department of Agriculture Food Safety and Inspection Service. How Temperature
345
Affects Food. Available online: https://www.fsis.usda.gov/shared/PDF/How_
346
Temperatures_Affect_Food.pdf. Accessed June 7, 2018.
347
18. Live & Active Culture Yogurt. Available online: http://www.aboutyogurt.com/live- culture.
348
Accessed June 8, 2018.
349
19. Bibal B, Goma G, Vayssier Y, Pareilleux A. Influence of pH, lactose and lactic acid on the growth
350
of Streptococcus cremoris: a kinetic study. Applied Microbiology and Biotechnology.
351
1988;28(4-5):340-344. doi:10.1007/bf00268192.
352
20. Hassanzadazar H, Ehsani A, Mardani K, Hesari J. Investigation of antibacterial, acid and bile
353
tolerance properties of lactobacilli isolated from Koozeh cheese. Veterinary Research Forum.
354
2012;3(3):181-185.