ISSN 2348 – 7968
The Diagnosis of Heart Diseases Based on PCG Signals using MFCC
Coefficients and SVM Classifier
Behnam Farzam1, Jalil Shirazi2
1
Electrical Engineering Department, Khavaran Institute for Higher Education, Mashhad, Iran
2
Assistant Professor, Electrical Engineering Department, Islamic Azad University, Gonabad branch Gonabad, Iran
Abstract
During the present paper a number of cardiovascular patients were classified using features of cepstral coefficients based on national standards. Heart sounds include a healthy heart and fourth unhealthy heart, The data used in this paper was obtained from Michigan university website. After the separation of the heart murmurs from each heart sound, the cepstral coefficients based on Mel scale for each class was calculated as feature vectors and method support vector machine was used for the classification of the diseases. The diagnostic accuracy was %100. The results indicated the accuracy, reliability, and high performance capacity in method design.
Keywords: Heart, Cepstral, Murmur, SVM, MFCC
1. Introduction
The ECG1 record which is the result of heart function has always been a favorite none-aggressive and at the same time safe and fast approach for the diagnosis of the heart status and its diseases over the past years. The PCG2 signal also includes some data with regard to the function of the heart and they are the result of mechanical vibrations. The sounds of the heart are made by the heart valves and also the murmurs. Therefore, useful information about the situation of the valves, the types of the diseases or the possible openings in the walls of the ventricle and vestibule can be obtained thanks to the process of PCG signal. The discovery of the signals of the heart and their analysis has always been interesting for the cardiologists. The main issue in processing of these signals is the discovery of vital components, the recognition of abnormal rhythms and the improvement of efficacy of signal recognition. The importance of the statement of the problem and the type of the problems in processing of such signals has intrigued not only the physicians, engineers but also the technicians of signal processing. Stethoscope is a
1
- Electrocardiogram
2
- phonocardiogram
ISSN 2348 – 7968
beats were applied to the heart beat, procedures that express time and frequency information simultaneously drew the attention of the scholars. Adaptive tracking method is an appropriate technique for the analysis of none stationary signals especially the signals whose nature is changed over time. This method was firstly by Mallat [8] and was applied on the heart beat signals by Zhang [9]. He used Gabor basis functions to describe the heart signal. Cepstrum three methods of feature extraction, range feature, and features based on the basis of wavelet and three classifier method KNN1, MLP2 and SVM3 in 2009 [10], the discrete wavelet transform feature extraction method (DWT4), and four types of neurological networks including MLP, BPA5, ENN6and RBF7 in 2010[11], feature extraction method MFCC, and Euclidean distance classification method in 2010 [12], Wavelet methods and SVM Classifier in 2012 [13], cepstral factors based on Mel Criteria (MFCC8 in 2013, the GMM9 method and HMM10[14] category methods in 2013, and a number of hidden Markov models (Bayes Network, simple Bayes [15], and some other categories, were used for the diagnosis of heart diseases.
The purpose behind the present research is to introduce a method which categorizes the heart disease automatically with high precision and validity. Here, a new method has been proposed for the classification of heart disease based on cepstral coefficient and based on Mel criteria using Support Vector Machine classifier. Later, the necessary theories were analyzed and some conclusions were made in chapter three. In chapter four, the obtained results were presented and the conclusion was done in chapter five.
2. Method
The data used in this paper was obtained from Michigan university website. In this group, four sets of heart sound regarding the various parts of auditory are presented. Fig 1 shows where heart beat can be heard on four points better.
1
- k-nearest neighbors
2
- Multilayer perceptron
3
- Support vector machine
4
- Discrete Wavelet Transform
5
- Back Propagation Algorithm
6
- Elman Neural Network
7
- Radial Basis Function
8
- Mel-frequency cepstral coefficients
9
- Gaussian mixture model
10
- Hidden Markov model
Fig. 1 Positions of maximal auscultation[16]
In this paper, we used Mitral valve sounds stored in the apex region including the sounds of a healthy heart and four sounds of the heart along with heart murmur. Fig 2 shows the mitral acute heart failure.
Fig. 2 Systolic murmur in the early stages [1].
Fig 3 shows the mitral acute heart failure with regard to Coronary Artery Disease.
Fig. 3 Systolic murmur in the middle stage [1].
Fig 4 shows the Mitral valve prolapsed with mitral regurgitation due to heart disease.
ISSN 2348 – 7968
Fig 5 shows the classic mitral insufficiency or deficiency of the ventricular wall.
Fig. 5 Systolic murmur is heard at all levels [1].
2.1 Isolating heart beats
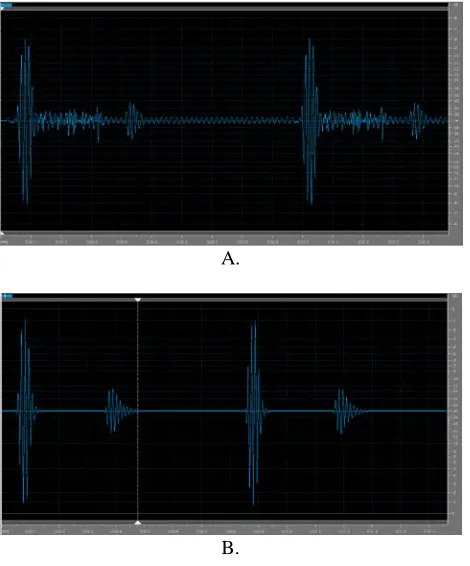
The isolation of murmurs from the first sound and second sounds of the heart was done using AVS Audio Auditor. Fig 6 shows heart beat signal before and after the murmurs separation.
A.
B.
C.
Fig. 6 the isolation of murmurs: A. The heart beat with murmurs, B. The heart beat without murmurs, C. Murmurs isolated from the heart sound.
We isolated about 60 beats from each patients’ heart beat.
2.2 extraction MFCC coefficients
The flowchart of MFCC coefficient extraction is shown in fig 7. The main idea in Cepstrumcoefficients was based on the Mel criteria and derived from the properties of the human auditory perception and speech intelligibility. The function of the human auditory system is a way that its perception frequency is different from the real sound frequencies[17].
Fig.7 Steps to computation of MFCC coefficients[17].
A single Mel is perceived as a measure of the pitch and does not depend linearly on the frequency step since the human ear is function as this frequency is not perceived as the same physical size.
The following formula shows the relationship between the two frequencies.
(1) )
700 F + (1 log 2595 =
Fmel 10 HZ
sp
eec
h
MF
ISSN 2348 – 7968
The stages to MFCC coefficient extraction is shown in fig.7 and based on this fact in feature extraction method MFCC, the following stages are followed. First of all, the Fourier spectrum of the window is obtained using the Fourier Change and the domain is calculated. Later on, the filter bank is placed on the obtained spectrum logarithmically and based on formula no 1. Fig. 8 shows the distribution of filter types.
Fig.8 The distribution of filters [17].
The number of these filters are varied. As shown in figure 8, the wideband of the filters is higher in higher frequencies. It means that the human ear sensitivity is relatively lower with the frequency changes in high frequencies than the low frequencies. After placing the filter on the signal spectrum, the filters output is calculated. To extract the heart sound features, firstly the sound of each class is framed. Each frame shows relatively stationary behavior. For each class, 13 features were extracted.
2.3
Theory of support vector machine (SVM)
After the extraction of process feature, support vector machine was used to classify the data. For the first time, SVM was proposed as an effective classification and diagnosis of the patterns by Vapnik [3]. Support vector machine is in fact a Two-class classifier in which the classes are divided by the use of a linear boundary. In this method, Support vector samples are called the closest to the decision boundary. These vectors define the decision boundary equation. To simplify the concept of theory of support vector machine, the simplest possible option for the classification called two-class classification in the case of linearly separable is used [18]. In this method it is assumed that the samples hold yi =
{
−1,+1}
label. Each sample is shown as a vector. The maximum margin method is used to find the optimal decision boundary. So, the decision boundary in addition to all instances of both classes should not only properly divide all the samples into two categories, but also it should find the decisionboundary (hyper page) which has the distant range from all support vectors. The mathematical expression of the decision boundary in vector space can be expressed as the following equation:
(2) f(x)=sgn(w.x+b)
Where wthe normal vector of the hyper plane and b is the intercept [19]. As before, the decision making boundary should accurately classify the samples as the following equation:
(3) yi
(
w.x+b)
≥1On the other hand, the boundary of decision making should have the most distance from the samples of each class as according to fig 9 means the maximizing
w
2
[19].
Fig.9 Hyper plane separation [19].
Therefore, we can define an optimization problem as follows:
(4) 2
2 1
min w
(5) s.t.yi
(
w.xi+b)
≥1To solve the problem of optimizing, the method of Lagrange multipliers is used. So the question is of the relation (6) which is the Lagrange multipliers.
(6)
( )
[ ]
∑
∑
=
≥ =
= ≥ ⇒
− + −
n
i i i
i
a n
i i i i
b w
y t s
b x w y w
1
0 1 2 ,
0 0 . .
1 . 2
1 max min
α α
ISSN 2348 – 7968
Later on, this form (called the original form is changed into the dual form with the placement Lagrangian derivatives with regard to the original variables Lagrangian. By solving the optimization problem of the form of the twin, the Lagrange multipliers values are obtained. Karosh-Kuhen-Talker state that the optimal value is shown as the following equation:
(7)
∑
=
= n
i ixiyi
w
1α
Moreover, it is easily proved that the value of b is calculated through equation 8:
(8)
∑
= −
= n
i i i
sv x w y N b 1 . 1
Here Nsv is the number of support vectors. At the end, decision making function is stated as follows:
(9) f(x)=sgn(w.x+b)
3. Results
During the present research project, HR 300 for a healthy heart ,class 1, and four diseases including acute mitral regurgitation ,class 2, disease due to coronary artery disease, mitral regurgitation ,class 3, Mitral valve prolapsed with mitral regurgitation ,Class 4, classic mitral insufficiency or deficiency of the ventricular wall ,Class 5, were examined .First of all, the hear sound was tabulated. To this end, the frames were overlapped in order to maintain the smoothness and continuity between the frames. We considered the frame length of 25 ms and a frame shift of 15 ms.
After the signal is divided into frames, each frame is multiplied by windows to reduce the spectrum energy loss. Hamming window was used to minimize the spectral distortion. The sound of each heart (class) was divided into 1500 frames from which 1050 were used for teaching and 450 frames were used for testing. In other words, in this simulation %70 of the data was used for teaching and %30 of data was used for testing. The SVM classifier with one- versus -all method was used for the classification. The results of the classifications of phase one is shown in tables 1 and 2.
Table 1: Margin specifications
Class 5 Class 4 Class 3 Class 2 Class 1 0 0 0 4 446 Class 1 0 1 0 442 7 Class 2 8 7 423 0 1 Class 3 21 424 1 1 3 Class 4 428 14 2 0 6 Class 5
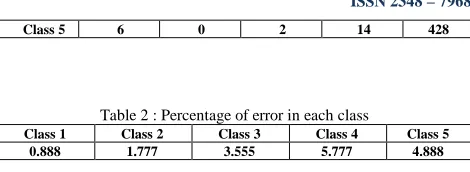
Table 2 : Percentage of error in each class
Class 5 Class 4 Class 3 Class 2 Class 1 4.888 5.777 3.555 1.777 0.888
From among 450 healthy heart sounds about 446 frames were diagnosed correctly and 4 frames wrongly which indicates the diagnostic accuracy of %99.12. From among 450 frames of heart sounds with acute mitral regurgitation disease, 434 frames were diagnosed correctly and 16 frames were diagnosed wrongly which show the diagnostic accuracy of %96.445. From among heart sounds with Mitral valve prolapsed with mitral disease, 424 frames were diagnosed correctly and 26 frames were diagnosed wrongly which shows the diagnostic accuracy of %94.223. From among 450 heart sounds with classic mitral regurgitation or ventricular defect, 428 frames were diagnosed correctly and 22 frames were diagnosed wrongly which shows the diagnostic accuracy of %95.112. The test error was %3.377, and the diagnostic accuracy of the test was %96.623. During the second phase of the project, using the majority of the vote method each 28 frame was considered for each heart beat. The length of systole in each heart beat was 280 ms and the length of each frame was 10ms. Therefore, we considered 28 frame as one beat. The majority of the vote method for each hear beat was equal or more that the 28 classified frames. For each heart sound about 53 beats were extracted form which 37 beats were used for test and 16 for teaching. After the second phase of classification using the majority vote, all beats were diagnosed correctly. It means that each 16- beat of any class were diagnosed correctly. Final results were shown in tables 3 and 4. Validity of this study was equal to 100 %. The results obtained from this study and its comparison with the results obtained in previous studies showed the high diagnosis precision and its high accuracy. The comparison of the results is shown in Table 5.
Table 4 : Disturbance 5 class confusion matrix of heart sounds using majority vote. Class 5 Class 4 Class 3 Class 2 Class 1 0 0 0 0 16 Class 1 0 0 0 16 0 Class 2 0 0 16 0 0 Class 3 0 16 0 0 0 Class 4 16 0 0 0 0 Class 5
Table 5. The accuracy diagnosis of each disease using majority vote method General Diagnosis Accuracy Class 5 Class 4 Class 3 Class 2 Class 1 100% 100% 100% 100% 100% 100%
ISSN 2348 – 7968 Diagnosis
accuracy Classifier
Feature extraction No of
classes Study year
59.44% PNN
TMS 35
2002
73.0% KNN
Spectral
3
2009 Wavelet- MLP 86.4%
based
95.2% SVM
Cepsteral
77.53% MLP
The discrete wavelet transform 7
2010
83.71% BPA
86.56% ENN
81.30% RBF
92.5% Euclidean
distance MFCC
6 2010
93% SVM
Wavelet transform 2
2012
84.96% GMM
MFCC & HMM 6
2013
91.666% Bayes Net
Time & Frequency
domain 2
2013
93.333% Naïve Bayse
91.666% SGD
88.333% Logit Boost
96.623%
SVM MFCC
5 Previous
studies
100%
4. Conclusion
During the present paper, the classification of 5 healthy heart, the sounds of a healthy heart and 4 unhealthy heart sounds with heart murmurs were examined. To diagnose the heart murmurs from the sounds made by heart Mel-frequency cepstrum were used for the extraction of the features and the SVM classifiers were applied using one-versus-all for the classification of the murmurs. Results show a general error of %3.377and the diagnosis precision of %96.623 in the first phase and the general; error of 0% and the diagnosis accuracy of %100 for the final phase. Comparing the results of this study with the previous studies showed that the present study posses a high degree of accuracy.
References
[1] http://www.med.umich.edu/lrc/psb/heartsounds/
[2] Yoganathan, A.P.sarma, R.Johnson, "Use of the fast Furier transform for frequency analysis of the first heart sound in normal man," Med. Biol. Eng. 14, 69, 1976.
[3] Yoganathan, A.P. Gupta, R. Udwadia, F.E. Sarmsa, "Use of the fast Fourier transform in the frequency analysis of the second heart sound in normal man," Med. Biol. Eng. Comput, 1976.
[4] Rangraj M. Rangayyan, Richard J. Lehner, Louis-Gilles Durand, "Phonocardiogram signal analysis: A Review," IEEE Biomedical Engineering, 1988.
[5] P.M Bentley J.T.E Mchonnell, "anylysis of heart sound using the wavelet Transform," IEEE, 1994.
[6] M.F. Shen, L.S. Sun, "Modeling and processing Via parametric Bispectral Approach," Proceeding RC IEEE-EMBS 14th BMESI, 1995.
[7] M. Shen, L. sun, "The analysis and classification of phonocardiogram based on Higher-order spectrum," IEEE Trans, Signal Proc, 1993.
[8] S.G.Mallt and Z. Zang, "Matching pursuits with time-frequancy dictionaries", IEEE Trans, Signal Proc, 1993. [9] X. Zhang, L.G. Durand, "Analysis-Synthesis of the
phonocardiogram based on the Matching Pursuit methods," IEEE Trans. Bio. Eng, 1998.
[10] Jithendra Vepa," Classification of heart murmurs using cepstral features and support vector machines" IEEE, 2009.
[11] Wenjie Fu, Xinghai Yang, Yutai Wang "Heart Sound Diagnosis Based on DTW and MFCC" International Congress on Image and Signal Processing, 2010.
[12] Omid mokhlessi, Hojat Moayedi Rad, "Utilization of 4 types of Artificial Neural Network on the diagnosis of valve-physiological heart disease from heart sounds" Iranian Conference of Biomedical Engineering, 2010. [13] Jian-bo Wu, Su Zhou, "Research on the Method of
Characteristic Extraction and Classification of Phonocardiogram", International Conference on Systems and Informatics, 2012.
[14] Sh- Hussain, Salleh, I. Kamarulafizam," Classification of Heart Sound Based on Multipoint Auscultation System", International Workshop on Systems, Signal Processing and their Applications, 2013.
[15] Mandeep Singh, Amandeep Cheema, "Heart Sounds Classification using Feature Extraction of Phonocardiography Signal", International Journal of Computer Applications, Volume 77– No.4,2013.
[16] http://www.sharinginhealth.ca/clinical_assessment/heart_s ounds.html
[17] Huang,X. Acero, A. Hon, "Spoken Language Processing," Prentice Hall, 2001.
[18] Hamel, L., "Knowledge Discovery with Support Vector Machines," Hoboken, N.J. John Wiley, 2009.
![Fig. 1 Positions of maximal auscultation[16]](https://thumb-us.123doks.com/thumbv2/123dok_us/7823897.1296358/2.612.350.513.75.243/fig-positions-of-maximal-auscultation.webp)