Predicting the Level of Text Standardness in User-generated Content
Nikola Ljubeši´c∗‡Darja Fišer†Tomaž Erjavec∗Jaka ˇCibej† Dafne Marko†Senja Pollak∗ Iza Škrjanec†
∗Dept. of Knowledge Technologies, Jožef Stefan Institute
†Dept. of Translation studies, Faculty of Arts, University of Ljubljana
‡Dept. of Inf. Sciences, Faculty of Humanities and Social Sciences, University of Zagreb
Abstract
Non-standard language as it appears in user-generated content has recently at-tracted much attention. This paper pro-poses that non-standardness comes in two basic varieties, technical and linguistic, and develops a machine-learning method to discriminate between standard and non-standard texts in these two dimensions. We describe the manual annotation of a dataset of Slovene user-generated content and the features used to build our re-gression models. We evaluate and dis-cuss the results, where the mean abso-lute error of the best performing method on a three-point scale is 0.38 for tech-nical and 0.42 for linguistic standard-ness prediction. Even when using no language-dependent information sources, our predictor still outperforms an OOV-ratio baseline by a wide margin. In addi-tion, we show that very little manually an-notated training data is required to perform good prediction. Predicting standardness can help decide when to attempt to nor-malise the data to achieve better annota-tion results with standard tools, and pro-vide linguists who are interested in non-standard language with a simple way of selecting only such texts for their research.
1 Introduction
User-generated content (UGC) is becoming an in-creasingly frequent and important source of
hu-man knowledge and people’s opinions (Crystal, 2011). Language use in social media is char-acterised by special technical and social circum-stances, and as such deviates from the norm of traditional text production. Researching the lan-guage of social media is not only of great value to (socio)linguists, but also beneficial for improving automatic processing of UGC, which has proven to be quite difficult (Sproat, 2001). Consistent de-creases in performance on noisy texts have been recorded in the entire text processing chain, from PoS-tagging, where the state-of-the-art Stanford tagger achieves 97% accuracy on Wall Street Jour-nal texts, but only 85% accuracy on Twitter data (Gimpel et al., 2011), to parsing, where double-digit decreases in accuracy have been recorded for 4 state-of-the-art parsers on social media texts (Petrov and McDonald, 2012).
Non-standard linguistic features have been analysed both qualitatively and quantitatively (Eisenstein, 2013; Hu et al., 2013; Baldwin et al., 2013) and they have been taken into account in automatic text processing applications, which ei-ther strive to normalise non-standard features be-fore submitting them to standard text processing tools (Han et al., 2012), adapt standard process-ing tools to work on non-standard data (Gimpel et al., 2011) or, in task-oriented applications, use a series of simple pre-processing steps to tackle the most frequent UGC-specific phenomena (Foster et al., 2011).
However, to the best of our knowledge, the level of (non-)standardness of UGC has not yet been measured to improve the corpus pre-processing pipeline or added to the corpus as an annotation
layer in comprehensive corpus-linguistic analy-ses. In this paper, we present an experiment in which we manually annotated and analysed the (non-)standardness level of Slovene tweets, forum messages and news comments. The findings were then used to train a regression model that auto-matically predicts the level of text standardness in the entire corpus. We believe this information will be highly useful in linguistic analyses as well as in all stages of text processing, from more ac-curate sampling to build representative corpora to choosing the best tools for processing the collected documents, either with tools trained on standard language or with tools specially adapted for non-standard language varieties.
The paper is organised as follows. Section 2 presents the dataset. Section 3 introduces the fea-tures used in subsequent experiments, while Sec-tion 4 describes the actual experiments and their results, with an emphasis on feature evaluation, the gain when using external resources, and an analysis of the performance on specific subcor-pora. The paper concludes with a discussion of the results and plans for future work.
2 The Dataset
This section presents the dataset used in subse-quent experiments, starting with our corpus of user-generated Slovene and the sampling used to extract the dataset for manual annotation. We then explain the motivation behind having two dimen-sions of standardness, and describe the process of manual dataset annotation.
2.1 The Corpus of User-generated Slovene
The dataset for the reported experiments is taken from our corpus of user-generated Slovene, which currently contains three types of text: tweets, fo-rum posts, and news site comments. The complete corpus contains just over 120 million tokens.
Tweets were collected with the TweetCaT tool (Ljubeši´c et al., 2014b), which was constructed specifically for compiling Twitter corpora of smaller languages. The tool uses the Twitter API and a small lexicon of language specific Slovene words to first identify the users that predominantly tweet in Slovene, as well as their friends and followers. TweetCaT continuously collected the users’ tweets for a period of almost two years, also updating the list of users. This resulted in the Slovene tweet subcorpus, which contains 61
million tokens. Currently, most of the collected tweets were written between 2013 and 2014. It should be noted that the majority of these tweets did not turn out to be user-generated content, but rather news feeds, advertisements, and similar ma-terial produced by professional authors.
For forum posts and news site comments, six popular Slovene sources were chosen as they were the most widely used and contained the most texts. The selected forums focus on the topics of mo-toring, health, and science, respectively. The se-lected news sites pertain to the national Slovene broadcaster RTV Slovenija, and the most popular left-wing and right-wing weekly magazines. Be-cause the crawled pages differ in terms of struc-ture, separate text extractors were developed using the Beautiful Soup1 module, which enables
writ-ing targeted structure extractors from HTML doc-uments. This allowed us to avoid compromising corpus content with large amounts of noise typi-cally present in these types of sources, e.g. adverts and irrelevant links. It also enabled us to structure the texts and extract relevant metadata from them. The forum posts contribute 47 million tokens to the corpus, while the news site comments amount to 15 million tokens. As with tweets, the majority of the collected comments were posted between 2013 and 2014. The forum posts cover a wider time span, with similar portions of text coming from each of the years between 2006 and 2014.
The corpus is also automatically annotated. The texts were first tokenised and the word tokens normalised (standardised) using the method of Ljubeši´c et al. (2014a), which employs character-based statistical machine translation. The CSMT translation model was trained on 1000 keywords taken from the Slovene tweet corpus (compared to a corpus of standard Slovene) and their manu-ally determined standard equivalents. Then, using the models for standard Slovene the standardised word tokens were PoS-tagged and lemmatised.
2.2 Samples for Manual Annotation
For the experiments reported in this paper, we con-structed a dataset containing individual texts that were semi-randomly sampled from the corpus of tweets, forum posts and comments. The dataset was then manually annotated.
To guarantee a balanced dataset, we selected
1http://www.crummy.com/software/
equal proportions (one third) of texts for each text type. For forum posts and comments, we included equal proportions of each of their six sources. In order to obtain a balanced dataset in terms of language (non-)standardness from a corpus heav-ily skewed towards standard language, we used a heuristic to roughly estimate the degree of text (non-)standardness, which makes use of the cor-pus normalisation procedure. For each text, we computed the ratio between the number of word tokens that have been changed by the automatic normalisation, and its overall length in words. If this ratio was 0.1 or less, the text was consid-ered as standard, otherwise it was considconsid-ered as non-standard. The dataset was then constructed so that it contained an equal number of ”standard” and ”non-standard” texts. It should be noted that this is only an estimate, and that the presented method does not depend on an exact balance. Dif-ferent rough measures of standardness could also be taken, e.g. a simple ratio of out-of-vocabulary words to all words, given a lexicon of standard word forms.
2.3 Dimensions of Standardness
It is far from easy to tell how ”standard” a cer-tain text is. While it could be regarded as a sin-gle dimension of a text (as is usually the case with e.g. sentiment annotation), standardness turns out to comprise a very disparate set of features. For example, some authors use standard spelling, but no capital letters. Others make many typos, while some will typeset their text in a standard fashion, but use colloquial or dialectal lexis and morphol-ogy.
To strike a balance between the adequacy and the complexity of the annotation, we decided to use two dimensions of standardness: technical and linguistic. The score for technical text standard-ness focuses on word capitalisation, the use of punctuation, and the presence of typos or repeated characters in the words. The score for linguistic standardness, on the other hand, takes into account the knowledge of the language by the authors and their more or less conscious decisions to use non-standard language, involving spelling, lexis, mor-phology, and word order.
These two dimensions are meant to be straight-forward enough to be applied by the annotators, informative enough for NLP tools to appropri-ately apply possibly different normalisation
meth-ods, and relevant enough to linguists for filtering relevant texts when researching non-standard lan-guage.
2.4 Manual Annotation and Resulting Dataset
The annotators, who were postgraduate students of linguistics, were presented with annotation guidelines and criteria for annotating the two di-mensions of non-standardness. Each given text was to be annotated in terms of both dimen-sions using a score between 1 (standard) and 3 (very standard), with 2 marking slightly non-standard texts. We used a three-score system as the task is not (and can hardly be) very precisely defined. Using this scale would also allow us to better observe inter-annotator agreement. In addi-tion, for learning standardness models, we used a regression model, which returns a degree of stan-dardness, rather than a classification one. In this particular case, a slightly more fine-grained scor-ing is beneficial.
To give an idea of the types of features taken into account for each dimension, two examples of short texts are presented below:
• T=1 / L=3
Original: Ma men se zdi tole s poimenovanji oz s poslovenjenjem imen mest ˇcist mem. Standardised: Meni se zdi to s poimenovanji oz. s poslovenjenjem imen mest ˇcisto mimo. English: To-me Refl. it-seems this with nam-ing i.e. with maknam-ing-into-Slovene names of-cities completely wrong.
Differences: Colloquial particle (“ma”), col-loquial form of pronoun (“tole” vs. “to”), phonetic transcription of dialectal word forms (“men” vs. “meni”, “ˇcist” vs. “ˇcisto”, “mem” vs. “mimo”)
• T=3 / L=1
Original: se pravi,da predvidevaš razvel-javitev
Standardised: Se pravi, da predvidevaš
razveljavitev?
English: Refl. this-means, that you-foresee annuling?
Differences: No capital letter at the start of sentence, no space after the comma, no sentence-final punctuation.
e.g. if they were written in a foreign language, automatically generated (such as news or advert lead-ins in tweets) or if they contained no linguis-tic material (e.g. only URLs, hashtags, and emoti-cons). These texts were then not included in the manually annotated dataset.
After a training session in which a small set of texts was annotated and discussed by all annota-tors, the experimental data was annotated in two campaigns. A first batch of 904 text instances was annotated, each by a single annotator, and was subsequently used as the development data in our experiments. For the second batch, each of 402 text instances was annotated by two annotators. In 8 of these instances, the difference between the an-notations made by separate annotators in at least one dimension was two. This means that the first annotator marked a text as standard in at least one dimension, while the other marked it as very non-standard. This is why these data points were re-moved from the dataset, leaving 394 instances that constituted the testing set for the experiments. The response variables for the experiments were com-puted as the average of the values given by two annotators.
3 The Feature Space
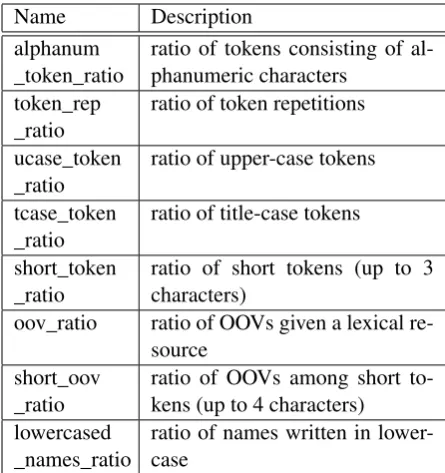
We defined 29 features to describe the technical and linguistic text properties. The features can be grouped in two main categories. Character-based features (listed in Table 1 and described in 3.1) concern the incorrect use of punctuation and spaces, character repetition, the ratio of alphabetic vs. non-alphabetic characters, vowels vs. conso-nants, etc. Token-based features (listed in Table 2 and described in 3.2) describe word properties. Some are very general, e.g. proportions of very short words, capitalised words, etc., while others depend on the use of language-specific lexicons and mostly compute the proportion of words not included in these lexicons.
3.1 Character-based Features
This category contains features dealing either with the use of punctuation and brackets or the use of alphanumeric characters.
In terms of punctuation and brackets, we calcu-late the ratio of punctuation compared to all char-acters, ratio of paragraphs ending with an end-of-sentence punctuation sign, and the ratio of spaces preceding or not following a punctuation sign.
Name Description
punc_space
_ratio ratio of punctuations followedby a space space_punc
_ratio ratio of punctuations following aspace ucase_char
_ratio ratio of upper-case characters
punc_ratio ratio of punctuation characters sentpunc
_ucase_ratio ratio of sentence endings fol-lowed by an upper-case charac-ter
parstart
_ucase_ratio ratio of paragraph beginningswith an upper-case character parend_sent
punc_ratio ratio of paragraphs ending witha punctuation alpha_ratio ratio of letter characters
weirdbracket
_ratio ratio of brackets with unex-pected spaces weirdquote
_ratio ratio of quotes with unexpectedspaces char_repeat
_ratio ratio of character repetitions ofn={2,3} alpha_repeat
_ratio ratio of letter repetitions ofn={2,3} char_length text length in characters
cons_alpha
_ratio ratio of consonants among let-ters
vow_cons
_ratio ratio of vowels and consonants
alphabet
_ratio ratio of Slovene alphabet charac-ters
Table 1: Overview of character-based features
Similarly, we calculate the ratio of opening or closing brackets that are preceded and followed by spaces.
Name Description alphanum
_token_ratio ratio of tokens consisting of al-phanumeric characters token_rep
_ratio ratio of token repetitions
ucase_token
_ratio ratio of upper-case tokens
tcase_token
_ratio ratio of title-case tokens
short_token
_ratio ratio of short tokens (up to 3characters) oov_ratio ratio of OOVs given a lexical
re-source short_oov
_ratio ratio of OOVs among short to-kens (up to 4 characters) lowercased
_names_ratio ratio of names written in lower-case
Table 2: Overview of token-based features
3.2 Token-based Features
In this category, we discriminate between string-based and lexicon-string-based features, the latter being dependent on external data sources.
In terms of string-based features, we compute the ratio of title-case and upper-case words, as well as word repetitions. Another feature is the ratio of words composed only of consonants. We also consider the ratio of very short words.
A large part of lexicon-based features uses the Sloleks lexicon2 (Krek and Erjavec, 2009),
consisting of Slovene words with all their word forms. The lexicon consists of 961,040 forms since Slovene is a morphologically rich language and each lexeme has many possible word forms.
The features based on this resource are the ra-tio of out-of-vocabulary (OOV) words (sloleks), the ratio of words that are OOVs, but are miss-ing a vowel character (sloleks_vowel), the ra-tio of short words that are OOVs (sloleks_short), and the number of lower-case forms covered by a title- or upper-case entry in the lexicon only (sloleks_names).
We experimented with another source of lexi-cal information – the KRES balanced corpus of standard Slovene (Logar Berginc et al., 2012). We produced two lexicons from the corpus, one con-sisting of all letter-only tokens occurring at least
2Sloleks is available under the CC BY-NC-SA license at
http://www.slovenscina.eu/.
ten times (70,249 entries, kresleks_10), and the other with the frequency threshold of 100 (4,339 entries, kresleks_100). We used both resources to calculate OOV ratios.
Finally, we used a very small lexical resource of 195 most frequent non-standard forms of Slovene (nonstdlex). We produced this resource by cal-culating the log-likelihood statistic of each token from our corpus with respect to its frequency in the KRES corpus. We manually inspected the 250 highest-ranked tokens, cleaning out 55 irrelevant entries.
4 Experiments and Results
In this section, we describe our regressor optimi-sation and evaluation, the analysis of feature co-efficients, the dependence on external information sources, the learning curve of the problem, and the independence from the text genre.
4.1 Regressor Optimisation
In the first set of experiments, we used the de-velopment set to perform grid search hyperparam-eter optimisation via 10-fold cross-validation on the SVR regressor using an RBF kernel. As our scoring function throughout the paper, we use the mean absolute error as it is more resistant to out-liers than the mean squared error, and is also easier to interpret.
The results obtained from the optimised regres-sor, presented in Table 3, showed that the task of predicting technical standardness is simpler than that of predicting linguistic standardness, which was expected.
Dimension Mean absolute error
technical 0.451±0.033
linguistic 0.544±0.033
Table 3: Results obtained from the dev set
4.2 Test Set Evaluation
Once we had optimised our hyperparameters on the development set, we performed an evaluation of the system on our test set. Given that the test set was double-annotated, with opposite-label instances removed and neighbouring labels aver-aged, we expected a lower level of error compared to the development data.
and baseline_SVR) are supervised equivalents to what researchers mostly use in practice – the OOV ratio heuristic. Those baselines use only one feature – the OOV ratio on the Sloleks lexicon (sloleks). The first baseline (baseline_linear) is al-gorithmically simpler as it uses linear regression, thereby linearly mapping the [0-1] range of the OOV ratio heuristic to the expected [1, 3] range of our response variables. The second baseline (base-line_SVR) uses SVR with an RBF kernel.
The last two baselines are random baselines that produce random numbers in the [1,3] range. The baseline_test was evaluated on our test set and the baseline_theoretical was evaluated on another ran-domly generated sequence of values in the [1,3] range. Both baselines were evaluated on drasti-cally longer test sets (either by repeating our test set or by generating longer sequences of random numbers) to produce accurate estimates.
We can observe that the mean absolute error of our final system did, as expected, go down in com-parison to the 10-folding result obtained on the de-velopment data from Table 3. There are two rea-sons for this: 1) most incorrect annotations in the testing data were removed, and 2) the 3-level scale was transformed to a 5-level scale. The error level on the technical dimension is still lower compared to the linguistic dimension, although the distance between those two dimensions has shrunk from 0.09 points to 0.05 points.
Comparing our system to baseline_linear on the linguistic dimension shows that using more vari-ables than just the OOV ratio and training a non-linear regressor does produce a much better sys-tem, with an error reduction of more than 0.17 points. When using a non-linear regressor as a baseline (baseline_SVR), the error difference falls to 0.12 points, which argues for using non-linear regressors on this problem.
For the technical dimension, as expected, the OOV ratio heuristic is not optimal, producing, dif-ferently than when using all the features, similar or worse results compared to the linguistic dimen-sion.
The two random baselines show that both our system and the OOV baselines are a safe distance away from these weak baselines.
Beside the fact that using multiple features en-hances our results, we want to stress that using a supervised system should not be questioned at all, since the output of heuristics such as the OOV
ra-tio is very hard to interpret by the final corpus user, in contrast to the [1, 3] range defined in this paper.
Technical Linguistic
final system 0.377 0.424
baseline_linear 0.594 0.597
baseline_SVR 0.584 0.548
baseline_test 0.713 0.749
baseline_theoretical 0.889 0.889
Table 4: Final evaluation and comparison with the baselines via mean absolute error.
4.3 Feature Coefficients
Our next experiment focused on the usefulness of specific features by training a linear kernel SVR on standardised data and analysing its coefficients. We thereby inspected which variables demonstrate the highest prediction strength for each of our two dimensions.
For the technical dimension, the most promi-nent features are the ratio of alphabetic characters, the number of character repetitions, the ratio of upper-case characters and the ratio of spaces after punctuation.
On the other hand, for the linguistic dimen-sion, the most prominent features are the OOV rate given a standard lexicon (sloleks), the OOV rate given a lexicon of non-standard forms (nonstdlex), and the ratio of short tokens.
As expected, for the technical dimension, character-based features are of greater importance. As for the linguistic dimension, token-based fea-tures, especially the lexicon-based ones, carry more weight.
4.4 External Information Sources
Our next experiment looked into how much in-formation is obtained from external inin-formation sources used in lexicon-based features. With this experiment, we wanted to measure our depen-dence on these resources and the level of predic-tion quality one can expect if some of those re-sources are not available.
(none). The most informative resource is the lex-icon of standard language (sloleks), yielding a 0.07-out-of-0.11-points error reduction. Produc-ing a lexicon from a corpus of standard language (kresleks_100) does not come close to that, pro-ducing just a 0.02-point error reduction. While the small lexicon of non-standard forms (nonst-dlex) does reduce the error by 0.06 points, using all standard-lexicon-related features (sloleks_all) comes 0.03 points closer to the final result ob-tained with all features (all).
Information source Technical Linguistic
all 0.377 0.424
none 0.384 0.537
kresleks_100 0.385 0.514
sloleks 0.379 0.461
sloleks_vowel 0.378 0.488
sloleks_all 0.380 0.445
nonstdlex 0.379 0.476
Table 5: Dependence of prediction quality on ex-ternal information sources
4.5 Learning Curve
This set of experiments focused on the impact of the amount of data available for training on our prediction quality. We compared three predictors: the technical one, the linguistic one and the lin-guistic one without using any external information sources. The three learning curves are depicted in Figure 1. They show that useful results can be ob-tained with just a few hundred annotated instances. The learning of the technical and linguistic dimen-sions seem to be equally hard when there are up to 100 instances available for learning, the techni-cal dimension taking off after that. The linguis-tic dimension is obviously harder to learn when external information sources are not used. Both learning curves seem to be parallel, showing that a larger amount of training data, at least for the fea-tures defined, cannot compensate for the lack of external knowledge.
4.6 Genre Dependence
Our final experiment focused on the dependence of the results on the genre of the training and test-ing data. We took into consideration the three gen-res pgen-resent in the corpus: tweets, news comments and forum posts. On each side, training and test-ing, we experimented with using either data from
200 400 600 800
−0.60
−0.55
−0.50
−0.45
−0.40
amount of training data
mean absolute error
technical linguistic
linguistic wout external
Figure 1: Mean absolute error as a function of training data size
just one genre or from all genres together. On the training side, we made sure to use the same num-ber of instances in each experiment. The results of the genre dependence experiment are presented in Table 6.
Technical
Tweet Comment Forum All
Tweet 0.384 0.451 0.485 0.440
Comment 0.519 0.389 0.400 0.437
Forum 0.514 0.408 0.370 0.431
All 0.426 0.382 0.417 0.409
Linguistic
Tweet Comment Forum All
Tweet 0.410 0.452 0.503 0.455
Comment 0.453 0.429 0.510 0.465
Forum 0.444 0.458 0.500 0.467
All 0.395 0.439 0.507 0.448
Table 6: Impact of the genre of training (rows) and testing data (columns)
In the technical dimension, we observe best re-sults when training and testing data comes from the same genre. There are no significant differ-ences between the genres.
5 Conclusion
In this paper, we presented a supervised-learning approach to predicting the text standardness level. While we differentiated between two dimensions of standardness, the technical and the linguistic one, we explained both with the same 29 features, most of which were independent from external in-formation sources.
We showed that we outperform the super-vised baselines that rely on the traditionally used OOV ratio only. We outperformed those base-lines even when not using any external informa-tion sources, which makes our predictor highly language-independent.
Both predictors outperformed the supervised baselines when only a few tens of instances are available for training. Most of the learning is per-formed on the first 500 instances. This makes building the training set for a language an easy task that can be completed in day or two.
While the single most informative external in-formation source was the lexicon of standard lan-guage, adding information from very small lexi-cons of frequent non-standard forms or from au-tomatically transformed lexicons of standard lan-guage significantly improved the results.
Finally, we showed that the predictors are, in general, genre-independent. The technical dimen-sion is slightly more genre-dependent than the lin-guistic one. While predicting linlin-guistic standard-ness on tweets is the simplest task, predicting the same on forums proves to be much more difficult. Future work includes applying more transfor-mations to the lexicon of standard language than just vowel dropping, inspecting the language inde-pendence of features without relying on manually annotated data in the target language, and using lexical information from the training data to im-prove prediction.
Acknowledgments
The work described in this paper was funded by the Slovenian Research Agency, project J6-6842 and by the European Fund for Regional Devel-opment 2007-2013, grant RC.2.2.08-0050 (Project RAPUT).
References
Timothy Baldwin, Paul Cook, Marco Lui, Andrew MacKinlay, and Li Wang. 2013. How Noisy Social Media Text, How Diffrnt Social Media Sources. In
Sixth Intl. Joint Conference on NLP, pages 356–364.
David Crystal. 2011. Internet Linguistics: A Student
Guide. Routledge, New York, NY, 10001, 1st
edi-tion.
Jacob Eisenstein. 2013. What to Do About Bad Lan-guage on the Internet. InNAACL-HLT, pages 359– 369. ACL, June.
Jennifer Foster, Ozlem Cetinoglu, Joachim Wagner, Joseph Le Roux, Joakim Nivre, Deirdre Hogan, and Josef van Genabith. 2011. From News to Com-ment: Resources and Benchmarks for Parsing the Language of Web 2.0. InIJCNLP, pages 893–901, Chiang Mai, Thailand. Asian Federation of NLP. Kevin Gimpel, Nathan Schneider, Brendan O’Connor,
Dipanjan Das, Daniel Mills, Jacob Eisenstein, Michael Heilman, Dani Yogatama, Jeffrey Flanigan, and Noah A. Smith. 2011. Part-of-Speech Tagging for Twitter: Annotation, Features, and Experiments.
InACL (Short Papers), pages 42–47. ACL.
Bo Han, Paul Cook, and Timothy Baldwin. 2012. Automatically Constructing a Normalisation Dic-tionary for Microblogs. InEMNLP-CoNLL, pages 421–432, Jeju Island, Korea.
Yuheng Hu, Kartik Talamadupula, and Subbarao Kambhampati. 2013. Dude, srsly?: The sur-prisingly formal nature of twitter’s language. In
ICWSM.
Simon Krek and Tomaž Erjavec. 2009. Standardised Encoding of Morphological lexica for Slavic lan-guages. In MONDILEX Second Open Workshop, pages 24–9, Kyiv, Ukraine. National Academy of Sciences of Ukraine.
Nikola Ljubeši´c, Tomaž Erjavec, and Darja Fišer. 2014a. Standardizing Tweets with Character-Level Machine Translation. InCICLing, Lecture notes in computer science, pages 164–75. Springer.
Nikola Ljubeši´c, Darja Fišer, and Tomaž Erjavec. 2014b. TweetCaT: a Tool for Building Twitter Cor-pora of Smaller Languages. InNinth LREC, Reyk-javik. ELRA.
Nataša Logar Berginc, Miha Grˇcar, Marko Brakus, Tomaž Erjavec, Špela Arhar Holdt, and Simon Krek. 2012. Korpusi slovenskega jezika Gigafida, KRES,
ccGigafida in ccKRES: gradnja, vsebina, uporaba.
Zbirka Sporazumevanje. Trojina, zavod za uporabno slovenistiko: Fakulteta za družbene vede, Ljubljana. Slav Petrov and Ryan McDonald. 2012. Overview of the 2012 Shared Task on Parsing the Web. First Workshop on Syntactic Analysis of Non-Canonical
Language (SANCL), 59.