0
University of Twente.
Faculty of Behavioural, Management and Social Science
Bachelor Thesis of Jacob Heinze Re-take Green Light Version
‘How Sport Activity, Reasoned Pathway and Social Reactive
Pathway of the Prototype Willingness Model explain the Health
Risk Behaviour of Energy Drink Consumption’
Name: Jacob Heinze Study: Psychology
Faculty: Faculty of Behavioural, Management and Social Science Institution: University of Twente
1 Table of Content
Table of Content ... 1
Abstract ... 2
Introduction ... 3
Method ... 13
Results ... 18
Discussion ... 29
2 Abstract
3 Introduction
Background
Energy drink consumption has increased worldwide since 1997 among young adults, adolescents and children and with it emerging health issues. According to Breda, Whiting, Encarnação, Norberg, Jones, Reinap and Jewell (2014) main short term health issues are coming with a caffeine overdose, which can cause in rare cases even death (Kerrigan & Lindsey, 2005). In addition to that, energy drinks are promoting diabetes (Lee, Hudson, Kilpatrick, Graham, & Ross, 2005). On the other hand, energy drinks have positive effects as well. For instance, improving endurance performance and enhancing mood (Ivy, Kammer, Ding, Wang, Bernard, Liao, & Hwang, 2009). Still, even though caffeine has positive effects, the health issues related to energy drinks are important to acknowledge.
An energy drink (ED) is a certain type of drink containing high level of stimulant components. Those drinks are consumed worldwide and the market is huge. More specific, the consumption of Energy Drinks in Europe indicates the dimension of the market. According to the European Food Safety Authority (EFSA) (Zucconi, Volpato, Adinolfi, Gandini, Gentile, Loi, & Fioriti, 2013), 68% of adolescents (aged 10–18 years old), 30% of adults, and 18% of children (<10 years old) consumed energy drinks during the year 2012. In 2015, in the Netherlands 53.8% of the 12-18 year old teenagers in high school drank ED at least 1-2 times a week (Statista, 2015).
Even though Energy Drinks are nowadays commonly consumed by children, adolescents and adults with different backgrounds, Energy Drinks were initially developed to improve the performance of athletes (Alsunni, 2015). For instance, Buxton and Hagan (2012) revealed, that 62.2% of student athletes consumed at least one can of energy drink per week. In line with that, another study showed that 69.3% of the athletes were drinking energy drinks during the past month (Fields, MacDonald, Joseph, Wold, Collins, & Comstock, 2015).
4 Energy Drinks
An Energy Drink (ED) is a certain type of drink containing high level of stimulant components such as caffeine, taurine, D-glucurono-y-lactone, vitamin B, ginseng, guarana and other common ingredients are vitamins plus sugar or sweeteners, which are added also to cover the unpleasant flavour of some ingredients (Zucconi, 2013; Seifert, Schaechter, Hershorin, & Lipshultz, 2011). The main stimulant caffeine is an alkaloid, stimulating the central nervous system. Its content in ED can vary from 70 to 400 mg/L and more, which depends on the maximum limits of caffeine content set differently by regulations of countries. Furthermore, taurine is an amino acid naturally produced by human body, and it is essential for cardiovascular function, and development and function of skeletal muscle, the retina and the central nervous system. D-glucurono-y-lactone is naturally present in human body, as important structural component of connective tissues. In the end, energy drinks contain sugar, which is a sweet crystalline substance obtained from various plants, especially sugar beet and sugar cane and consisting essentially of sucrose. According to Rogers (2019) ED are promoted as beverages which can enhance mental alertness and physical performance. Sport Drinks differ, because they are used to replace water during or after physical activity (Rogers, 2019) and in addition to that, they support the body with carbohydrates such as fructose and glucose (Sport dietitians, 2019). Moreover, ED are distinguished from soft drinks, because soft drinks do not contain caffeine or at least not as much as ED contain (Rogers, 2019). Similar to that, coffee and tea are not considered as ED, because they could be without caffeine and do not contain sugar in itself. Examples of ED are Red Bull, Monster and Rockstar.
Adverse Health Effects Associated with Energy Drink Consumption
5
Albertson, 2006), which can lead to a stroke by damaging and weakening your brain's blood vessels (National Heart, Lung, and Blood Institute, 2018), hypercalcemia, which is a condition in which the calcium level in your blood is above normal and too much calcium in your blood, which can interfere with how your brain and heart work, can create kidney stones and can weaken your bones (Shane, 2016), natriuresis, which is the process of sodium excretion in the urine through the action of the kidneys, which can lead to kidney or congestive heart failure and severe hyponatremia can lead to coma (Jameson, Fauci, Kasper, Hauser, Longo, Loscalzo, 2018), insulin resistance, which is promoting diabetes (Lee et al., 2005), plus several other adverse health side effects such as seizures, convulsions, headaches occurring 22% in participants (Malinauskas et al., 2007), metabolic acidosis, diuresis, vomiting/nausea occurring 56% in participants (Riesenhuber, Boehm, Posch, Auftricht, 2006; Scher, Stewart, Lipton, 2004; Breda et al., 2014; Lee et al., 2005; Seifert et al., 2011; Gallimberti, Buja, Chindamo, Vinelli, Lazzarin, Terraneo, Scafato, & Baldo, 2013; Malinauskas et al., 2007). Beside these physical symptoms, ED consumption is associated with mood and behavioural disorders (Seifert et al., 2011; Gallimberti et al., 2013). Moreover, there is an association between caffeine intoxication and OCD, psychotic and manic symptoms. (Gilliland, & Andress, 1981; Lara, 2010). According to different research, those symptoms can start with 12.5 mg to 100 mg caffeine intake (Breda et al., 2014; Watson, 1988; Malinauskas et al 2007; Lara, 2010).
In addition to these adverse health effects, Watson (1988) stated that the lethal dose for adults appears to be roughly 5,000 to 10,000 mg. Contrary to that, Cappelletti, Piacentino, Fineschi, Frati, Cipolloni and Aromatario (2018) reported that among 92 deaths associated with a caffeine overdose, caffeine was ranging from 62 mg/L blood to 1040 mg/L with a mean of 213 mg/L. Since the human body contains between 4,5-5,5 litres of blood (Geggel, 2016), the lethal dose caffeine among was ranging from approximately 300 mg to 5000 mg with a mean of 1000 mg, which is much lower than Watson (1988) stated.
In the end, it can be summarized that even though the prevalence rate and severity of adverse health effects regarding ED consumption is not certain, it can be concluded that even small amounts of ED can have adverse health effects, and most of them are related to caffeine.
Positive Effects of Energy Drinks Associated with Energy Drink Consumption
6
Blom, van Gerven, van Willigenburg, Olivier and Verster (2011), ED significantly improve increases alertness, improve memory, concentration and improves physical performance. The same study and Reyner and Horne (2002) revealed that driving performance is improved and driver sleepiness during prolonged highway driving is reduced. This is in line with research by Ishak, Ugochukwu, Bagot, Khalili and Zaky (2012) which revealed that energy drinks promote wakefulness, increase energy and mood. In addition to that, according to Dawes, Campbell, Ocker, Temple and Carter (2014) the energy drink consumption improves the endurance performance, when taken before the training. One have to be aware of industry biased research, since many of those studies were financed by stakeholders with certain interests, which might be influencing the outcomes of such research (Higgins, Babu, Deuster, & Shearer, 2018). For instance, research by Mets et al. (2011) which is providing evidence that EDs has several positive impacts was financed by Red Bull over three years. In Line with that Ivy et al., (2009) plus Reyner and Horne (2002) stated in their acknowledgement that their study was funded by Red Bull GmbH.
On the other hand, a literature review of 41 studies by Kennedy and Scholey (2004) revealed that there is limited evidence that EDs significantly improving mental and physical performance. EDs do not show enhancement of the driving abilities when a person is tired and no decline of mental fatigue during long periods of concentration (Kennedy & Scholey, 2004). It is important to mention that the researcher did receive financial support by an organisation called GlaxoSmithKline Consumer Healthcare R&D claiming to help people do more, feel better and live longer through innovative scientific research (GSK). Furthermore, according to Higgins et al. (2018), long-term effects of ED consumption have not been well studied.
Even though there is research financed by industry, Higgins et al. (2018) stated that independent research found several positive effects of ED as well. Still, research financed by industry is undermining the adverse health effects of ED (Higgins et al., 2018). In addition to that, Ioannidis (2005) reveals how it is possible to manipulate research outcomes and states that research findings are likely to be false when financial and other interest is included.
7 Energy Drink Consumption in the Netherlands
Energy Drinks are consumed worldwide and the market is huge. Entering of Red Bull in the American market, in 1997, was the initial impulse for the increase of energy drink consumption worldwide (Reissig, Strain, & Griffiths, 2009). In 2006, nearly 500 new brands were launched worldwide and the global consumption of ED increased by 17% compared to the previous year (Johnson, 2006). More recently in 2014, the ED Red Bull alone sold 5.612 billion cans (43% of the global market), and the sales growth was 4.2% compared to 2013 (Nowak, & Jasionowski, 2015).
Scoping into the Energy Drink consumption in the Netherlands reveals the urge of research regarding the underlying factors of the Energy Drink consumption within the Netherlands, especially among young people. In Netherlands, in 2013, the European Food Safety Authority (EFSA) conducted a research to gather information about the consumption of energy drinks in 16 countries within the European Union. It was found that 67% of Dutch adolescents (aged 10–18 years old), 21% of adults, and 20% of the children, (<10 years old) consumed energy drinks during 2012. In line with that, in 2015, in the Netherlands 53.8% of the 12-18 year old teenagers in high school drink ED at least 1-2 times a week (Statista, 2015). In addition to that, 53% of the adult ED consumers were 18-29 years old and are considered as young adults and reveals the following (Zucconi, Volpato, Adinolfi, Gandini, Gentile, Loi, & Fioriti, 2013). These percentages indicate that ED consumption in the Netherlands is prevalent, especially among young people (<30 years old).
In more detail, the EFSA discovered in 2013 that in the EU, The Netherlands had the highest proportion of adolescents (10-18 year) displaying high chronic Energy Drink consumption (27%) during 2012 (Zucconi et al., 2013). High chronic ED consumption is defined by the EFSA as drinking ED 3-5 times per week or more. Furthermore, it was found that 14% of the adults, and 16% of the children, were high chronic consumers as well. These high chronic ED consumers, consumed Energy Drinks with an average of 4.5 L/month (Zucconi et al., 2013). In addition to that, 9% of the adults, and 7% of the adolescence and children were high acute consumers. High acute ED consumption is defined by the EFSA as drinking at least 1 L per session. The average consumption among adolescents was 2.1 L, while 1.96 L among children and 2 L among adults per month (Zucconi et al., 2013).
8
according to Statista (2015), 25.9% of the adolescence in the Netherlands are high chronic Energy Drink consumers. To summarize, the ED consumption grew rapidly and is highly prevalent in the Netherlands. Therefore, since many people in our society consuming ED, it is relevant to investigate the underlying factors of the Energy Drink consumption behaviour.
Energy Drink Consumption and Sport
While energy drinks were initially used mainly by athletes, they have gained rapid popularity among children, adolescents and adults with different backgrounds (Heckman, Sherry, & Gonzalez De Mejia, 2010). Adolescence (10-18) and young adults between 19 and 29 are now the “new customers” for energy drink companies. Still, Energy Drinks are associated with sports and a study among American high school athletes (aged 12-18) reported that 69.3% of the athletes consumed Energy Drinks within the past month (Fields et al., 2015). Among these athletes 5.3% were high chronic ED consumers. In line with that. Buxton and Hagan (2012) revealed, that 62.2% of student athletes consumed at least one can of energy drink per week. The athletes were drinking ED to improve their performance (Fields et al., 2015).
Furthermore according to Fields et al. (2015), 49.8% of the athletes were drinking Energy Drinks before, during or after sport activities. This shows the importance of Energy Drinks among athletes. Additional research by the EFSA (2013) provided evidence that 41% of the adolescents (10-18) consume Energy Drinks during sport activities. The prevalence is even higher among young adults (19-29 year), since 52% consume Energy Drinks during sport activities.
9
In line with these beneficial effects, 80% of the athletes from the study of Fields et al. (2015) consumed ED to gain more energy and 75% to improve their athletic performance. According to Buxton and Hagan (2012) 58.9% of the athletes stated that they drank energy drinks to replenish lost energy. Additional Research by Larson, DeWolfe, Story and Neumark-Sztainer in 2014 among adolescences (11-18) in Minneapolis, showed that there is an association between ED consumption and participation in sport activities. Adolescents consuming more than one Energy Drinks per week, were participating on average, 5.45 hours per week in sport activities, whereas participants drinking less than one Energy Drink per week were solely participating 5 hours per week in sport activities. Beside the potential benefits of ED within sport, research by Field (2015) and Buxton and Hagan (2012) have shown that athletes are often (73%) not aware of adverse health effects. Furthermore, a review by Cappelletti et al. in 2018 revealed that 15% of the caffeine related deaths are associated to sport. This indicates the need for research regarding sport and ED consumption (Cappelletti et al., 2018).
Moreover, regarding prevalence of participating in sport activities the Dutch government conducted research regarding sport in the Netherlands, including hours per week participating in sport activities (Sport in the Netherlands, 2017). It was found that the on average Dutch participants spend 2.5 hours participating in sport activities. And participants of the study were categorized in ‘Low Sport Activity’, participants doing sport, less than 1.5 hour per week. Secondly, ‘Average Sport Activity’, participants doing sport, between 1.5 and 3.5 hours per week. Finally, ‘High Sport Activity’, participants doing sport, more than 3.5 hours per week.
To conclude, several research has shown that Energy Drink is relevant within sports, since athletes are consuming Energy Drinks to improve their level of energy and improve their athletic performance. Even though ED consumption seems to be prevalent among athletes, little is known about the association between the ED drinking behaviour and participating in sport activities among adolescents (10 to 18), young adults (19 to 29) and adults (30<). Furthermore, it is important to reveal the underlying factors of ED consumption, to gain understanding of the motives, supports the design of future interventions and further knowledge is also important for parents and family members, teachers, coaches, dieticians, physiotherapists, doctors and the people themselves.
10
Investigating and revealing the underlying factors of ED consumption is the aim of this study. Therefore, the application Prototype Willingness Model (PWM) (figure 1) is indicated, which is a decision making framework explaining a wide range of behaviour, in particular health-risk behaviour (Gibbons & Gerrard, 1995). Two cognitive pathways are included in the PWM, the Reasoned Pathway and the social pathway.
The Reasoned Pathway is basically the Theory of Planned Behaviour (TPB) by Aijzen (1991). This model consists of attitude, subjective norms and perceived behaviour control, all aspects influencing intention and thus behaviour. Within this Reasoned Pathway of the TPB the behavioural intention is the proximal predictor of the behaviour. If the intention is stronger, then the chances for displaying a certain behaviour are higher. Intention is part of the Reasoned Pathway of the PWM, and is influenced by attitude and subjective norm. These variables are causing then the actual behaviour, just as in the TPB, except for the perceived behavioural control, which is also influencing the intention in the TPB How positive or negative someone evaluates a certain behaviour is the attitude. Subjective norm indicates the perceived social pressure someone to display a certain behaviour.
The Social Reactive Pathway is the additional path to the TPB added by Gibbons and Gerrard (1995). This path includes the willingness to display a certain risk behaviour (Gerrard, Gibbons, Houlihan, Stock, & Pomery, 2008). In addition to attitude and subjective norm, the social reactive pathway, thus willingness, is influenced by prototype perception. The prototypes perception are images of a typical person, engaging risk behaviour, composed of prototype similarity and prototype favourability of the individual. Prototype favourability describes how much positive or negative attributes are acknowledged by the prototype. Prototype similarity indicates how much someone identifies with the prototype. The prototypes affect the behavioural willingness, which is the tendency to perform a certain behaviour when there is opportunity. For example, standing at the traffic lights and no one is coming by, individuals might cross the street, when it is red for pedestrians, even though they did not have a prior intention. Thus, even if intentions are not favourable, the PWM recognizes the possibility of behavioural performance (Gerrard, Gibbons, Houlihan, Stock, & Pomery, 2008). To summarize, according to the social reactive path, favourability and similarity of the prototype would result in stronger willingness to display the behaviour. Moreover, according to the reasoned path, favourable attitudes and strong social approval would lead to stronger intentions toward the behaviour and higher chances to display that behaviour. In the end, both pathways via the intentions and the willingness would predict the behavioural performance.
11
while intoxicated (Rivis, Abraham, & Snook, 2011), ignoring red traffic lights, cycling to school (Frater, Kuijer, & Kingham, 2017), and speeding behaviour (Elliott, McCartan, Brewster, Coyle, Emerson, & Gibson 2017). Elliott et al. (2017) investigated the TPB and the PWM regarding speed riding behaviour and found that willingness is a stronger predictor of driver behaviour than intention (Elliott et al., 2017). They stated that these findings could be influenced by the fact that speeding behaviour is not exclusively planned, but usually a reaction to external factors.
Furthermore, beside the PWM usability regarding road traffic, the PWM’s utility was demonstrated regarding other health risk behaviour as well. For example, Lewis, Litt, Tomkins and Neighbors (2017) found that the PWM was a strong model explaining alcohol consumption. In addition to that, regarding health risk behaviour to improve performance with caffeine pills, it was found that the PWM was a suitable model to predict the health risk behaviour as well (Brand & Koch, 2016). These studies found that such health risk behaviour is predicted by intention. Until today, no research has investigated whether the PWM is suitable to predict ED consumption, but this health risk behaviour is similar to the health risk behaviour to improve performance with caffeine pills and other health risk behaviour like alcohol consumption (Lewis et al., 2017). Therefore, the PWM is valuable as predictor of the health risk behaviour of ED consumption.
Prototype Perception
Attitude
Subjective Norm
Willingness Intention
Risk Behaviour
EDC Sport
Participation
12
Consequently the purpose of this study is multidimensional and serves not only to contribute to existing literature, but based on earlier research regarding ED consumption and more specific ED consumption regarding sport. This research aims to gain knowledge about the underlying factors of ED consumption and participation in sport activities. This is important to understand, since several health issues are associated with ED consumption and concerning prevalence rates, especially among athletes. Research has shown that ED consumption among athletes highly prevalent (Fields et al., 2015; Buxton & Hagan, 2012). The question remains, whether time participating in sport activities is associated with ED consumption. Therefore, the following first research question is has been formulated:
RQ1: ‘Is time participating in Sport Activities predicting the health risk behaviour of Energy Drink Consumption?’
Furthermore, to understand the motives of ED consumption and participation in sport activities in more detail and to inform the design of future interventions, the PWM serves as a model to find the influencing underlying factors. Therefore, on one hand, it will be investigated whether the ED consumption among participants doing sport is driven by reasoned motives, including attitude and subjective norm, and intention. Thus, the variables of the Reasoned Pathway. On the other hand, it will be investigated to what extend the ED consumption, among participants doing sport, is socially driven, due subjective norm, prototype perception and willingness. Thus, the variables of the social reactive pathway. This leads to the third and fourth research questions:
RQ2: ‘Is Time participating in Sport Activities a predictor of Energy Drink Consumption, and is this mediated through the Reasoned Pathway?’ RQ3: ‘Is Time participating in Sport Activities a predictor of Energy Drink
13 Method
Design
A cross-sectional survey has been conducted. Therefore, a questionnaire was developed in collaboration with three other students, who were investigating the variables gender, age and sensation seeking for their graduation project. The questionnaire assembled all components of the PWM with regard to EDC and participation in sport activities. Thus, this quantitative research investigated the effect of the variables of the PWM and participation in sport activities on EDC. Participation in sport was the independent variable and ED consumption the dependent variable. The questionnaire was written in English and translated to Dutch to ensure that particular young participant, without sufficient English skills, were able to comprehend the questions.
Participants and Procedure
In the first place the BMS ethics committee of the University of Twente was asked to approve this study. The approval for the conduction of this study, from the BMS Ethics Committee of the University of Twente, was given the 16th of April 2019, ensuring all legally necessary requirements.
With the approval of BMS Ethics Committee, the data collection by the questionnaire started online. It was spread via social media (Facebook, WhatsApp, E-Mail) and the SONA system of the University of Twente (participants taking part via the SONA system were offered a reward of 0.50 points). Furthermore, to ensure underage participants taking part, the hyperlink to the questionnaire was spread among players of the FootballEquals Academy Twente. The inclusion criteria were a minimum age of 9 years and accepting the informed consent by the participants or by their parents, if younger than 18 years old. Taking part required access to the internet and a device able to use Qualtrics, where one, during 20-25 undisturbed minutes, could answer the questionnaire.
Qualtrics is an online application for research purposes and it was possible to get access to the survey via the SONA system (solely for University of Twente students). The data collection ended on the 1st of June. After this deadline, the information was retrieved from Qualtrics and analysed through SPSS which is a software for statistical analysis.
14
included, and it was explained how the data was further processed. Since data got gathered among under 18 years old participants as well, another informed consent and declaration of consent was made to ensure the approval of the parents. For questions and suggestions contact information of the experimenters were indicated.
The data collection ended 1st of June and 271 participants took part in the study. 58 were excluded because participants did not manage to finish the questionnaire (54) or solely clicked through the answers. Thus, overall, the study included n=213 participants with Mage=28 and SDage=14, from which 42.3% were male and 57.7% female. Concerning the nationality 60.1% are German, 28.2% are Dutch and additional 11.7% have other nationalities.
Materials
Four researchers who had the same overall topic (“Energy drink consumption according to the Prototype Willingness Modell”) worked together to increase the number of participants and developed a questionnaire with 42 items in total. The relevant four topics of questions regarding this research were, the behaviour of energy drink consumption, the Prototype Willingness Model, sport and questions about demographics. Before disseminating the questionnaire, to ascertain the clarity of the questions, a pre-test was done by five people to figure out whether mistakes and misconceptions were made. Based upon the results of these pilot-tests, some minor mistakes were corrected. The two principal improvements were made. First, changing the headline "Subjective Norm" into "Opinions around you regarding Energy Drink consumption" to make it easier to understand for the participants, and secondly, adjusting the fourth question of this item into a more comprehensive one: "The people in my life whose opinion I value would 'completely disagree - completely agree' with my weekly consumption of energy drinks."
15
participants were divided into three groups according to the categorization of the EFAS. First: No ED Consumers, who have never drunk an ED or at least not in the past month. Second: Chronic ED Consumers, who had drunk 1-2 times week. Third: High Chronic ED Consumers, who had drunk 3-6 or more times a week.
Prototype Willingness Model. Gaining insights about the variables of the Prototype Willingness Model, the questionnaire included statements and questions about the attitude, subjective norms, prototype perceptions, intention, and willingness of the participants according to energy drink consumption. The questions regarding the Prototype Willingness Model were adapted from measures developed by Gibbons & Gerrard (1995). Then questions had to be answered on a 5-point Likert Scale. Examples will be given, but the whole questionnaire can be found in the appendix.
Attitude. Attitude was measured with two constructs. First, a construct of 5 bipolar adjectives about energy drink consumption (e.g. ‘harmful – beneficial’ or ‘pleasant – unpleasant’). Then a 5-point scale was generated by calculating mean scores of all items, which
were then averaged into a ‘direct measure’ attitude scale ranging from 1-5. In that attitude scale a higher score indicates a more positive attitude. The Cronbach's alpha for this scale was 0.93. Moreover, participants had to appraise 15 behavioural beliefs including positive and negative beliefs about the ED consumption (e.g. ‘I believe that energy drink consumption could boost my energy’ or ‘Drinking Energy Drinks deteriorates one’s mood’). These questions had to be
answered on a 5-point scale from (1=extremely unlikely; 5=extremely likely). Positive and negative beliefs were grouped with a Cronbach’s alpha of 0.71 for the positive beliefs, and the negative beliefs 0.76.
Subjective Norm. Subjective norm, was measured by six items which could be answered
with the 5-point scale (e.g. “Friends important to me think that I should consume Energy Drinks.; When it comes to Energy Drinks, I comply to the opinion of my family.”) (1= strongly disagree; 5=strongly agree) Scoring a high mean score on this scale (1-5) indicates a high perceived social pressure to consume energy drinks. Still, Cronbach’s Alpha for the Scales was not adequate, and therefore solely the normative beliefs were used.
Prototype perception. Prototype perception, was measured by twenty items regarding
16
for the positive and negative subscales the mean was calculated. The Cronbach's alpha for the positive items scale was 0.90, and for the negative scale it was 0.87. Second, four items regarding the Prototype Similarity were asked. Participants had to state how similar they were to a typical energy drink consumer at their age (e.g. ‘Do you resemble the typical person your age that regularly consumes Energy Drinks?’; ‘How similar or different are you to the type of
person your age that regularly consumes Energy Drinks?’ ). For each question the answers were on a 5-point scale, with slightly different options to answer, due to different formulation of the questions (e.g. 1=definitely not, 5=definitely yes & 1=strongly disagree, 5=strongly agree). Scoring a high mean score on the Prototype Similarity Scale indicated that the participant highly associated himself with the prototype. The Cronbach's alpha for the Prototype Similarity Scale was 0.86.
Intention. Intention, to consume ED, was measured by four items (e.g. “I intend to
consume at least one Energy Drink in the next month; I intend to drink an Energy Drink in the next week.”), which were answered with the 5-point scale (1= strongly disagree; 5=strongly agree). Scoring high on this scale indicates that an ED is consumed intentionally. The Cronbach's alpha for the Intention Scale was 0.94.
Willingness. Willingness, to consume ED, was measured with one construct including
seven items. Participants had to state on a 5-point scale (1=definitely not willing, 5=definitely willing) how willing they were to consume an ED. Different items were measuring the willingness in different situations (e.g. ‘Suppose someone offers you an Energy Drink when you want to do sports. How willing are you to consume it?’; Imagine you did not sleep a lot last night and you are tied. A friend offers you an Energy Drink. Would you consume the Energy Drink?) A high mean score on that scale indicates a high willingness to consume an ED. The Cronbach's alpha of the Willingness Scale was 0.90.
17
This categorization was difficult, since answers of participants were vague, because some answered with ‘I do enough sport’ or ‘three to five’ hours per week. In line with that, participants stated to do sport ‘4 times a week’, and to do ‘1 1/2 hour’ sport, and their favourite sport was ‘basketball’. It is not realistic to do play basketball 4 times a week only doing 1.5 hours sport. These data needed to be excluded, or transformed to 4x1.5 hours. Furthermore, one participant, 70 years old, stated to do 7 hours sport a week, and the sport he was doing was ‘walking’. These are examples, why the definition of participation in sport was not clear enough and gave to much room for interpretation.
Demographics. Four demographic questions were asked at the end of the questionnaire regarding the gender, age, nationality, and educational level of the participants. These question were asked in the end, to prevent any bias of the participants regarding their demographics.
Data Analysis
The data analysis of the online survey was executed through the program IBM SPSS statistics v. 25 (2018). In order to answer the research questions, outcomes regarding the ED consumption, time spend participating in sport activities, age, and the variables of the PWM were needed. First, participants not completing the questionnaire and clicking through, but not taking enough time to complete the questionnaire, were not considered in the data analysis. The data analysis then started with analysing the descriptive data including frequencies, mean scores and standard deviation of age, gender, EDC and Sport Activity. To investigate the first research question, the association between Sport Activity and EDC was analysed by the comparing mean scores. Therefore, firstly, the independent variable regarding Sport Activity was categorized into Low-, Average-, and High Sport Activity. Further, the dependent variable was categorized into No EDC, Chronic EDC, and High Chronic EDC, as described above. Furthermore, an ANOVA including a chi-square test was conducted to seek for significant differences between mean scores. Seeking for improvement of further interpretation of the results, a correlation analysis was conducted including all variables of this study. The relationships were analysed by using the Pearson’s r. Since a correlation below Pearson’s r= 0.25 is negligible, Subjective Norm was excluded during further data analysis.
18
added to the analysis. Second, a hierarchical multiple regression analysis, including the variables of the Social Reactive Pathway, including Sport Activity, Prototype Perception and Willingness plus Attitude, to examine the influence of Attitude on that pathway. Third, an analysis solely with the variables of the Social Reactive Pathway, including first Sport Activity, then Prototype Perception and ultimately Willingness. In the end, an analysis including all variables of the PWM to detect the main explanatory valuable variables was conducted. Starting with Sport Activity during the first step of the analysis, then during the second step including Attitude, Prototype Perception and finally including Intention and Willingness. Consequently, main explanatory variables on the depended variable EDC could be interpreted.
Results
Descriptive statistic
19
Table 1
Demographic Characteristics of Participants Separated on Basis of Participation in Sport Activities, Presented in Frequencies (n) and Percent (%) in Brackets
Low Sport Activity n=53 (24.9%) Average Sport Activity n=55 (25.8%) High Sport Activity n=105 (49.3%) Total (N=213)
Age (m/SD)
<18 19-29 30< 34/10 3 (5.7%) 27 (50.9%) 23 (43.4%) 30/12 1 (1.8%) 36 (65.5%) 18 (32.7%) 25/18 24 (22.9%) 63 (60%) 18 (17.1%) 28/14 28 (13.1%) 126 (59.2%) 59 27.7%)
Gender Male 18 (34%) 12 (21.8%) 60 (57.1%) 90 (42.3%)
Female 35 (66%) 43 (78.2%) 45 (42.9%) 123 (57.7%)
Nationality German 37(77.4%) 41 (74.6%) 55 (43.8%) 128 (60.1%) Other 16 (22.6%) 14 (25.4%) 50 (56.2%) 85 (39.9%)
Energy Drink Consumption
No Energy Drink Consumption
42 (79.2%) 39 (70.9%) 73 (69.5%) 154 (72.3%)
Chronic Energy Drink Consumption
8 (15.1%) 10 (18.2%) 22 (21%) 40 (18.8%)
High Chronic Energy Drink Consumption
3 (5.7%) 6 (10.9%) 10 (9.5%) 19 (8.9%)
Sport Activity Predicting Energy Drink Consumption
20
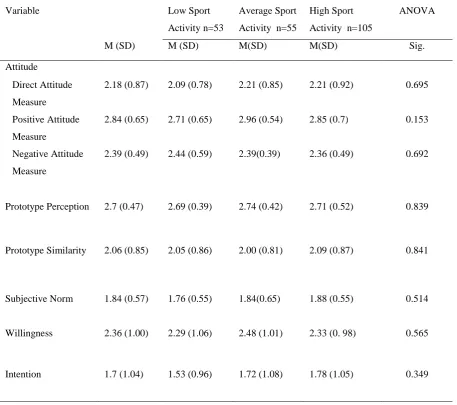
[image:21.595.71.529.359.764.2]significantly different. The different means of the Positive Attitude Measure, were closest to be significantly different at the p<0.05 level for the three conditions [F(2,210) = 1.89, p=0.153]. Thus, this indicates that Level of Sport Activity does not have a significant impact on variables of the PWM regarding EDC. In line with that, EDC is not significantly influenced by Level of Sport Activity, since the mean scores between groups are ranging from m=0.55 to m=0.89 ED per week and this variance between means is not significant at the p<0.05 level for the three conditions [F(2,210) = 0.81, p=0.445]. In the end, it can be concluded that there is no significant association between EDC and Level of Sport Activity.
Table 2
Means, Standard Deviations and Analysis of Variance, Concerning the Study Variables, Divided by Three Different Groups of Level of Sport Activity.
Variable Low Sport Activity n=53
Average Sport Activity n=55
High Sport Activity n=105
ANOVA M (SD) M (SD) M(SD) M(SD) Sig. Attitude
Direct Attitude Measure
2.18 (0.87) 2.09 (0.78) 2.21 (0.85) 2.21 (0.92) 0.695 Positive Attitude
Measure
2.84 (0.65) 2.71 (0.65) 2.96 (0.54) 2.85 (0.7) 0.153 Negative Attitude
Measure
2.39 (0.49) 2.44 (0.59) 2.39(0.39) 2.36 (0.49) 0.692
Prototype Perception 2.7 (0.47) 2.69 (0.39) 2.74 (0.42) 2.71 (0.52) 0.839 Prototype Similarity 2.06 (0.85) 2.05 (0.86) 2.00 (0.81) 2.09 (0.87) 0.841
21
Energy Drink Consumption (Days)
0.77 (1.49) 0.55 (1.37) 0.89 (1.65) 0.81 (1.46) 0.445
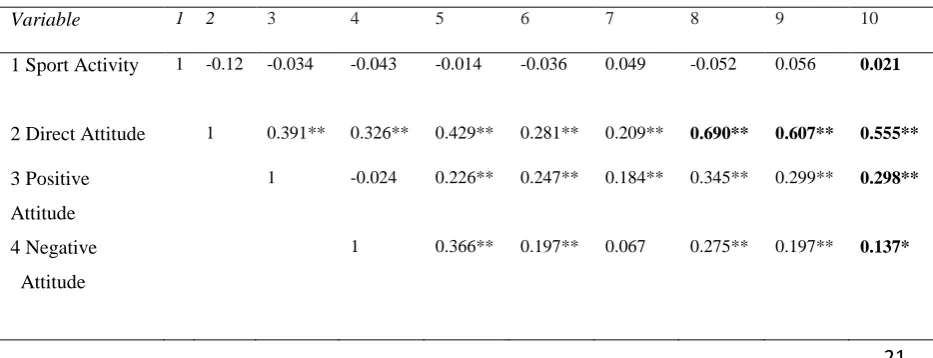
Association Between Constructs of Prototype Willingness Model
[image:22.595.71.538.608.787.2]Examining the relationship between all constructs of the PWM and EDC, a correlation analysis was conducted. In general, most constructs of the PWM have a positive significant correlation with EDC. More detailed, Intention, r = 0.770, p < 0.000, shows the strongest, still solely moderate, correlation with EDC next to Willingness, r = 0.584, p < 0.000 and Direct Attitude, r = 0.555, p < 0.000. This indicates that those three constructs are probably most important explaining EDC. Further, regarding EDC, out of the PWM, solely Subjective Norm does not significantly correlate with EDC, r = 0.071, p = 0.305, ns. This shows that Subjective Norm cannot be a predictor of EDC. In addition to that, the correlation analysis revealed that Positive Attitude, Negative Attitude, Prototype Perception and Prototype Similarity, have a small to moderate correlation with EDC, which supports the findings that Direct Attitude, Intention and Willingness are most important. Interestingly, Direct Attitude does also significantly correlate with Willingness, r = 0.609, p < 0.000, and Intention, r = 0.607, p < 0.000, which indicates that Attitude is probably mainly explaining the Willingness and Intention of EDC. In addition, Willingness and Intention do strongly correlate, r = 0.633, p < 0.000. Hence, Willingness and Intention have some similar characteristics. Finally, it was found that Sport Activity has no significant correlation with EDC, r = 0.021, p = 0.757, ns, indicating that Sport Activity is not important in explaining EDC.
Table 3
Bivariate Correlation Coefficients among Study Variables of the Prototype Willingness Model
Variable 1 2 3 4 5 6 7 8 9 10
1 Sport Activity 1 -0.12 -0.034 -0.043 -0.014 -0.036 0.049 -0.052 0.056 0.021
2 Direct Attitude 1 0.391** 0.326** 0.429** 0.281** 0.209** 0.690** 0.607** 0.555**
3 Positive Attitude
1 -0.024 0.226** 0.247** 0.184** 0.345** 0.299** 0.298**
4 Negative Attitude
22
5 Prototype Perception
1 0.370** 0.142* 0.357** 0.306** 0.280**
6 Prototype Similarity
1 0.080 0.287** 0.427** 0.346**
7 Subjective Norm
1 0.180** 0.172* 0.071
8 Willingness 1 0.633** 0.584**
9 Intention 1 0.770**
10 Energy Drink Consumption
1
*p<0.05
**p>0.01
Sport Activity and Reasoned Pathway Predicting Energy Drink Consumption
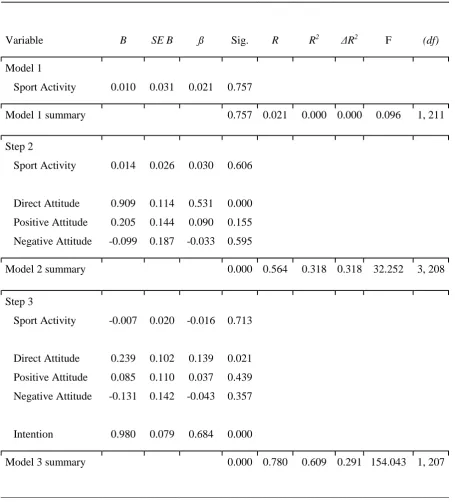
Continuing with answering the Second research question: ‘Is Time participating in Sport Activities a predictor of Energy Drink Consumption, and is this mediated through the Reasoned Pathway?’ a hierarchical multiple regression analysis, including the variables Sport Activity,
23
[image:24.595.75.531.206.709.2]are independent significant predictors of EDC, which are mediated through the Reasoned Pathway.
Table 4
Hierarchical Regression Analysis for Variables of the Reasoned Pathway explaining Energy
Drink Consumption including Sport Activity, Attitude, and Intention (N = 213)
Variable B SE B ß Sig. R R2 ΔR2 F (df)
Model 1
Sport Activity 0.010 0.031 0.021 0.757
Model 1 summary 0.757 0.021 0.000 0.000 0.096 1, 211
Step 2 Sport Activity Direct Attitude Positive Attitude Negative Attitude 0.014 0.909 0.205 -0.099 0.026 0.114 0.144 0.187 0.030 0.531 0.090 -0.033 0.606 0.000 0.155 0.595
Model 2 summary 0.000 0.564 0.318 0.318 32.252 3, 208
Step 3 Sport Activity Direct Attitude Positive Attitude Negative Attitude Intention -0.007 0.239 0.085 -0.131 0.980 0.020 0.102 0.110 0.142 0.079 -0.016 0.139 0.037 -0.043 0.684 0.713 0.021 0.439 0.357 0.000
Model 3 summary 0.000 0.780 0.609 0.291 154.043 1, 207
24
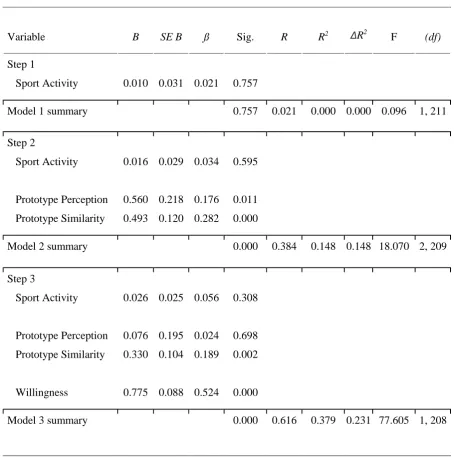
To answer the Third research Question, ‘Is Time participating in Sport Activities a predictor of Energy Drink Consumption, and is this mediated through the Social Reactive Pathway?’ a hierarchical multiple regression analysis was conducted as well, including the variables Sport Activity, Attitude, Prototype Perception and Willingness to predict EDC, was conducted. Therefore, firstly the independent variable, Sport Activity was examined. Obviously equal to the previous regression analysis, Sport Activity does not significantly explain EDC. Secondly, the variables Attitude, including Positive, Negative and Direct Measure, Prototype Perception and Prototype Similarity were added to the regression analysis. Adding these variables during the second step, can significantly explain 59.6% of the variance (F(5, 206) = 22.693, p < 0.000), with an R2 of 0.355. Interestingly, even though Prototype Similarity is significantly explaining 20.6% of the variance the added prototype variables in this regression analysis, are solely adding 3.6% (56.4% - 59.6% = 3.6%) explanatory power, which indicates that the added prototype variables are not contributing considerable explanatory power to predict EDC and are therefore probably trivial. Thirdly, Willingness was added to Attitude and Prototype Perception, which could significantly explain 64.9% of the variance, (F(1, 205) = 23.374, p < 0.000), with an R2 of 0.421. The findings also show, that Attitude has mainly an
[image:25.595.75.528.605.780.2]effect via the Reasoned Pathway and not the Social Reactive Pathway, since Attitude is not 100% mediated by Willingness. In the end, Direct Measure of Attitude (ß = 0.278), Prototype Similarity (ß = 0.180) and Willingness (ß = 0.361) have a small, independent, significant predictive value of EDC, which are mediated through the Social Reactive Pathway.
Table 5
Hierarchical Regression Analysis for Variables of the Social Reactive Pathway explaining Energy Drink Consumption, including Sport Activity, Attitude, Prototype Perception and Willingness (N = 213)
Variable B SE B ß Sig. R R2
ΔR2
F (df)
Step 1
Sport Activity 0.010 0.031 0.021 0.757
Model 1 summary 0.757 0.021 0.000 0.000 0.096 1, 211
Step 2
25 Sport Activity Direct Attitude Positive Attitude Negative Attitude Prototype Perception Prototype Similarity 0.851 0.116 -0.195 0.009 0.360 0.117 0.143 0.191 0.212 0.108 0.497 0.051 -0.064 0.003 0.206 0.000 0.417 0.308 0.965 0.001
Model 2 summary 0.000 0.596 0.355 0.355 22.693 5, 206
Step 3 Sport Activity Direct Attitude Positive Attitude Negative Attitude Prototype Perception Prototype Similarity Willingness 0.022 0.477 0.048 -0.251 -0.028 0.314 0.534 0.024 0.135 0.137 0.181 0.202 0.103 0.111 0.047 0.278 0.021 -0.083 -0.009 0.180 0.361 0.376 0.001 0.724 0.168 0.890 0.002 0.000
Model 3 summary 0.000 0.649 0.421 0.066 23.374 1, 205
Predictive Value of Prototype and Willingness regarding Energy Drink Consumption
26
= 77.605, p < 0.000), with an R2 of 0.379. Including Willingness (ß = 0.524) leads to a decline
[image:27.595.73.528.269.727.2]of the explanatory value of Prototype from (ß = 0.282) to (ß = 0.189). In the end, these findings reveal, that Willingness (ß = 0.524) significantly explains EDC, which is mediated through the Social Reactive Pathway.
Table 6
Hierarchical Regression Analysis for Variables of the Social Reactive Pathway explaining Energy Drink Consumption, including Sport Activity, Prototype Perception and Willingness (N = 213)
Variable B SE B ß Sig. R R2 ΔR2 F (df)
Step 1
Sport Activity 0.010 0.031 0.021 0.757
Model 1 summary 0.757 0.021 0.000 0.000 0.096 1, 211
Step 2
Sport Activity
Prototype Perception Prototype Similarity
0.016
0.560 0.493
0.029
0.218 0.120
0.034
0.176 0.282
0.595
0.011 0.000
Model 2 summary 0.000 0.384 0.148 0.148 18.070 2, 209
Step 3
Sport Activity
Prototype Perception Prototype Similarity
Willingness
0.026
0.076 0.330
0.775
0.025
0.195 0.104
0.088
0.056
0.024 0.189
0.524
0.308
0.698 0.002
0.000
27 Reasoned Pathway and Social Reactive Pathway, Competing to Explaining Energy Drink Consumption
Investigating further, whether the Reasoned or the Social Reactive is predominantly explaining EDC, finally a fifth regression was conducted, in which all variables of the PWM, significantly correlating with EDC, are included. Therefore Subjective Norm was left out. The hierarchal multiple regression analysis revealed the following. When all variables of the PWM are included in the regression, 78.5% of the variance are explained (F(2, 204) = 69.098, p < 0.000), with an R2 of 0.616. Furthermore, Intention (ß = 0.636) appears to be the main variable, significantly (p < 0.000) explaining EDC compared to the Direct Measure of Attitude (ß = 0.084) and especially Willingness (ß = 0.120). Therefore, it can be concluded that EDC is predominantly explained by Intention, which is mediated through the Reasoned Pathway.
Table7
Hierarchical Regression Analysis for Variables of the Prototype Willingness Model explaining Energy Drink Consumption, including Sport Activity, Attitude, Prototype Perception, Intention and Willingness (N = 213)
Variable B SE B ß Sig. R R2 ΔR2 F (df)
Step 1
Sport Activity 0.010 0.031 0.021 0.757
Model 1 summary 0.757 0.021 0.000 0.000 0.096 1, 211
Step 2
Sport Activity
Direct Attitude Positive Attitude Negative Attitude
Prototype Perception Prototype Similarity
0.016
0.851 0.116 -0.195
0.009 0.360
0.026
0.117 0.143 0.191
0.212 0.108
0.034
0.497 0.051 -0.064
0.003 0.206
0.544
0.000 0.417 0.308
0.965 0.001
28 Step 3 Sport Activity Direct Attitude Positive Attitude Negative Attitude Prototype Perception Prototype Similarity Intention Willingness -0.004 0.144 0.055 -0.175 0.052 0.027 0.911 0.178 0.020 0.115 0.112 0.148 0.165 0.088 0.090 0.097 -0.008 0.084 0.024 -0.058 0.016 0.016 0.636 0.120 0.854 0.212 0.623 0.239 0.755 0.760 0.000 0.068
Model 3 summary 0.000 0.785 0.616 0.261 69.098 2, 204
Main Findings of the Result Section
To summarize the results, the following can be conceded. First, several analysis have revealed that the time spend participating in Sport Activities does not explain EDC. Staring with comparing means and conducting an ANOVA (table 2). Further, the correlation analysis revealed no association (table 3). Then, examined through multiple regression analysis, supported these findings and make clear that time spend participating in Sport Activities is not valuable to explain EDC (table 4, table 5, table 6, table 7).
Second, it was investigated how far EDC can be explained through the Reasoned and Social Reactive Pathway. Therefore, the correlation analysis (table 3) served to detect significant variables valuable to analyse during the hierarchal multiple regression analysis. Subjective Norm was found to be trivial and was therefore excluded. Further, it was found that Intention, Willingness and Direct Attitude were significantly moderate positive correlating with EDC and that these variables were correlating significantly among each other as well. Therefore, the multiple regression analysis served to find the most explanatory variable of the PWM.
29
to the regression analysis, those two variables stand in the shadow of Intention (table 7). The added explanatory value of Willingness to the PMW is obviously minor, comparing the explanatory value of table 4 (r = 0.780) without Willingness and the explanatory value of table 5 (r = 0.785) including Willingness. Therefore, it can be concluded that Intention is the main explanatory variable of the PWM, mediated through the Reasoned Pathway.
Discussion
Summary of Results and Literature Review
The overreaching goal of this research was to understand whether people participating more in sport activities are more prone to EDC, and what the underlying factors explaining this health risk behaviour are. In line with that, the PWM served as a model to explain EDC. Within this model it was investigated whether EDC was better explained by the Reasoned Pathway, or Social Reactive Pathway.
Starting with the discussion of the results regarding the first research question: ‘Is the time spent on sport activities predicting the health risk behaviour of energy drink consumption?’. This research did not reveal an explanatory effect of time participating in Sport
Activities on the EDC, since there is no significant association between EDC and Level of Sport Activity. This is not in line with what literature regarding EDC and time spending on Sport Activities revealed. Research by Fields (2015) indicated that 69.3% of athletes were consuming ED within the past month. Moreover Buxton and Hagan (2012) had found that 62.2% of student athletes consumed at least on ED per week, which are higher percentages compared to the EDC of non-athletes. According to that, 53.8% of the 12-18 year old teenagers in high school drank ED at least 1-2 times a week (Statista, 2015). Further, solely 11% of the adults between 18-29 drunk energy drinks during the past year (Zucconi et al., 2013).
Possibly the results can be explained, by the fact that not enough known unknown, why participants did or did not participate in Sport Activities and why they did or did not consume ED. Participants could participate in Sport Activities for different reasons and consume ED for different reasons. On one hand, one could participate in Sport Activities, to improve athletic performance and therefore consumes ED, because he believes that an ED would help. On the other hand, another participant does no sport at all, but consumes an ED as tool to be more awake during a party. This could be an effect leading to find no impact time participating in Sport Activities is explaining EDC. This would support the findings that Attitude towards ED is important to explain EDC.
30
athletes of a sport academy, under the age of 18, who are living at home, well supported by their parents. The parents are taking care of their children and their development, by paying a fees for their children to participate and bring them to the academy several times per week. These parents might be the main cause why these young athletes in this sample do not consume ED. This is different compared to research by Fields (2015) and Buxton and Hagan (2012), who did research on sport students, who are above 18. In addition to that, the participants who are above 18, do not participate in sport activities on a high level. These differences within the sample might explain that the findings do not match the expectations, based on the introduction.
In addition to that, it might have been influential regarding the results, that it was not concrete enough explained what hours participating in sport activities meant. Participants stated for example that they did walk 7 hours per week and considered that as doing sport. Others stated that they play football 4 times a week. Thus, someone who walks 7 hours per week would ends up in the same group of people, as someone who plays football 4 hours per week, even though 4 hours playing football is defiantly more exhausting than 7 hours walking. Therefore, it should have been explained more clearly to the participants, what the term ‘sport’ means.
In the end, time participating in Sport Activities is apparently not the most suitable measure, to find an association between EDC and Sport. It would have been better to categorize the participants into groups not solely by the time participating in sport activities, but also into groups based on how good these people and on which level these people are performing their sport. Further, it could have been asked, how important sport and athletic performance is to them. This would have helped to categorize the participants more valid into the sport group they belong to.
Continuing with discussing results regarding the second research question: ‘Is Time participating in Sport Activities a predictor of Energy Drink Consumption, and is this mediated through the Reasoned Pathway?’, the results showed that EDC can be explained by Attitude
and Intention mediated via Reasoned Pathway. This is in line with research explaining health risk behaviour, such as EDC, via the Reasoned Pathway (Lewis, 2017; Brand &, Koch, 2016). According to Brand and Koch (2016) Intention was the main predictor of taking caffeine pills and alcohol consumption as well. No research have been conducted regarding EDC and the PWM, but research regarding alcohol consumption revealed Intention as main construct explaining that health risk behaviour (Lewis, 2017). Therefore, the findings of this study revealing the importance of Intention, do support earlier findings towards similar health risk behaviour.
31
the Reasoned Pathway explaining EDC, just as earlier research revealed that Attitude is important to exert health risk behaviour like binge drinking (Lewis, 2017). Thus, the findings support that Attitude is just as important explaining EDC, as it is to explain participation in binge drinking behaviour.
In addition to these findings, Subjective Norm did not add an explanatory value regarding EDC, which is in line with earlier research, not highlight Subjective Norm as an important factor explaining EDC or other similar health risk behaviour (Lewis, 2017; Brand &, Koch, 2016). In the end, since the Reasoned Pathway of the PWM is the basically the TPB by, the question arises whether the TPB could explain EDC just as good and whether the PWM add something compared to the TPB. Whether the PWM can add explanatory value will be discussed regarding the next research question.
Further, the results regarding the third research question, ‘Is Time participating in Sport Activities a predictor of Energy Drink Consumption, and is this mediated through the Social Reactive Pathway?’ will be discussed. The results revealed that the variable Prototype
Perception, had a small, still significant explanatory value regarding EDC. In more detail, Prototype Similarity was the measure of importance. Furthermore, Willingness explained EDC significantly as well. Still, these findings were solely present, when the Social Reactive Pathway is analysed separately. When the variables of the Reasoned Pathway were added, the Social Reactive Pathway, had no significant explanatory importance. This is in line with research by Lewis (2017) revealing that the Reasoned Pathway, including Attitude and Intention is explaining health risk behaviour such as binge drinking. Furthermore, Brand and Koch (2016) found that Attitude and Intention are explaining caffeine pill intake. These health risk behaviours are similar to EDC and therefore those findings are supporting the results of this study, that not the Social Relative Pathway, but the Reasoned Pathway is explaining such health risk behaviour.
32
Willingness to perform them, whereas EDC is predominantly a reasoned decision, based on the Intention, to perform such behaviour.
To conclude the discussion of the results, the findings of this research are revealing that there are other underlying factor influencing the EDC among all participants in general, whether they participate in sport activities or not. According to the findings of this study, the main factor influencing EDC is the Attitude regarding such beverages, which influences Willingness and Intention resulting in EDC. This shows the importance of changing the Attitude of people regarding ED to reduce EDC, which is important, since beside positive effects of EDC, adverse health effects are present.
Limitations and Qualities
Qualities. Starting with the qualities of this study. The sample size of this study it can be stated that 213 participants is an acceptable quantity. Furthermore, the sample profile included not solely students and relatives, but around 40 participants, who were football players at a youth academy, which provided valuable data regarding High Sport Activity.
In addition to that, the participants were including a large range regarding age form 9 years old to 75 years old, trying to improve the generalizability of the research. Further, one could search for age differences investigate the Still, this might have caused problems regarding the validity of the data, since the data was not specify enough
In line with an attempt to improve the generalizability, participants did not solely came from the Netherlands, but form different countries. On the other hand, this might also be a limitation, because the questionnaire needed to be translated, which might cause different answers to the questions. Man and woman were nearly equally included in this study, which provides the possibility to investigate gender differences.
The main quality of this study, is that it provides valuable theoretical information regarding the value of the PWM possibly explaining health risk behaviour such as EDC. This study revealed that the PWM did not add important explanatory value compared to the TPB.
33
Furthermore, it is important to mention that the questions regarding Sport Activity, were open questions, which was a limitation of the data and data analysis, because participants stated for example that they do sport 4 times per week, and further stated playing basketball. The researcher, interpreted this as 6 hours doing sport, which indicates a researcher bias, which might have an influence on the results. In the end, the hours participating in sport activities is not always the true score of participants, which influenced the validity of the result negatively. In line with that, the definition of participation in sport was not clear enough and gave too much space for interpretation. This also influenced the results, since no true sport activity score could be identified. Due to that, the results, might be biases, since people possibly randomly state how much sport they do, which then, makes it difficult to find an association between EDC and sport activity and draw a conclusion. Therefore, the result that Sport Activity has not association with
EDC should be stated cautiously.
Finally, another important limitation was the definition of the different groups participating in Sport Activities by the EAFS, and might have biased the findings. The categorization of Low-, Average-, and High Sport Activities (<1.5, 1.6-3.5, 3.6<, hours per week) did not include a category specified for participants, who were participating in sport activities more than 3.6 hours per week. This led to 49.3% of the participants categorized into the high sport activity group, because it could not been made a distinction between someone who participates 4 hours or 15 hours per week in sport activities. This makes it difficult to compare the findings of this study with earlier research by Fields (2015) and Buxton & Hagan (2012) who revealed finding of chronic EDC (62.2% & 69.3%), among athletes. Furthermore, this might have influenced the results in such a manner, that the findings might be not valid. Therefore, the findings that Sport Activity has no association with EDC at all, should be interpreted with caution, and not being overestimated as providing valid evidence.
Recommendations for Future Research
34
the comparability with earlier research regarding athletes and EDC and add more specific information regarding that supposedly at risk group. Furthermore, regarding sport activity, a future questionnaire should consist of closed questions indicating how many hours or days per week they are participating in sport activities. In line with that, the participation in sport activities should be defined not only by hours, but also by level of intensity. Sport Activity could be defined by heart rate and a detailed description of Sport Activity with examples.
Continuing with deriving recommendations, based on the findings which revealed that participant’s Attitude, Willingness, but especially Intention are main factors explaining EDC. Future research should specifically search for the underlying factors explaining the Attitude, Willingness, and ultimately the Intention. This study was mainly focussing on the explanatory value of Sport Activity regarding EDC, and further was seeking for additional explanatory factors. Since, according to the findings, Intention is the main factor explaining EDC, future research should investigate more detailed, why someone has the Intention to perform EDC. Asking questions to figure out, when and why someone has the intention to perform EDC and when not. Thus, exploring further, which distal variables are influencing the Intention? Question could be formulated as following: ‘I have the intention to consume an Energy Drink, when I want to perform well’ or ‘…when I want to stay awake’ or ‘…when I want to have fun’.
These are merely examples how future research could investigate in more depth the variable Intention. In line with that, it could be investigated more detailed, how the environment influences someone to perform EDC and ask specific question about events in which someone drinks an energy drink. Hence, this would reveal partly the underlying factors of EDC, which supports research regarding that field and possible intervention design.
Furthermore, during one follow up research, it could help, to ask participants about their knowledge of beneficial effects and adverse health effects. Then, providing participants with information regarding those effects, and afterwards investigate whether the attitude, willingness or intention changed. This was not investigated during this study and could reveal how important knowledge about ED is, to actually perform EDC. To summarize, it is recommended to improve several aspects regarding the current study, investigating the association between Sport Activity and EDC. Furthermore, it is recommended to seek for underlying factors explaining the Attitude, Willingness and Intention to perform EDC, by scoping into these variables.
35
Based on the main findings of this study practical implications are proposed. First, EDC and time participating in Sport Activities showed no association. Therefore, it is difficult to suggest valid practical implication regarding Sport Activity. However, a possible practical implication regarding Sport Activity might be, since Sport Activity is not an explanatory variable of EDC, that it is not valuable to conduct an intervention targeting at people highly participating in Sport Activities to reduce EDC. On the other hand, an intervention targeting at people, who are participating little in Sport Activities to reduce their EDC, is not valuable as well, since there is no association between EDC and Sport Activity at all. Nevertheless, it should be cautiously concluded that EDC and Sport Activity deserve no focus at all, since the results of this study might not be valid and earlier research has revealed an association between these two constructs.
Continuing with the findings that Attitude, Willingness and more crucial Intention, are explaining EDC significantly, the following practical implications might be useful. Firstly, Psychologists developing interventions regarding EDC should target the Attitude regarding EDs and EDC. Furthermore these interventions should focus on the Willingness of EDC as well, but the most important construct to target the intervention on is the Intention to perform EDC. Therefore based on the results of this study, Prototype and Subjective Norm can be excluded during the intervention design. Furthermore, based on a theoretical foundation the Social Reactive Pathway (r=0.785) does not add significantly more explanatory value to the Reasoned Pathway (r=0.780). Therefore, these findings provide some evidence, revealing that the Social Reactive Pathway of the PWM, does not add more explanatory value, regarding health risk behaviour, such as EDC, compared to the TPB, which is basically the Reasoned Pathway of the PWM. Further, these findings might also be important for politicians and policy makers, and insurance companies, who are mainly responsible for financial support regarding targeting to reduce EDC. In line with that, the findings serve people in this society, becoming more aware of how EDC, and therefore possibly similar health risk behaviour, can be explained. To summarize the practical implications, it can be stated that some practical implications, regarding the main findings concerning EDC, can be proposed, which are possibly contributing to support education of society as a whole.
Conclusion
36
was categorized in No EDC, Chronic EDC (1-2 days per week), and High Chronic ED (3-7 days per week). Moreover, participation in sport activities was categorized in Low Sport Activity (<1.5 h per week), Average Sport Activity (1.6-3.5 h per week), and High Sport Activity (3.6< h per week). It was found that there is no significant difference between the Sport Activity groups on EDC, and furthermore, no correlation, thus association, was found between EDC and Sport Activity. Therefore in the end, time participating in Sport Activities has no explanatory value regarding EDC.
Furthermore, it was investigated whether EDC could be explained via other Variables of the Prototype Willingness Model mediated through the Reasoned Pathway, or the Social Reactive Pathway, of the PWM. The Reasoned Pathway included the independent variables Attitude and Subjective Norm, and Intention, influencing the dependent variable EDC. Further, the Social Reactive Pathway included the independent variable Prototype Perception and Willingness, influencing the dependent variable EDC. It was found that predominantly the Direct Measure of Attitude (r=0.531), and more important the Intention (r=0.684), mediated through the Reasoned Pathway have an explanatory value on EDC. Further, Willingness mediated through the Social Reactive Pathway (r=0.524), had and explanatory value on EDC as well, but was not significantly adding more explanatory value to the whole model (r=0.785). Therefore, since the Reasoned Pathway is explaining EDC (r=0,780) highly significantly, it can be stated that the Prototype Willingness Model, including the Reasoned Pathway and Social Reactive Pathway, does not have an significantly higher value explaining such health risk behaviour as Energy Drink Consumption, than the Theory of Planned Behaviour, which is basically consisting out of the Reasoned Pathway.
![Working towards telecom 2000: launching the programme Race [R&D in Advanced Communication Technololgies in Europe]. COM (88) 240 final/2, 31 May 1988](data:image/gif;base64,R0lGODlhAQABAIAAAP///wAAACH5BAEAAAAALAAAAAABAAEAAAICRAEAOw==)