J. Phys. Chem. Solids Pergamon Press 1968. Vol. 29, pp. 1987-2000. Printed in Great Britain.
THE OPTICAL ABSORPTION OF THE NEUTRAL
VACANCY IN DIAMOND
M. LANNOO
Institut Sup&ieur d’Electronique du Nord, Lille, France and
A. M. STONEHAM
Theoretical Physics Division, AERE Harwell, Berkshire, U.K.
(Received 29 Februaty 1968)
Abstract- Optical absorption by the neutral vacancy in diamond has been predicted to occur between the ground ‘E state and the IT, excited state. Both these states are orbitally degenerate and should show Jahn Teller distortions. We have calculated the Huang-Rhys Factor for the transition (the fraction of the intensity in the zero phonon line) and the first and second moments of the absorption band. Also we discuss the response of the zero phonon line to externally applied stresses. Our model assumes that the vacancy interacts with just six modes, corresponding to the normal modes of the neighbours of the vacancy. The coupling of the electronic and nuclear motion is estimated from an LCAO model.
The results are compared with observations of the GRI band, which has been attributed to the vacancy. The predicted Huang-Rhys factor S - 3.7 and the first and second moments of the band support this identification. Further our model predicts that luminescence from this band should be unpolarised, as observed. However the predicted stress splitting of the zero phonon line differs from that observed. Possible explanations of this are discussed.
1. INTRODUCTION
THE PRIMARY defects in diamond- such as the vacancy and the interstitial- have still to be identified with any certainty. The optical GRl band has been suggested as arising from the neutral vacancy, V’, although other models have been proposed. Theoretically work has concentrated on energies of formation [ 1,2], on the positions of the bands associated with the primary defects [3-61 and on the existence and magnitude of the Jahn-Teller effect [7-91. Here we concentrate on the form of the band arising from the neutral vacancy.
The various treatments of the vacancy[3,4, 61 are generally in qualitative agreement on the low lying levels. Only excited states should give spin resonance, and the optical transition energy is less than one would pre- dict on a one-electron model. It is hard to devise means of distinguishing the vacancy and interstitial[5] for the structure of the low lying energy levels is predicted to be similar,
and it is difficult to make accurate calculations of the transition energies. This difficulty is enhanced by the existence of the Jahn-Teller effect, although it probably affects the shapes of the optical bonds more severely than the transition energies.
The form of the absorption band is measured by the Huang-Rhys Factor, S, which gives a measure of the fractional intensity in the zero phonon line, the Stokes shift and the band- width[lO-131. WhenSissmall,asfortheGRl band, a sharp zero phonon line should be seen. For centres with large S, such as F centres in alkali halides, only a broad, nearly Gaussian, line is seen. The Huang-Rhys factor appro- priate to the GRI band has been measured experimentally [ 14- 161. We calculate the Huang-Rhys factor for the neutral vacancy (Section 4) and compare our predictions with these measurements on the GRl band.
1988 M. LANNOO and A. M. STONEHAM
external uniaxial stress. Experimentally the uniaxial stress method is a very sensitive way of determining the symmetry of a centre. The method has been used by Runciman [ 171 and Crowther[ 181 on the GRl system, and our results for the vacancy are compared with their data.
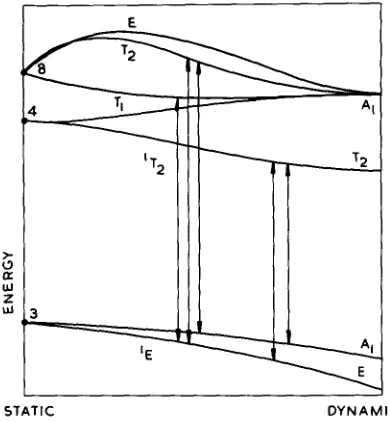
The calculations described here refer only to the neutral vacancy. It is necessary to ask if the centre giving rise to the GRl band and the vacancy are identical. In Section 6, where we compare our calculations with experiment, we find the Huang-Rhys factor suggests the two centres are the same. The stress splitting data is also consistent with the identification, but only if the Jahn-Teller effect is important in a rather complicated way. One simple conclusion is possible: if the data are quali- tatively inconsistent with the GRl centre being the vacancy then they are also incon- sistent with it being the neutral interstitial. This can be seen very easily by recalling that the relevant low lying energy levels are the same in both cases. Figure 1 compares them.
2. THE STATIC JAHN-TELLER EFFECT
The optical transition of lowest energy for the neutral vacancy is believed to be from a ‘E state to a ‘Tz excited state[3,4]. Both these states have electronic degeneracy, so that the Jahn-Teller theorem requires that they distort, with a corresponding lowering of energy.
We assume that only the nearest neighbours of the vacancy contribute to its interaction with lattice distortions. As the vacancy wave function is reasonably compact and there are no long range eia&e&atic interactions this may be quite a pa9 assumption. There are four neighbours, so their configuration can be described by twdve normal coordinates. Three are rotations and three translations; these we ignore. The remaining six are the A1 mode, Qa, the E modes Q, and QO, and the T2
modes Q,, Q, and Q,. The Qa mode is the ‘breathing’ mode in which all the neighbours move symmetrically. The E modes correspond to tetragonal distortions; under TdQs trans-
ENERGY (EV>
-4
5 A-
-3 2
I T2 -2
5
_i
A2 ‘T2 -I
3T, 3T, ‘E ‘E L
(a> (b)
-
The two dimensional form is because ‘E is doubly degenerate. The first term gives the electronic energy for zero Qa, the nuclear kinetic energy and the elastic energy. M is the mass of one Carbon atom and w, is the ‘effective frequency’ for mode a; these freauencies are discussed in more detail in
Fig. 1. Energy levels of the neutral vacancy and interstitial in diamond. (a) The neutral vacancy[ 11, and(b) the neutral
interstitial[3].
forms like 2x2 - y2 - z2 and Q, like y2 - z2. The T2 modes describe trigonal distortions. Exact definitions of the modes in terms of the dis- placements are given in the Appendix.
OPTICAL ABSORPTION IN DIAMOND 1989
the next section. The terms proportional to I,, give rise to the Jahn-Teller effect, and it is easily shown from (2.1) that Q0 and Qc oscillate about Q,, and Q, where
Q;,+ Q:, = {Z,I(Mu;) I”. (2.2)
In the absence of the Jahn-Teller term all the coordinates oscillate about their zero values. When IBE is finite the degeneracy of Ie> and )8> is lifted, and the ground state energy reduced by
AEaE = 1&,/2Mo;. (2.3) The new equilibrium configuration is not determined completely by (2.2), which only relates Q, and Q,,. This ambiguity is a result of the simple Hamiltonian (2.1), and its neglect of higher order terms. These higher terms fix both Q,,/Q, and the sign of QgB. The relative values of Q,, and Qse are deter- mined by the crystal symmetry-in a cubic crystal one expects tetragonal rather than orthorhombic distortions. For a tetragonal distortion along the x axis Q,, = 0, so
IQ,oI = lIalI(M&). (2.4) Equivalent results hold for y and z tetragonal distortions. The sign of Q,, for the x dis- tortion can only be fixed by detailed know- ledge of the higher order terms. We work with both possibilities throughout. Later we find that Qoe < 0 ( IE> ground state for an x tetragonal distortion) is more consistent with the stress splitting data for the GRl band. In some ways this is surprising, for Q,, > 0 causes the neighbours of the vacancy to move together in pairs. As there is a strong tendency to form pairwise bonds, one might expect Q,, > 0 to be favoured by enhanced bond- ing[ 11.
The ‘T2 state comprises three electronic states I( > 17) > and 15 >, degenerate when all the Q, are zero. We will assume that the equilibrium values of Q,, the breathing mode, are identical in the ‘E and ‘T, states. This assumption is made because ‘E and lT, are both derived from the same electronic con-
figuration. Such as assumption would of course, be quite inappropriate for the F centre in alkali halides, where the initial and final states derive from different configura- tions. The vibronic Hamiltonian for the ‘T,
state is more complicated than (2.1) because there are terms linear in all five remaining coordinates. In the following expression we assume that the effective frequencies, w,, are the same as in the ground state Hamiltonian. Again this should be reasonable because the two electronic states derive from the same configuration.
- - +
@4~,~ Qa2II
.
+ I,, . -Qo+d3Q, *
-Qe-d3 Q
+I,, (2.5)
The terms in ZeE and I,, are responsible for the Jahn-Teller effect. With this vibronic Hamiltonian one of two different types of distorted configuration can give a minimum in the energy. If the stable configuration is tetragonally distorted the energy reduction is
Ia AE,E = 4 -.
2M o&2 (2.6)
Alternatively if trigonal distortions give the stable configuration
AE = j
IO
eT 32MwT2’1990 M. LANNOO and
Our conclusion ($3) that wE = d207 leads to a trigonal minimum, using the data in Table 1. Thus we predict a tetragonally distorted ‘E ground state and a trigonally distorted ‘T, excited state. The difference in symmetry in the two cases combined with the degeneracy of both the ground and excited states makes the present problem rather complex.
A. M. STONEHAM
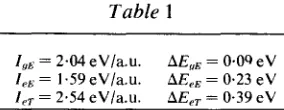
Table 1
I, = 244 eV1a.u. AE, = 0.09 eV I,, = 1.59 eV/a.u. AE,, = 0.23 eV I,, = 2.54 eV/a.u. AE., = 0.39 eV
The values of I,, ZeE and I,, given in Table 1 have been calculated using an LCAO model for the vacancy, In this model[9] the atomic orbitals from which the defect electron wave functions are constructed move rigidly with the nuclei with which they are associated. All calculations of Jahn-Teller integrals introduce
approximations, so these results are best considered as order of magnitude estimates. In principle these integrals can be found from experimental uniaxial stress data. This is discussed in Section 5.
3. THE LATTICE SYSTEM
The effective frequencies oE and wT were introduced in equations (2.1) and (2.5) to describe the elastic energy assoc- iated with distortions of the environment of the vacancy. These terms in oE and or limit the Jahn-Teller distortion.
There are two important frequencies in our problem-one for E modes and one for T modes. One of the most severe approximations in this calculation is the assumption that we can use a small number of discrete frequencies instead of a distribution of frequencies. The ratio of oE and oT can be calculated on a simple model. In this the neighbours of the vacancy are the only atoms allowed to move, the rest of the lattice remaining fixed. If the atoms interact by nearest neighbour central forces then [83
WE= V26JT. (3.1)
The assumption that only the neighbours move is very primitive, although it is qualitatively consistent with the assumption that only these neighbours contribute to the electron-phonon interaction. The conclusion that wE > wT can, however, be seen rather easily. In creat- ing the vacancy several bonds were broken. These bonds contributed more to the elastic energy in T distortions than in the E moles. In choosing a value for oE we assume, rather arbitrarily, that it is equal to the Raman frequency. This is because the density of vibrational states in diamond is peaked near this energy, which forms an upper bound to the phonon energies in the perfect lattice. With equation (3.1) we find
fiwE = 0.165 eV; fioT = 0.095 eV. (3.2)
In fact UT lies very ClOSe to the effective phonon
energies for the GRl band which is sometimes associated with the neutral vacancy. As we will find the T, modes most important this is encouraging. In fact the one phonon part of the GRl band has a peak at O.O40eV, so it is clear that phonons over a range of ener- gies are important. This particular peak is very stress sensitive [ 181 suggesting a localised resonant mode.
With these figures for the lattice frequencies we obtain the energy lowerings due to the Jahn-Teller effect from equations (2.3), (2.6) and (2.7). These are shown in Table 1. The trigonal distortions are favoured in the excited state by a fairly small margin. In the ground state the distortion amplitude is ]&I = 0.05 A from (2.4).
OPTICAL ABSORPTION IN DIAMOND 1991
the dynamic case. The possibility of dynamic effects can be seen by noting AE,, is only 0.09 eV (=k. 1100”) and must equal or exceed the barrier for reorientation. The GRl sys- tem, sometimes attributed to the vacancy, is visible up to 900”K, although the zero phonon line is not visible above about 400°K. Rapid tunnelling (the dynamic effect) should show more readily on the zero phonon line. Further calculations are in progress on this point.
We are also interested in the vibronic Hamil- tonian near to the absolute minima in the distorted configurations. When there is no Jahn-Teller effect there is only one minimum, at Q = 0. The energy surfaces are determined by the elastic energy, of the form:
The Jahn-Teller effect in the ground state leads to three equivalent minima, correspond- ing to the three possible tetragonal distortions. Near each minimum the energy surface has a modified form. Thus for the tetragonal minimum at (QO, Qe) = (Qge, 0) we have in- stead
+Q,P>l
The second frequency, &, is related to tiE, to the energy barrier between the tetragonal distortions along different axes, and to the Jahn-Teller energy AhE,,. Qualitatively the important features are shown by the results for low barriers:
Our choice of We is not too important, for the corresponding coordinate, Qe, has the same value in the ground and excited state minima. Whenever i& occurs we assume it equal to WE, mainly for Simplicity. The ‘CiSSUmptiOn
does imply that the barrier, B, is fairly high, consistent with our assumption of a static
Jahn-Teller effect. Such a high barrier may be reasonable for a system like diamond where mere are strong directional bonds between atoms.
4. THE HUANG-RHYS FACTOR AND THE MOMENTS OF THE LINE
4.1 introduction
The Huang-Rhys factor, S, is a dimension- less parameter which determines the qualita- tive features of optical absorption and emission lines[9-111. It is still a useful para- meter beyond the particular model in which it was introduced, as it is related to the fractional intensity of the zero phonon line and to the mean number of phonons emitted in an optical transition. In this section we will calculate the first three moments of the whole resonance line and the fraction of its intensity in the zero phonon line. The predictions will be compared with experiment in Section 6. Throughout we assume the temperature is absolute zero.
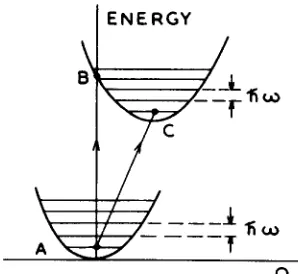
To establish our notation we discuss the system shown ip Fig. 2. This simple example considers a transition between two non-degenerate states interacting strongly with just one phonon mode, Q. The transition A + B in Fig. 2. is the Frank-Condon transition, in which the nuclear configuration does not change. The zero phonon transition is A + C, in which the phonon occupation number is unaltered. Transitions in which the occupation number is changed by 1,2,3... are allowed, and give rise to a broad band.
I
ENERGYB
w
--%5* --
f
Q Fig. 2. Configuration coordinate diagram of a simple system with non-degenerate levels interacting with one
1992 M. LANNOO and A. M. STONEHAM
The Huang-Rhys factor, S,,, is related to the fractional intensity, F, in the zero phonon line by
S, = - 1nF. (4.1)
We adopt this definition for both the simple system and for the vacancy, the subscript 0 is used to distinguish it from other possible definitions mentioned later.
The zeroth moment of the line, M,,, is a measure of the integrated intensity, and is taken to be
M,=Av 2 1 <e 1 R 1 g> 12. (4.2) e
The higher moments are defined by[ 11,121:
Au
x
(<elRlg>12{E,--Eu-hu}n#PM,=
e
AfI c I-lfQP12
e
(4.3) *
for n 1 1. In these expressions lg > is the ground state, le> an excited state, and LR is the dipole operator inducing the transition. The photon energy is hv, and the average is over the vibrational wave function in the ground state.
In our simple example the first moment of the line is related to the Stokes shift (&-EC):
hM, = E,--EC (4.4)
and the second moment to the width, H,, of the band:
PM, = H,‘/8 In 2. (4.5)
In more complicated situations there are no simple relations like these, and calculated moments should be compared directly with measured moments. Unfortun- ately it is often hard to measure moments, because of uncertainties in the background intensity. Theoretically the calculation of the detailed line shape is only possible in very simple models, and for this reason we resort to moments.
It is possible to introduce other definitions of the Huang-Rhys factor through (4.4) and (4.5) viz S = MI/w and S, = M2/02 (M, is the second moment about the centroid of the band). For simple systems S, - S, - S,. We will find, however, that analogous defi-
nitions for complex systems give widely different values for So, S, and S,.
4.2 Vibronic wave functions
We now consider the vacancy, where, in our simple model, both initial and final states are degenerate and interact with six modes. The vibronic (vibrational plus elec- tronic) wave function for the system must be specified further. The important effect of electronic degeneracy is that the simple Born-Oppenheimer approximation does not apply. It is no longer possible to factorise the vibronic wave function T(q,Q) into a vibrational part x(Q) and an electronic part
$(q,Q). In these functions q represents the defect electron coordinates and Q the set of normal coordinates describing distortions of the vacancy environment. If there are N such normal coordinates and the electronic level has degeneracy D then the vibronic functions are usually well described by a linear combination of ND terms each of the form x(Q)+(q,Q). In some special cases the vibronic wave function has a particularly simple form. One such case occurs in the cal- culation of the intensity of the zero phonon line. The states involved in the zero phonon transitions are, loosely speaking, those with the minimum energy configurations in the initial and final states. Near each minimum we may use an approximate vibronic function similar to the Born-Opperheimer form. If the minimum is at Q, = Qem when the elec- tronic state is Im> then the lowest vibronic function near the minimum is
q\Ir, = Im
>a$l
xa(Qa -
Qm) . (4.6)X~ is the lowest harmonic-oscillator wave function for mode CY. This approximation should be acceptable for distortions Q such that the different sheets of the vibrational energy surface are well separated [ 19,201.
OPTICAL ABSORPTION IN DIAMOND 1993
vibrational state. The arguments leading to The suffices E$ refer to the two possible (4.6) allow us to write electronic ground states mentioned in sec-
tion 2. I@ = Ige>l&>
for each of the equivalent Jahn-Teller dis- torted states; Ige> is purely electronic, and I&L) is a vibrational function. We assume Ige> is not sensitive to Q in the neighbour- hood of the ground state minimum. The averages in (4.2) and (4.3) now include averag- ing over the differently oriented distortions in the ground state.
Excited state functions of the form (4.6) can only be used in calculating the zero
4.4 Calculation of the Huang-Rhys factor and moments
We can now calculate S,, from the fractional intensity in the zero phonon line. This is done explicitly for the (13> ground state. Near the minimum energy configuration in the ground state the lowest vibronic function is (by (4.6))
phonon line intensity. When we calculate the
moments of the whole band the vibronic Similarly near the (111) minimum in the ex- wave functions well away from the minima cited state
are needed. In general we have
T 111 -~(lx>+ly>+lz>)~ e le> = 2 aeimlje> Ij;n >
j,m . xa(Qa- Qcd
where the I je > are the degenerate electronic
functions for the undistorted configuration. with corresponding equations for the other
(jm> is a vibrational function in which m minima. The matrix elements of fl connecting
(like p in I&L>) is a label, rather than an these states are products of pgj elements and
occupation number. vibrational overlap integrals:
4.3 Matrix elements of the dipole operator
The dipole operator connects the electronic I dQaxa(Qa- Q,,xa<Q, - Qae> states Ige> and I je>. Defining
= exp /.Lgj= <gelR(je>
( -%(Q, 2h - QaeY} .
where n is the dipole operator, we may find
The fractional intensity in the zero phonon line is then
the relative values of the Fgj by symmetry arguments. If the electric field vector has direction cosines (a, p, y) and the three T2
F=&tV~lCPO~lnlV.‘>/2.
P
states are labelled Ix>,ly>,lz>, then
As in (4.1) we have S, = -1nF; after simpli- /.&,:/.L,g~:/leZ= 2CYZ-_PZ -y fication
If we define the proportionality constant by
peZ = 2aK then the zeroth moment is, by The result for an IE> ground state is also
(4.2) given in (4.8).
1994 M. LANNOO and A. M. STONEHAM
can be simplified by writing them in terms of averages :
(A) =
j’k
M, . (4.9)The average Au is over the vibrational parts of the ground state wave functions, and it also includes averaging over the alternative tetragonally-distorted ground states. The vibrational average must be performed with caution, for the mean values of Q0 and Q, are affected by the static Jahn-Teller effect. Thus for vacancies with a static distortion Q,e we have
A 4Qe) = Qge and, for all (Y or p, at 0°K
A 4
(Qa -
Q,>“I =
WMw2Av(QaQp) = 0 if a + p.
The averages in (4.9) differ from those of [ lo], where the calculation is slightly oversimpli- fied and the Al. factors omitted. Our averages agree with those of Henry, Schnatterly and Slichter[23]. The p factors have a significant effect in the calculation.
The Stokes shift is found from the transition energy of the zero phonon line:
Ezp, = hvo + A& - A.%,
in which hv, is the transition energy for Q = 0, and from the centroid of the band at
E=7ivo+ (A) - (r). (4.10)
The A operator consists of the electron- phonon terms in (2.5), viz
A = leE -Qo+d3 Qc
* -e,43d,
The r operator gives the Jahn-Teller terms in the ground state. Thus for the 10 state which distorts in the X direction r = --Zg0 Q&j. Direct evaluation of (4.10) shows that M,, measured with respect to the zero phonon line, is given by
I 2 IoEzeE IO2 -- - fiM,,= hM,o = 2;;E2 + MoE2 +g MOT2
(4.11) The second moment can be found similarly. Thus
A”M2 = {(A”) - (R)2} + {(r2) - (I?)~} -2{(rN - W)(A)).
This moment is related to the width of the line. After simplification
2
fi2M2, = fi2M2,+ (hct~~)~ . 2 . (4.12)
The second moment is higher for a 10) ground state; the first two moments (M, and M,) were the same for both 10) and 1~) states. As shown by Gold and Kie1[22] the contributions of the uncoupled E and T modes to the first three moments of the line are additive.
In Table 2 we give the values of S,,, -ttM,
and d(fi2M2). Care is needed in comparison
OPTICAL ABSORPTION IN DIAMOND 1995
We can also calculate S1 and S, from Ml and MZ by dividing the E terms by ho, or (r&)2 and T terms by hmT or (~Lo~)~ as appropriate. S, and S, are dimensionless factors like the Huang-Rhys Factor,. and are identical to S, for the simple system we described earlier. For the vacancy we find So = 3.7, St - 5.7 and S, - 9.2, so these three factors are very different.
5. SPLITTING OF THE ZERO PHONON LINE UNDER UNIAXIAL STRESS.
The integrals ZeE, leTI and I, which occur in the Huang-Rhys factor can be measured by observing the effect of uniaxial stress on the zero phonon line. The way in which the zero phonon line shifts and splits under stress, and the additional information given by the use of polarised light, can also be used to determine the symmetry of the centre giving the zero phonon line.
Loosely speaking, the zero phonon line corresponds to a transition from the minimum of energy for the ground state to a minimum in the excited state. Thus we need to know how these minima move under stress to new con- figurations {Q,} and the corresponding changes in energy of the minima. The minima for the unstressed crystal were found by seeking the configuration {Q,,} which minimised the eigenvalues of (2.1) for the ground state, or (2.5) for the excited state. The procedure is exactly the same for a stressed crystal except that we add the work done by the applied stress
before minimising. Here F, isbthe (constant) stress asso- ciated with the strain Q, and 1 IS the unit matrix. The F, are different for different modes, and depend on the direction of the uniaxial stress. They also depend on the changes in elastic constant near a vacancy. To find them we note that a uniaxial stress q would produce a con- figuration in which the Q, have certain specific values, Pa(u), in a perfect crystal without a vacancy. With given effective frequencies (essentially the same as given force constants) a particular set of F, would give a con- figuration Q,(F,) in which Q,(F,) is proportional to F,.
Table 2
Theory Experiment
S0 3.68 3.57
fiM, eV 0.57 2 0.36 (0.33t)
(h2M2c)Li2 eV 0.33
(TYM~~)~‘~ eV 0.39 I so.22 (0.19$) tAE, of Fig. 4.
*A&/2.36 of Fig. 4; for a Gaussian (hM,)“2 = AEJ2.36.
We simply equate
Q,(Fm) = Q,(u) (5.2)
for each (Y and solve for F, as a function of (r. This, of course, ignores the effect cf changes in elastic constant near the vacancy; without rather formidable calculations it can only be hoped that the approximation is not bad. The values of Q,(U) for various stress directions are given in Table 3: othervalues can be found by symmetry.
The effects of uniaxial stress can best be seen by example. First we consider a trigonal (111) stress. The vacancies in trigonally distorted excited states are no longer equivalent; the (1 11) systems-will be affected differently from those with (I? i), (1,1,1) or (1 1 I) distor- tions. The zero phonon line will be split, and the minima will move in {Q,) space. Figure 3a shows the motion of the excited state minima in Qf, Qn, Qr} space. Under the same trigonal stress the three ground state minima, with their x,y and L tetragonal distortions. are not split; they are all symmetrical so far as the trigonal stress is con- cerned. Figure 3(b) shows the motion of the ground state minima in {QO, &[-Qs+ V3Q,], &[-Qe-- V/39,]} space. Secondly we consider a tetragonal (100) stress. The excited state minima are equivalent and so remain de- generate. The ground state minima are inequivalent, and give the splitting of the zero phonon line.
Finally we consider a (110) stress. The results here are most easily seen by recognising that we are only looking for effects linear in the applied stresses. To-this order a (I 10) stress is equivalent to a sum of (11 I), ( I 1 l), (100) and (010) stresses. The first two split the excited state minima. The second two the ground state minima.
Table 3
(100) (111) (011)
QalR QeIR
QAR
~/(‘&cII+~cI,~)
Pl(V3 [co - c121) P/(~~[c,,+~c,,I) -~i(2V’3 Pl(~66[c,, +2c,,l) [cl1 - C,,I I Pk,
1996 M. LANNOO and A. M. STONEHAM
(4 6)
Fig. 3. The effect of a (111) stress on the minima of energy surfaces. The full circles (0) represent the minima In (a) the trigonal minimaof the excited ‘TX state are shown,
in (b) the tetragonal minima of the ‘E ground state.
The predicted splittings and relative in- order terms tend to diverge. This means that tensities for a stress of given magnitude are the tetragonal and trigonal distortions of the given in Table 4. They are linear in the excited state give very similar energies, and
Table 4. Here x,y,z label the tetragonally distorted states and 1,2,3,4 the (11 l), (In), (i,l ,i) and (fl,l) trigonal states. The electric vector E has direction cosines (s/q/2,
-sd2,C)for the (110) (T case, where s2 + d = 1. Also we write 6E = +Z,,Q&);
8T=@eT[Qc+
Q,+
Q,l;
6
=
91,~Qs
0 ground state E ground state
Stress Transition Shift (r intensity v intensity Shift o intensity 7r intensitv
100 x -+ 1,2,3,4 2& 413 1613 -2& 4 0
y,z + 1,2,3,4 - & 20/3 813 & 4 8
111 x,y,z + I -3& 3 0 - 38, 3 0
x,y,z + 2,3,4 Sr 5 8 fir 5 8
110 X,Y + 1,4 --a, &
2 f(4-t 14s”) 213 -$& 4-2~~ 2
X,Y + 23 6(4- 2s’) 6 4 - 2sz 2
z+ 1,4 6,--6< 3(8-8s’) 4/3 --s,--SC 4s2 0
z - 2,3 SE+& %(8-44s’) 0 -&+a< 0 4
OPTICAL ABSORPTION IN DIAMOND 1997
The electric dipole selection rules affect the intensities of the lines. In Table 4 we give the energies and intensities of the different lines. The notation cr and r means that the electric field vector, E, is parallel to the stress
(n) or normal to it (c). For the (110) direc- tion there are two inequivalent (+ polarisations, and we write the direction cosines of E as c(O,O,l) +s(l,l,O)/d2. The results are shown schematically in Fig. 4.
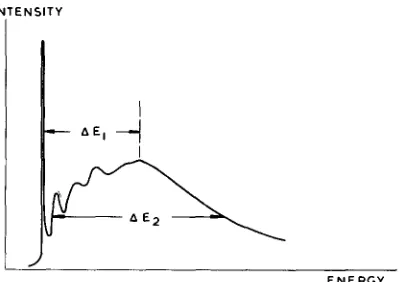
INTENSITY I
I J
ENERGY
Fig. 4. Schematic diagram of the GR 1 band, defining AE, and A&.
6. COMPARISON WITH EXPERIMENT
Two centres observed in diamond have sometimes been identified with the neutral vacancy- the centre giving the optical GRI band and the c system seen in spin resonance. Both are absent in unirradiated crystals and both are observed for all types of irradiation (e-, no or y) with intensity proportional to the dose. Neither show any correlation with chemical impurities. These features suggest that the centres responsible are simple, in- trinsic, lattice defects, and this is supported by other evidence. Under most conditions the ‘c’ system and GRl band intensities are proportional, suggesting that the centres re- sponsible are either identical or closely re- lated (for example one being interstitial and the other a vacancy). Their annealing behav- iour is different, however, so the centres are distinct. As the ‘c’ system centre becomes mobile at a lower temperature it is tempting to argue it is due to an interstitial rather than
a vacancy. The nature of the spin resonance from the ‘c’ system is consistent with either a neutral vacancy or a neutral interstitial; the ground state is diamagnetic with a tetragonal distortion, and the resonance is seen in a low- lying excited state with S = 1. The optical GRl band has thus been associated, rather tenuously, with the neutral vacancy. This was supported by the calculations of[3] which predicted a transition energy of the right size. In this section we compare the properties of the band with our results in Sections 4 and5. The data we use are measured band shapes, which give the Huang-Rhys factor, the polarisation of the luminescence and the stress splitting of the zero phonon line.
The work of Clark and Norris[ 15,241 has shown that the luminescence from the GRl band shows no polarisation at liquid nitrogen or liquid helium temperatures. This is consistent with our model, as emission from any trigonal excited state minimum can go with equal probability to any of the three tetragonally distorted ground states. This can be seen readily by symmetry arguments. The lack of polarisation is a very important result, as it is not predicted by some other models. For example, if the excited state had tetra- gonal minima (AEeE > AEeT) then polarisa- tion would be expected. To get unpolarised luminescence either the Jahn-Teller effect must be negligible (which is inconsistent with the phonon structure of the GRl band) or there must be sufficiently different symmetries in the states between which the transitions occur.
The second set of data come from Duncan’s measurements of the band shape and F, the fraction of the intensity of the zero phonon
line[ 14-161. He measured F and found the Huang-Rhys factor to be
S” = 3.572 0.06
1998 M. LANNOO and A. M. STONEHAM
ture yields an effective phonon energy of CM99 eV, close to our LJ* = O-095 eV. Dun- can also measured the Stokes shift (AE, in Fig. 4) and band width (AE, in Fig. 4). These measurements have been supplemented by estimates of the moments of the band taken from a trace supplied by Dr. Duncan. The data are given in Table 2. The moments are not very accurate as other bands become important in the tail of the GRl band, and it is particularly difficult to estimate MI and
M2 accurately. We see that experiment and theory are in acceptable accord for Ml
and M,. The predicted values are rather larger than the measured ones, but this may be simply a result of difficulties of measurement. Also, the Jahn-Teller integrals (Z,,,Z,, and I,) are very sensitive to the wave functions chosen.
Two sets of stress splitting data are avail- able[ 17, 181. They are generally similar, but the diamonds used for the (110) and (111)
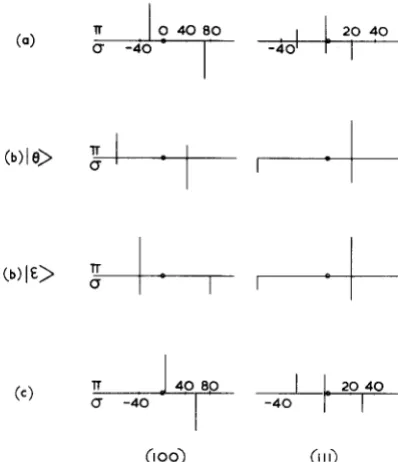
stresses in [ 171 were too poor to be used here. The stress data are summarised in Fig. 5, where they are compared with the theory of the last section. This figure omits the small satellite lines of the GRl zero phonon line. These satellites are present even for zero stress, but their origin is not fully understood. The comparison of the predicted and observed stress splittings leads to these conclusions. First, the (100) stress results are qualitatively similar. The polarisation measurements are only consistent with an Ic> ground state. Secondly, the (1 11) stress results are similar to those predicted only if one ignores one of the observed components. Thirdly, in both the (100) and (111) cases the relative inten- sities of the components do show deviations from the predictions although it is hard to
measure intensities, so some of the discre- pancies are experimental in origin. Fourthly, the (100) splitting which measures I.u~, is
about 60 per cent of the observed value. This is quite good agreement. The (11 I) splitting, however, which measures ZeT, is found to be
(4
6) 1
e>
(b)IE>
Cc)
ll
O 4080
0
-5-
-40 +:+----+p.
J+l--T-A
Tr --s-
CT -40 4o 8o =-+Y
(100) 6 ’ i)
Fig. 5. The stress splitting of the zero phonon line of the CR 1 band, measured experimentally, and the predictions for the neutral vacancy. The theoretical splittings in (b) are qualitative only, to make comparison of intensities easier. The experiments are those of[15] (case (a)) and
[ 161 (case (c)).
results are too complicated to lead to any firm conclusions.
The differences in the magnitudes of the splittings from those predicted can be under- stood, in part, by recalling that we neglected local changes in force constant in Section 5, notably in equation (5.2). The remaining differences, the extra components (both satel- lite lines, and for example, the unexpected line seen in (111) stress) and the discrepancies in the relative intensities of the lines need a more sophisticated explanation.
OPTICAL ABSORPTION IN DIAMOND 1999
particular at low temperatures only the lowest of the ground states will be populated, so some of the lines should be frozen out. Exactly this behaviour is seen from the additional satellite lines, mentioned before. However it has not proved possible to correlate the ob- served transitions with the energy level schemes[25,26] for the dynamic Jahn-Teller effect in E and T states. Nor is it obvious that the luminescence will be unpolarised if the excited state shows a dynamic effect. Fig. 6 shows the energy levels for various degrees of dynamic effect.
The second possibility is that the low-lying
3T, state may have a profound effect on the ground ‘E state. The ‘E state can, of course, only distort tetragonally in a static Jahn- Teller effect. However, when the separation of the lE and 3T, states is very small the electron-phonon interaction couples them in the presence of spin orbit coupling. The
coupled states may have minima with lower symmetry than tetragonal, and this would affect the stress splitting and the selection rules. Further calculations are in progress on this point.
Conclusion
Our aim in this paper has been to answer two questions. First, what are the expected features of optical absorption by the neutral vancancy in diamond? Secondly, are the ob- served features of the GRI band consistent with the properties of the neutral vacancy?
The energy levels of the neutral vacancy have been calculated previously. Our cal- culations have concentrated on the shape of the absorption band, rather than energy levels or oscillator strengths. We have assumed that the vacancy interacts with just six modes, corresponding to normal modes of its nearest neighbours. The relative magnitude of the frequencies of these modes have been esti- mated in a model in which only these nearest neighbours are allowed to move. The coupling of the electronic and nuclear motion has been estimated from an LCAO model in which the
5
a
W
5
3
STATIC DYNAMIC
Fig. 6. The dynamic Jahn-Teller effect. The lowest vibronic states for ‘E IT2 are shown. In the static limit (discussed in this paper) the degeneracy of the levels is indicated. Allowed optical transitions are given: these need not be vertical in the diagram- the ground and
excited states may be dynamic to different extents.
atomic orbitals move rigidly with the nuclei. In addition we have assumed that the Jahn- Teller effect is static. With these assumptions we calculated the Huang-Rhys factor, Stokes shift and band width. Further, we have pre- dicted the absence of polarised luminescence and the character of the stress splitting of the zero phonon line.
2000 M. LANNOO and A. M. STONEHAM
If the GRl centre is one of these two funda- mental defects then the current models must omit some essential features. Two possibilities
were mentioned in Section 6-one that the Jahn-Teller effect should be dynamic, and the other than the low-lying 3T, level had a considerable effect on the properties of the ground ‘E state. Both these possibilities need further study.
15. MITCHELL E. W. J., Science and Technology of Industrial Diamonds. Vol. 1. D. 17. Industrial Dia- mond Information Bureau, London (1967).
16. DUNCAN I., Private communication.
17. RUNCIMAN W. A., Proc. phys. Sot. 86,629 (1965). 18. CROW’I’HER P. A., Private communication. 19. STURGE M. D.,SolidSt. Phys. 20,92 (1968). 20. LONGUET-HIGGINS H. C., Adv. Spectrosc.
2,429(1961).
21. LAX M.,J. Chem. Phys. 20,1752 (1952).
22. GOLD A. and KIEL T. H., Phys. Status Solidi 13,175 (1966).
Acknowledgements- We are indebted to Drs. P. Crow- ther, 1. Duncan, A. E. Hughes, W. A. Runciman and M. D. Sturge for preprints or unpublished data. We have also benefited from discussions with Drs. J. A. D. Matthew, G. D. Watkins and A. B. Lidiard.
23. HENRY C. E., SCHNATTERLY S. E. and SLICHTER, Phys. Rev. 137 A583 (1965).
24. CLARK C. D. and NORRIS C., Diamond Con- ference, Unpublished (1965).
25. O’BRIEN M. C. M., Proc. R. Sot. A281,323 (1964). 26. CANER M. and ENGLMAN R., f. them. Phys.
44,4054 (1966).
REFERENCES
1. SWALIN R. A.,J. Phys. Chem. Solids 18,290 (1961) 2. BENNEMANN K. H., Phys. Reu. 137, A1497
(I 965).
3. COULSON C. A. and KEARSLEY M. J., Proc. R. Sot. 241A, 433 (1957).
4. YAMAGUCHI T., J. phys. Sot. Japan 17, 1359 (1962).
APPENDIX: THE NORMAL COORDINATES 0, We label the neighbours of the vacancy A,B,C and D, where their coordinates are (i, 1, I), (1, i, I), (1, 1, i) and (1,l ,l) respectively. Writing the x displacement of A as X, and so on, the Q, are given below.
5. YAMAGUCHI T., J. phys. Sot. Japan 18, 368 (1963).
6. STONEHAM A. M., Proc. phys. Sot. 88, 135 (1966). 7. LANNOO M., ThPses de Troisieme Cycle, Orsay
(1966).
8. LIDIARD A. B. and STONEHAM A. M., Science and Technology of Industrial diamonds, Vol. I, p. 1.
Q,=~[{-X~+x,+Xc-X,}+(Y~-Y~+Yc-Yv}
+IZ,+Z*-ZC -Z,ll
Qo=&[2{-X,+X,+Xc+Xv]
9.
10. 11. 12.
13. 14.
Industrial Diamond Information Bureau, London (1967).
FRlEDEL J., LAND00 M., and LEMAN G., Phys. Rev. 164, 1056 (I 967).
HUANG K. and RHYS A.. Proc. R. Sot. A208, 352 (1951).
MARKHAM J. J., Rev. Mod. Phys. 31, 956 (1959). PRYCE M. H. L., Phonons in Perfect Lattices and in Lattices with Point Imperfections. (Edited by R. W. H. Stevenson), D. 403. Oliver and Bovd, London (1965).
LEMOS A. M. and MARKHAM J. J.,J. Phys. Chem Solids26, 1837(1965).
![Fig. 1. Energy levels of the neutral vacancy and interstitial in diamond. (a) The neutral vacancy[ 11, and(b) the neutral interstitial[3]](https://thumb-us.123doks.com/thumbv2/123dok_us/8192152.1368236/2.504.276.445.60.274/energy-neutral-vacancy-interstitial-diamond-neutral-vacancy-interstitial.webp)