Research Article
1
Iron depletion Reduces Abce1 Transcripts While
2
Inducing the Mitophagy Factors Pink1 and Parkin
3
4
Jana Key 1,2, Nesli Ece Sen 1, Aleksandar Arsovic 1, Stella Krämer 1, Robert Hülse 1, Suzana Gispert-Sanchez 1 and Georg Auburger 1,*5
1 Experimental Neurology, Goethe University Medical School, 60590 Frankfurt am Main;
6
2 Faculty of Biosciences, Goethe-University Frankfurt am Main, Germany
7
* Correspondence: [email protected]
8
9
Abstract: Lifespan extension was recently achieved in Caenorhabditis elegans nematodes by
10
mitochondrial stress and mitophagy, triggered via iron depletion. Conversely in man, deficient
11
mitophagy due to Pink1/Parkin mutations triggers iron accumulation in patient brain and limits
12
survival. We now aimed to identify murine fibroblast factors, which adapt their mRNA expression
13
to acute iron manipulation, relate to mitochondrial dysfunction and may influence survival. After
14
iron depletion, expression of the plasma membrane receptor Tfrc with its activator Ireb2, the
15
mitochondrial membrane transporter Abcb10, the release factor Pgrmc1, the
heme-16
degradation enzyme Hmox1, the heme-binding cholesterol metabolizer Cyp46a1, as well as the
17
mitophagy regulators Pink1 and Parkin showed a negative correlation to iron levels. After iron
18
overload, these factors did not change expression. Conversely, a positive correlation of mRNA levels
19
with both conditions of iron availability was observed for the endosomal factors Slc11a2 and Steap2,
20
as well as for the iron-sulfur-cluster (ISC)-containing factors Ppat, Bdh2 and Nthl1. Positive
21
correlation only after iron depletion was observed for the iron export factor Slc40a1, mitochondrial
22
iron transporters Slc25a28, Abcb7 and Abcb8, mitochondrial ISC-containing factors Glrx5, Nfu1, Bola1
23
and Abce1, cytosolic Aco1 and Tyw5, as well as nuclear Dna2, Elp3, Pold1 and Prim2. The latter are
24
regulators of nucleotide synthesis and DNA quality control, which have known importance for
25
growth and lifespan. The only Pink1-/- triggered transcript modulation was the reduced expression
26
of the ISC-containing ribosomal factor Abce1. These mammalian findings support previous fly data
27
that Pink1 influences co-translational quality control via Abce1, as well as mitophagy. Our findings
28
provide the first systematic survey how iron dosage triggers homeostatic transcriptional regulations
29
and elucidate how iron deprivation results in mitophagy.
30
Keywords: ferric ammonium citrate, deferoxamine, 2,2′-bipyridine, iron homeostasis, ISC,
31
mitochondrial clearance, longevity, starvation, Parkinson’s disease
32
33
1. Introduction
34
Human desire to modify longevity by extrinsic factors such as diet or by modulation of gene
35
activity has triggered intense research. We want to shorten the survival of cancer cells [1] and to
36
prolong lifespan for patients with neurodegenerative disorders [2]. In absence of disease, it is our
37
goal to extend the health period far into old age. Preliminary insights into the underlying mechanisms
38
already exist. Lifespan extension in model organisms was observed for hundreds of gene defects that
39
trigger dietary restrictions via pathways such as insulin signaling, mTOR signaling, and the
40
mitochondrial energy production. Antioxidant defense, stress resistance, maintenance and repair
41
pathways will maintain fitness and extend survival, while cumulative stochastic RNA/DNA damage
42
events will ultimately determine cell death [3-6].
43
Recently it was shown in Caenorhabditis elegans nematodes that an extrinsic factor, namely iron
44
availability, has a strong impact on lifespan. The suppression of iron uptake by a chelator drug, as
45
well as the silencing of frataxin (Fxn) as a mitochondrial iron-sulfur-cluster (ISC) biogenesis factor,
46
both extended the lifespan via mitochondrial stress and activation of Pink1/Parkin-dependent
47
mitophagy. Downstream effects of this pathological scenario included the elevated expression of
48
globins, which bind to iron in the form of heme [7]. It was also reported that natural inducers of
49
mitophagy, such as urolithin A, can extend lifespan in C. elegans [8]. We were intrigued by these
50
observations, since a converse situation is observed in man: Defective mitophagy due to Pink1/Parkin
51
mutations shortens the lifespan and leads to the accumulation of iron, in a process that we know as
52
Parkinson’s disease (PD) [9-11].
53
The serine-threonine kinase Pink1 is associated with the outer mitochondrial membrane and
54
plays a major role in the Pink1-Parkin dependent autophagic degradation of damaged or aged
55
mitochondria, a process known as mitophagy [12-14]. Pink1 and Parkin get transcriptionally induced
56
in human neuroblastoma cells after serum deprivation or nutrient starvation [15], linking nutrient
57
restriction to mitophagy. Mutations in Pink1 lead to an autosomal recessive form of PD, which was
58
named PARK6 [10, 16]. Iron distribution is altered in brains of all PD patients [17, 18], with an increase
59
of iron levels in the midbrain substantia nigra [19, 20], where loss of dopaminergic neurons is
60
observed. These findings add to the established theory that iron accumulation contributes to
61
neurodegenerative processes. It remains unclear whether pathological redistribution of the excess
62
iron to ferritin, the labile iron pool and mitochondria occurs, or if altered turnover of iron-containing
63
proteins is responsible for the iron toxicity in PD. One piece of evidence was found in a neurotoxic
64
PD model via 5-day acute exposure to the respiratory complex-I inhibitor MPTP
(1-methyl-4-phenyl-65
1,2,3,6-tetrahydropyridine), where an increase of ferritin light-chain and mitoferritin was
66
documented together with a protective function of mitoferritin overexpression [21].
67
Detailed studies of PD pathogenesis confirmed that (i) Pink1 mutations trigger iron
68
accumulation in the midbrain of patients [22], (ii) Pink1 deficiency-mediated iron accumulation may
69
involve degradation of mitochondrial membrane iron transporters Slc25a37 and Slc25a28 [23, 24], (iii)
70
iron chelation-induced mitophagy can be observed in patient primary fibroblasts [25], (iv)
Pink1-71
dependent phenotypes in flies can be suppressed by mitochondrial aconitase (Aco2), while
72
superoxide-dependent inactivation of the Aco2 [4Fe-4S] cluster triggers iron toxicity that is reversed
73
by mitoferritin overexpression [26]. Thus, there is a close link between the mitochondrial dysfunction
74
underlying PD on the one hand, with the homeostasis of iron, ISC, and heme on the other hand. It is
75
important now to elucidate the relevant molecular events, to define biomarkers of PD progression
76
and to understand how extrinsic factors may modify the disease course.
77
In the chronic state of mutant brain tissue, it is very hard to detect these anomalies. Mitophagy
78
is relevant for only a few among hundreds or thousands of mitochondria per cell at any given time,
79
and the accumulation of iron is an insidious process over decades in PD patients, so the compensatory
80
efforts needed are minimal. Therefore, global expression profiles of Pink1-/- mouse brain showed only
81
subtle evidence of deficient mitophagy and altered mitochondrial biogenesis [16, 27-29], the
82
dysregulated expression of heme-related transcripts Hmox1 and Hebp1 was noted only upon culture
83
of mouse Pink1-/- primary cortical neurons [29], and limited survival of the Pink1-/- mouse was
84
observed only after additional overexpression of toxic alpha-synuclein [16, 30]. In general, Pink1- and
85
Parkin-deficient mice show signs of altered mitophagy and neurodegeneration only in the presence
86
of further stressors such as mitochondrial mutations, exhaustive exercise or bacterial infections
[31-87
34]. Also in C. elegans Pink1- and Parkin-mutants, a lifespan effect was undetectable. In contrast, the
88
survival of Drosophila melanogaster flies with depletion of Pink1 or of Parkin was significantly
89
shortened by a degeneration of wing muscles, due to the massive exercise and energetic demand
90
during flight [16, 35-37].
91
Not only altered mitophagy, but autophagy and mitochondrial dysfunction in general have
92
strong effects on iron homeostasis and lifespan, as was demonstrated in C. elegans for the so-called
93
mit-mutants [38-40]. In a well-established model of rapid ageing, the fungus Podospora anserina, a
94
simple depletion of the mitochondrial matrix protease ClpP results in prolonged lifespan [41]. Again,
95
mice with ClpP deletion were shown to have altered survival with higher resistance to metabolic
96
stress and bacterial infections [42, 43], as well as iron and hemoglobin accumulation
(https://www.mousephenotype.org/data/genes/MGI:1858213). In contrast to Pink1 mutant cells [13,
98
44], stable ClpP mutants showed no evidence of oxidative stress [45], enhancing the doubts whether
99
reactive oxygen species (ROS) have a central process in the control of lifespan [46, 47].
100
Intracellular iron metabolism in mammalian cells is crucial for their proper functions. Free iron
101
molecules can be toxic to cells, leading to the production of ROS, so there have to be strict regulatory
102
mechanisms. Iron metabolism affects the whole cell, since iron is taken up from extracellular space
103
either via transferrin or in a transferrin-independent manner, then reduced in lysosomes for
104
detoxification and distributed within cells, for example to mitochondria, where iron is utilized for
105
ISC production and heme generation [48-50]. The correct function of dozens of proteins in
106
mitochondria, cytosol and nucleus depends on the insertion of ISC [51, 52], so the regulation of iron
107
homeostasis is crucial. ISC play important roles in a wide range of cellular reactions, e.g. electron
108
transfer, catalysis of enzymatic reactions, regulation of gene expression and the quality control of
109
nucleotides, thus controlling genome integrity [53-55]. Similarly, heme is needed as cofactor of
110
cytochrome proteins within mitochondria, but also of cytosolic cytochrome P450 proteins, globins,
111
iron-regulatory proteins, peroxidases, catalase and specific ion-channels [56].
112
113
For a further elucidation of homeostatic cellular efforts upon acute changes of iron levels, we
114
now exposed murine embryonal fibroblasts (MEF) to iron overload and iron depletion and quantified
115
the transcriptional expression adaptation of crucial factors by reverse transcriptase real-time
116
quantitative polymerase chain reaction (RT-qPCR). Most of these factors have been mutated
117
previously to establish their impact on iron, ISC and heme turnover, but their cellular regulation
on-118
demand was never investigated. We also studied Pink1 expression and Pink1-deleted cells, to
119
understand the regulation of mitophagy and the consequences of altered mitophagy for iron
120
processing. Overall, the data confirm that Pink1-dependent mitophagy changes have direct impact
121
on the quality control during ribosomal translation, and that iron is required for sufficient synthesis
122
of surveillance factors for the transcriptome and the genome. Although our studies in vitro focused
123
on strong transcription changes of peripheral cells in response to massive acute iron stress and thus
124
are limited to extreme situations never observed in vivo, we believe that similar more insidious
125
processes occur in the nervous system and might contribute to neurodegenerative diseases.
126
127
128
2. Results
129
We wanted to understand (1) how iron manipulation leads to transcriptional adaptations of iron
130
homeostasis factors and iron-associated factors in different cell compartments, and(2) to what degree
131
deficient mitophagy due to Pink1 deletion generates feedback onto iron homeostasis. MEF cells were
132
exposed to ferric ammonium citrate (FAC) to enhance iron availability. In order to deplete iron from
133
the cell culture medium, we employed two different iron chelators, deferoxamine (DFO) and
2,2′-134
Bipyridine (22BP). Transcriptional changes after 16 hours were quantified for all three conditions.
135
136
2.1 Transcriptional analyses of cellular iron homeostasis factors in wildtype MEF in response to altered iron
137
levels
138
In the discovery phase of this project, we wanted to account for biological variability and
139
screened a large number of wildtype (WT) MEF for iron-dependent expression regulations. As
proof-140
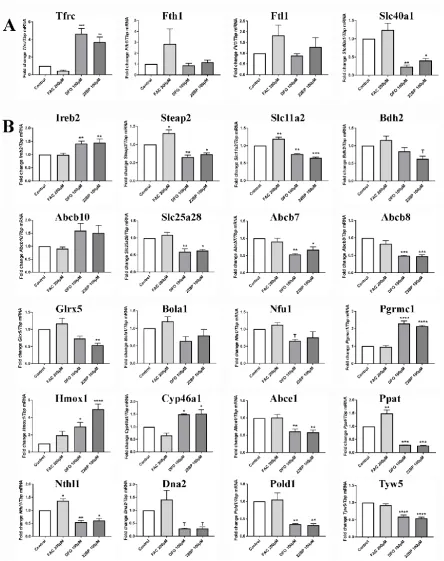
of-principle for the iron-responsiveness of fibroblast expression profiles, Figure 1A shows the
141
transcriptional response of the transferrin receptor (Tfrc), which is the main receptor to import iron
142
into the cell, as well as the iron storage protein ferritin with its heavy chain (Fth1) and light chain
143
(Ftl1). Tfrc was reduced only by 0.45-fold under iron excess conditions (p=0.77), suggesting that iron
144
levels in the basal culture medium is already so high that transferrin-receptor expression cannot be
145
downregulated much during FAC administration. Tfrc was highly induced after DFO (4.66-fold with
146
p=0.0010) and after 22BP (3.72-fold with p=0.0068). Thus, the main regulator of iron uptake responded
to iron depletion in a sensitive manner. Fth1 and Ftl1 were not changed significantly and displayed
148
high variability among the 6 different MEF cell lines, but both ferritin subunit transcripts showed
149
about 2-fold higher levels during iron excess. Conversely, Slc40a1 mRNA encoding ferroportin-1 as
150
cellular iron exporter showed below 0.5-fold levels during iron depletion (DFO 0.24-fold with
151
p=0.0023, 22BP 0.41-fold with p=0.0107) (Figure 1A). These experiments confirmed that MEF are
152
responsive to manipulation of iron availability, so we performed further studies into their
153
adaptations of mRNA expression, focusing on several factors of the cellular iron transport and
154
mitochondrial homeostasis, of the heme synthesis pathway and hemeproteins, of the ISC biogenesis
155
pathway and of ISC-containing factors.
156
There were various factors related to these pathways, which showed no significant
157
dysregulations under any condition, or were less relevant or redundant, so they were shown only in
158
the Supplementary Figure S1. In alphabetical order, these factors include Abcb6, Aco1, Aco2, Alas1,
159
Bach1, Brip1, Cdc42bpa, Cisd2, Cp, Cygb, Dpyd, Elp3, Ercc2, Fech, Fdx1, Flvcr1, Fxn, Hebp1, Ncoa4, Pcbp1,
160
Pcbp2, Prim2, Rsad1, Rsad2, Rtel1, Slc25a37, Steap3 and Trf. The other factors with important
161
dysregulation are shown in the main figures and are individually mentioned in the text below,
162
together with their respective roles.
164
Figure 1. mRNA expression analysis by RT-qPCR in WT MEF (n=6 on average), regarding factors
165
related to A) cellular iron uptake and storage, B) iron transport and processing, mitochondrial iron
166
homeostasis, heme production / turnover / binding, ISC-biogenesis and ISC-binding. All factors
167
studied are presented in their approximate order of action during cellular iron homeostasis. Their
168
expression adaptation was documented 16 h after iron overload (FAC) or after two different iron
169
depletion conditions (DFO, 22BP). Mean values with SEM are shown, normalized to the control
170
condition. The levels of significance are illustrated by symbols T: 0.1>p>0.05, *: p< 0.05, **: p < 0.01, ***:
171
p < 0.001, ****: p < 0.0001.
172
Tfrc mRNA is stabilized by Ireb2, whose mRNA was also induced after iron deprivation (Figure
173
1B). After transferrin binding to Tfrc and subsequent endocytosis of this complex, the acidic pH in
endosomes releases ferric iron (Fe3+), which is reduced to the ferrous form (Fe2+) by the
175
metalloreductases Steap2 and Steap3. Iron molecules then get exported by the divalent metal
176
transporter 1 (DMT1 encoded by Slc11a2) to the cytosol. After iron overload, Steap2 and Slc11a2
177
mRNA showed a significant approximately 1.3-fold upregulation (Figure 1B and Suppl. Figure S1),
178
indicating higher biosynthesis of the factors responsible for reduction and export of iron. During both
179
forms of iron depletion, Steap2 and Slc11a2 mRNAs were significantly reduced to 0.65-fold, so their
180
levels are in direct correlation with iron availability.
181
The ISC-containing 3-hydroxybutyrate dehydrogenase-2 (Bdh2) catalyzes the rate-limiting step
182
in the biosynthesis of siderophores, which are soluble Fe3+ binding agents. Upon iron depletion, Bdh2
183
transcription was slightly downregulated (DFO: 0.84-fold with p=0.5980; 22BP: 0.63-fold with
184
p=0.0655). Bdh2 inhibition was shown to result in cellular iron accumulation [57], so again its
185
expression adaptation could represent a homeostatic effort to increase intracellular iron levels.
186
The poly(RC) binding protein 2 (Pcbp2) is involved in mRNA metabolism and translation, as
187
well as innate immune signaling, but was previously shown to function also as chaperone for the
188
labile iron pool (LIP) in the cytosol [58]. However, neither Pcbp2 nor Pcbp1 transcript were
189
consistently changed by iron level manipulation (Suppl. Figure S1).
190
The iron regulatory proteins (Irp1 encoded by the Aco1 mRNA, and Irp2 by Ireb2) sense cytosolic
191
iron availability and ensure adequate iron supply to mitochondria [59], firstly via association with
192
iron response elements (IREs) in the untranslated region (UTR) of ferritin mRNA to inhibit its
193
translation, and secondly via association with Tfrc mRNA to stabilize it and thus facilitate iron import
194
when cellular iron levels are low. During both forms of iron depletion, the transcription of Ireb2
195
showed an upregulation (DFO: 1.42-fold with p=0.0095; 22BP: 1.46-fold with p=0.0042), while Aco1
196
showed a consistent reduction (DFO: 0.61-fold with p=0.2894; 22BP: 0.53-fold with p=0.1362; Suppl.
197
Figure S1). Under conditions of sufficient iron, Irp1 exerts its cytosolic aconitase functions while Irp2
198
gets degraded, resulting in converse effects with increased ferritin translation and Tfrc degradation
199
[60]. After iron overload, we detected no relevant expression adaptation of both transcripts encoding
200
iron regulatory proteins.
201
Expression of the mitochondrial inner membrane transporter Slc25a28, which encodes
202
Mitoferrin 2 (Mfrn2), did not react after iron overload, but was significantly reduced after iron
203
depletion (DFO: 0.60-fold with p=0.0066; 22BP: 0.64-fold with p=0.0119). Mitoferrin 1 (Slc25a37),
204
however, did not show consistent alteration upon different iron levels. Mfrn1 forms a complex with
205
the mitochondrial inner membrane iron transporter Abcb10 [61]. Abcb10 transcript levels were
1.5-206
fold higher under both iron depletion conditions, but these changes were statistically not significant.
207
Given that it is not clear how these two inner membrane transporters of iron are acting in
208
complementary fashion, it is interesting to note that Abcb10 mRNA was higher during low iron
209
conditions as expected for an iron uptake factor. However, Slc25a28 mRNA was diminished under
210
the same treatment, a response that would be in line with an iron export factor. In comparison, Abcb7
211
and Abcb8 are thought to have mitochondrial export functions [62-65] and are also important for heme
212
biosynthesis [66]. As expected after iron depletion, Abcb7 transcript was reduced (DFO: 0.53-fold with
213
p=0.0042; 22BP: 0.67-fold with p=0.0299), similar to the reduction of Abcb8 transcript (DFO: 0.49-fold
214
with p=0.0003; 22BP: 0.47-fold with p=0.0003).
215
Once transported into the mitochondrial matrix, iron may be stored or used for the biosynthesis
216
of ISC and heme. The mitochondrial iron storage factor Mitoferritin (Ftmt) was not detectable in MEF
217
cells under the conditions tested. For biosynthesis purposes, iron is incorporated by Fxn into the
218
sulfur-containing Nfs1-Iscu-Lyrm4-complex to generate [2Fe-2S] clusters, which associate with Glrx5
219
(glutaredoxin 5) and the assembly factor Bola1 (BolA Family Member 1) [49, 67, 68]. Subsequently,
220
these ISC are transferred by the ISC scaffold Nfu1 to target proteins [69]. After both iron depletion
221
conditions, Glrx5 expression was reduced (DFO: 0.73-fold with p=0.1804; 22BP: 0.54-fold with
222
p=0.0089). Fxn, Bola1 and Nfu1 levels were around 0.7-fold after both iron depletion conditions
223
(Figure 1B and Suppl. Figure S1), but this was not statistically significant. The converse iron overload
224
did not modulate expression of the ISC biogenesis proteins.
Pursuing the heme- and ISC-associated pathways into the cytosol, it is relevant that the putative
226
heme release factor Pgrmc1, as cytosolic factor in association with mitochondrial ferrochelatase,
227
showed a more than two-fold transcriptional induction after iron depletion (DFO: 2.30-fold with
228
p<0.0001; 22BP: 2.16-fold with p<0.0001). Heme oxygenase 1 (Hmox1) acts to degrade cytoplasmic
229
heme by cleaving it to biliverdin, as the rate limiting step of heme breakdown [70]. After iron
230
depletion, Hmox1 mRNA was highly upregulated (DFO: 2.96-fold with p=0.0249; 22BP: 4.95-fold with
231
p<0.0001). This upregulation might reflect a compensatory cellular effort to recruit iron via heme
232
breakdown. The cholesterol elimination factor Cyp46a1 belongs to the Cytochrome P450 family,
233
which is known to bind heme as a co-factor [71, 72]. After iron depletion, Cyp46a1 transcript was
234
slightly, but consistently increased (DFO: 1.49-fold with p=0.0232; 22BP: 1.52-fold with p=0.0179); it
235
was not altered after iron overload. Continuing the heme-related pathway, the transcript levels of
236
Cytoglobin (Cygb) [73] were quantified, as one vertebrate globin family that is expressed in
237
fibroblasts, but they showed no change and high variability (Suppl. Figure S1).
238
Not only heme, but also ISC are incorporated into target proteins, many of which have
239
nucleotide processing functions. Among the ISC-containing factors present inside and outside of
240
mitochondria, the essential ribosome recycling factor Abce1 (ATP Binding Cassette Subfamily E
241
Member 1) exerts crucial functions to avoid accumulation of ribosomes at the stop codon, inefficient
242
ribosomal cycling and stalled translation [74, 75]. Interestingly, after both forms of iron depletion a
243
significant decrease of Abce1 mRNA (DFO: 0.61-fold with p=0.0024; 22BP: 0.58-fold with p=0.0013)
244
was observed, while iron overload triggered no expression adaptation.
245
The ISC-containing phosphoribosyl pyrophosphate amidotransferase (Ppat=Gpat) is the
rate-246
limiting enzyme in de novo purine nucleotide biosynthetic pathways. Its expression showed a strong
247
direct correlation of high significance with the availability of iron. After incubation with FAC, Ppat
248
was significantly upregulated (1.49-fold; p=0.0034). After iron depletion it was massively
249
downregulated (DFO: 0.29-fold with p=0.0003; 22BP: 0.27-fold with p=0.0002). These sensitive
250
adaptations suggest that iron has supreme importance for nucleotide homeostasis.
251
The Nth like DNA glycosylase 1 (Nthl1) has important functions in base excision repair, harbors
252
an ISC and is localized both in the nucleus and the mitochondrial matrix. The expression of Nthl1
253
reacted similar to Ppat with upregulation after iron overload (1.36-fold; p=0.0274) and
254
downregulation after both forms of iron depletion (DFO: 0.54-fold with p=0.0071; 22BP: 0.61-fold with
255
p=0.0172), although with less effect size and less significance.
256
Similarly, three other ISC-associated nuclear factors implicated in DNA quality control also
257
showed consistent downregulations after iron deprivation, namely the DNA replication helicase
258
Dna2 (DFO: 0.30-fold with p=0.0893; 22BP: 0.30-fold with p=0.0897), the DNA primase subunit Prim2
259
(DFO: 0.82-fold with p=0.1627; 22BP: 0.84-fold with p=0.2372; Suppl. Figure S1), and the DNA
260
polymerase delta subunit Pold1 (DFO: 0.34-fold with p=0.0061; 22BP: 0.31-fold with p=0.0042).
261
The tRNA wybutosine synthesizing protein 5 (Tyw5) was reported to catalyze a carbon
262
hydroxylation using Fe2+ ions as cofactors, so its activity depends on iron levels. Tyw5 expression did
263
not react to iron overload, but it was downregulated with extreme significance after iron depletion
264
(DFO: 0.59-fold with p<0.0001; 22BP: 0.55-fold with p<0.0001).
265
Jointly, these results in WT cells indicate that upon iron overload and even more upon iron
266
depletion, expression adapts up to two-fold within 16 hours for specific factors at the plasma
267
membrane, in endosomes and the cytosol, inside mitochondria as well as the nucleus. An indirect
268
negative correlation was found for iron transport components at the plasma membrane and
269
mitochondrial membrane, which responded to iron depletion with induced expression of Tfrc / Ireb2
270
and Abcb10, respectively. Similarly, the iron recruitment option via mitochondrial heme release and
271
its cytosolic breakdown responded to iron depletion with induced expression of Pgrmc1 / Hmox1.
272
Furthermore, increased need for the heme-binding cholesterol catabolism enzyme Cyp46a1 became
273
apparent during iron depletion. In contrast, a strong direct correlation with iron levels was observed
274
for endosomal and cytosolic iron processing factors Steap2 and Slc11a2, exhibiting increased
275
expression upon iron overload versus decreased expression upon iron depletion. A similarly strong
276
direct correlation was also documented for ISC-containing factors of nucleotide metabolism, namely
Ppat and Nthl1. All other expression adaptations observed simply reflected the diminished synthesis
278
of iron-associated factors under conditions of low iron levels.
279
280
2.2 Transcriptional analyses of cellular iron homeostasis factors in Pink1-/- MEF in response to altered iron
281
levels
282
In the validation phase of this project, experiments were performed in additional wildtype MEFs
283
and also in Pink1-deficient MEFs where mitophagy is impaired. Again, we studied FAC-mediated
284
iron overload and DFO/22BP-mediated iron depletion, now in 3 WT MEF lines versus 3 Pink1-/- MEF
285
lines. With this approach we hoped to elucidate how iron, ISC and heme homeostasis relate to
286
mitophagy.
287
Figure 2A shows mRNA levels of Pink1 and Park2 (Parkin) as regulators of mitophagy. The first
288
panel confirms the knockout of Pink1 in the MEF and demonstrates a high transcriptional induction
289
of Pink1 after iron deficiency (for DFO 1.42-fold with p=0.0006 in WT and 0.30-fold with p=0.0794 in
290
Pink1-/- MEF; for 22BP 1.65-fold with p<0.0001 in WT and 0.40-fold with p=0.0076 in Pink1-/- MEF). This
291
transcript induction was obviously much less strong in the Pink1-/- cells. These Pink1-/- MEF derive
292
from a mouse where an intron is retained in the Pink1-/- mRNA and triggers a changed reading frame,
293
so Pink1 mRNA is rapidly degraded and the Pink1 protein is absent, but the Pink1 promoter is still
294
actively responding to specific stressors like iron depletion. Similarly, the Park2 transcript got
295
induced upon iron depletion (for 22BP 2.40-fold with p=0.0007 in WT and 1.85-fold with p=0.0065 in
296
Pink1-/- MEF). These results in Figure 2A corroborate the concept that Pink1/Parkin-dependent
297
mitophagy gets highly induced after iron starvation in MEF.
298
Figure 2B shows the transcriptional changes of the key cellular iron turnover factors. Initial
299
cellular iron uptake (Tfrc), storage (Fth1, Ftl1) and cell export (Slc40a1) showed no differences between
300
Pink1-deficiency and WT, with the transferrin receptor being highly upregulated also in Pink1-/- MEF
301
(DFO: 4.66-fold with p<0.0001; 22BP: 3.72-fold with p=0.0009) in response to iron depletion. Upon
302
comparison of Figure 1 with Figure 2B/C, fewer expression adaptations reached statistical
303
significance, due the smaller number of cell lines studied and limited statistical power.
304
The overall pattern of regulations was reproduced in this second analysis also in Figure 2C and
305
Suppl. Figure S1. Again, a negative correlation was found between iron availability and activators of
306
membrane import, with induced expression after iron depletion for Tfrc together with Ireb2 (for DFO
307
1.47-fold with p=0.0052 in WT and 1.39-fold with p=0.0244 in Pink1-/- cells; for 22BP 1.53-fold with
308
p=0.0020 in WT and 1.32-fold with p=0.0734 in Pink1-/- cells) and for the mitochondrial transporter
309
Abcb10 (DFO: 1.30-fold with p=0.0459 in Pink1-/- cells). Similarly, the iron recruitment via
310
mitochondrial heme release as well as heme breakdown reacted to iron depletion with induced
311
expression of Pgrmc1 (DFO: 2.11-fold with p<0.0001; 22BP: 2.07-fold with p<0.0001 in Pink1-/- cells)
312
and of Hmox1 (22BP: 5.10-fold with p=0.0063 in WT cells), respectively. Again, iron depletion resulted
313
in increased Cyp46a1 transcript levels (DFO: 1.43-fold with p=0.0259; 22BP: 1.43-fold with p=0.0274),
314
reflecting heme-regulated adaptations.
315
Conversely again, a positive correlation was observed for endosomal and cytosolic iron
316
processing factors Steap2 (after FAC 1.32-fold with p=0.0043 in Pink1-/- cells), Slc11a2 (after FAC
1.73-317
fold with p=0.0393 in Pink1-/- cells) and now also for the iron chaperone Bdh2 (after FAC 1.14-fold with
318
p=0.0323 in Pink1-/- MEF; for DFO 0.75-fold with p=0.0622 in WT and 0.69-fold with p=0.3398 in Pink1
-319
/- cells; for 22BP 0.65-fold with p=0.0059 in WT and 0.57-fold with p=0.0211 in Pink1-/- cells), exhibiting
320
increased expression upon iron overload. The strong positive correlation was also confirmed for
ISC-321
containing factors of nucleotide metabolism, which exhibited increased expression upon iron
322
overload versus decreased expression upon iron depletion. Indeed, Ppat was upregulated after iron
323
overload (1.49-fold with p=0.0001 in WT and 1.30-fold with p=0.0137 in Pink1-/- MEF), but
324
downregulated after iron depletion (for DFO 0.29-fold with p<0.0001 in WT and 0.31-fold with
325
p<0.0001 in Pink1-/- MEF; for 22BP 0.27-fold with p<0.0001 in WT and 0.24-fold with p<0.0001 in Pink1
-326
/- MEF). Nthl1 also was upregulated after iron overload (1.36-fold with p=0.0066 in WT and 1.37-fold
327
with p=0.0003 in Pink1-/- MEF), but downregulated after iron depletion (for DFO 0.54-fold with
p=0.0008 in WT and 0.60-fold with p=0.2269 in Pink1-/- MEF; for 22BP 0.61-fold with p=0.0032 in WT,
329
0.43-fold with p=0.0112 in Pink1-/- MEF).
330
The impact of the lack of iron on ISC-containing factors implicated in nucleotide processing was
331
also obvious for the DNA quality control factors Dna2, Prim2 and Pold1, as well as the tRNA
332
modifying factor Tyw5. They did not show changes after iron overload, but were downregulated
333
strongly after iron depletion (Dna2 for DFO 0.30-fold with p=0.0208 in WT and 0.33-fold with p=0.0071
334
in Pink1-/- cells; for 22BP 0.30-fold with p=0.0209 in WT and 0.31-fold with p=0.0061 in Pink1-/- MEF),
335
(Prim2 for DFO 0.78-fold with p=0.0189 in Pink1-/- cells; for 22BP 0.69-fold with p=0.0026 in Pink1
-/-336
MEF, Suppl. Figure S1), (Pold1 for DFO 0.34-fold with p=0.0002 in WT and 0.27-fold with p=0.0001 in
337
Pink1-/- cells; for 22BP 0.31-fold with p=0.0001 in WT and 0.22-fold with p<0.0001 in Pink1-/- MEF),
338
(Tyw5 for DFO 0.50-fold with p<0.0001 in WT and 0.49-fold with p<0.0001 in Pink1-/- cells; for 22BP
339
0.51-fold with p<0.0001 in WT and 0.50-fold with p<0.0001 in Pink1-/- MEF).
340
In Pink1-/- MEF, similar responses to iron depletion was also observed in the ISC biogenesis
341
factors Bola1 (DFO: 0.61-fold with p=0.0201; 22BP: 0.54-fold with p=0.0092) and Nfu1 (DFO: 0.55-fold
342
with p=0.0100; 22BP: 0.67-fold with p=0.0389), whereas Glrx5 did not change in the mutant MEF. In
343
addition, the ISC-containing Elongator complex protein 3 (Elp3), which is involved in tRNA
344
modification [76], showed 0.7-fold lower transcript levels after iron depletion (for DFO: 0.75-fold with
345
p=0.0002 in WT and 0.65-fold with p<0.0001 in Pink1-/- cells, for 22BP: 0.69-fold with p<0.0001 in WT
346
and 0.68-fold with p=0.0003 in Pink1-/- cells) (Suppl. Figure S1).
347
For the putative iron exporters Abcb7 and Abcb8, the previously observed transcript decreases
348
were also seen in Pink1-/- cells, especially in Abcb8 (0.43-fold with p<0.0001 for DFO and 0.39-fold with
349
p<0.0001 for 22BP).
350
Interestingly, the downregulation of the mitochondrial membrane transporter Slc25a28
351
(encoding Mitoferrin-2) after iron depletion was reproduced in the Pink1-/- lines (DFO: 0.63-fold with
352
p=0.0162; 22BP: 0.61-fold with p=0.0108) in agreement with a hypothetical iron export role, while
353
Slc25a37 (encoding Mitoferrin-1) showed a significant induction after FAC treatment (1.61-fold with
354
p=0.0129 in Pink1-/- MEF) as expected for an iron import factor (Suppl. Figure S1).
355
For several factors, Pink1-/- MEF showed significant changes or trends when WT cells did not.
356
This was the case for Ftl1 after FAC (2.35-fold with p=0.0573), Slc11a2 after FAC (1.73-fold with
357
p=0.0393), Slc25a37 after FAC (1.61-fold with p=0.0129) and Hmox1 after FAC (4.03-fold with
358
p=0.0735), for Slc40a1 after DFO (0.25-fold with p=0.0729), Pcbp2 after FAC (0.80-fold with p=0.0804)
359
and DFO (0.75-fold with p=0.0367), Aco1 after 22BP (0.48-fold with p=0.0277, Suppl. Figure S1), Bola1
360
after DFO (0.61-fold with p=0.0201) and 22BP (0.54-fold with p=0.0092), Abcb10 after DFO (1.30-fold
361
with p=0.0459). Rather than reflecting vulnerability against a specific insult, this may reflect a general
362
role of Pink1 in stress responses, or may simply be due to multiple testing.
363
The only putative genotype-dependent effect was observed for the ISC-containing ribosome
364
recycling factor and RNase L inhibitor Abce1, which revealed slightly lower levels in Pink1-deficient
365
cells already under control conditions (0.70-fold with p=0.0571). Interestingly, this was no longer
366
observed after iron overload and during iron depletion, where it was similarly downregulated as in
367
WT control cells.
Figure 2. mRNA expression analysis by RT-qPCR in WT and Pink1-/- MEF (n=3versus3) regarding
371
factors related to A) the mitophagy modulators Pink1 and Park2 after iron manipulation, B) cellular
372
iron uptake, storage and export, C) iron transport and processing, mitochondrial iron homeostasis,
373
heme production and turnover, ISC-biogenesis and ISC-binding. All factors studied are presented in
374
their approximate order of action during cellular iron homeostasis. Their expression adaptation was
375
documented after iron overload (FAC) and under two different iron depletion conditions (DFO,
376
22BP). Mean values with SEM are shown, normalized to the control condition. The levels of
377
significance are illustrated by symbols T: 0.1>p>0.05, *: p< 0.05, **: p < 0.01, ***: p < 0.001, ****:
378
p < 0.0001. Asterisks represent significance in wildtype MEF in respect to WT control and hashtags in
379
Pink1-/- MEF, in respect to knockout control.
380
381
2.3 Analyses of protein levels of PPAT and NFU1 as ISC-containing factors in response to altered iron levels
382
Now we wanted to assess in further validation experiments if the observed changes can also be
383
seen on protein levels, focusing on three dysregulated factors whose transcript dysregulation had
384
marked effect size and where a promising antibody was available. PPAT contains an ISC and its
385
mRNA had exhibited strong positive correlations with iron levels, with three-fold downregulation
386
after iron depletion; NFU1 is involved in the biosynthesis of ISC and its transcript had shown almost
387
two-fold downregulation after iron depletion; TFRC had shown more than four-fold upregulation
388
after iron deprivation (Figures 1 and 2).
389
390
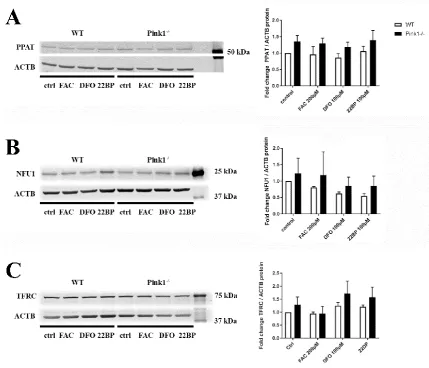
Figure 3. Quantitative immunoblot for A) PPAT and B) NFU1 and C) TFRC in WT and Pink1-/- MEF,
391
22BP). The panels on the right show their densitometric quantifications. n=3, one exemplary set is
393
shown.
394
It is well known that quantitative immunoblots have difficulties to detect changes that are
395
smaller than two-fold due to the saturation kinetics of membrane and antibody association, whereas
396
the RT-qPCR technique measures its template in linear manner over a wide range of magnitudes.
397
Moreover, the longer half-lives of proteins may require long time-course analyses to demonstrate
398
expression regulations. For most factors in iron homeostasis, ISC and heme turnover, there are no
399
antibodies with sufficient sensitivity and specificity for reliable quantification of the endogenous
400
protein levels. For these reasons, the initial survey of iron effects on homeostasis factors was
401
conducted at the mRNA level. Still, it was disappointing that no significant expression adaptations
402
of PPAT, NFU1 and TRFC protein levels were detectable after 16 h incubation.
403
2.4 Investigation of Abce1 transcript levels in a larger number of Pink1-/- MEF lines
404
Again, additional validation experiments were performed to elucidate further what role Pink1
405
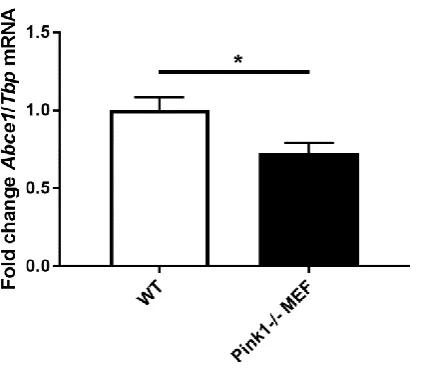
and mitophagy play for iron homeostasis and nucleotide processing. We focused on the ribosomal
406
recycling factor Abce1, which was downregulated to ~0.6-fold after treatment of the cells with iron
407
chelators in 3 WT MEF lines and 3 Pink1-/- lines (Figures 1 and 2). Abce1 was the only factor with a
408
Pink1-dependent expression adaptation (0.70-fold), although not quite significant (p=0.0571). Upon
409
increasing the number of analyzed MEF lines to 7 WT versus 7 Pink1-/-, the 0.72-fold downregulation
410
of Abce1 mRNA in Pink1-/- cells reached significance (p=0.0240) (Figure 4).
411
412
413
Figure 4. Transcript expression levels of the ISC-containing ribosome recycling factor Abce1 in WT
414
and Pink1-/- MEF (n=7), *: p<0.05
415
416
This downregulation of Abce1 in the absence of Pink1 was interesting, because this links
417
ribosomal recycling und translation to the availability of iron and nutrients in the cell. These findings
418
not only confirm the previously described connection between mitophagy, iron metabolism and
419
longevity [7], but also extend them to ribosomal translation and ribosome recycling inside
420
mitochondria as well as in the cytosol.
3. Discussion
423
Our data represent a systematic pioneer effort to document physiological transcriptional
424
regulations of most factors with relevance to iron, ISC and heme homeostasis, after acute changes in
425
iron availability. The immediate expression adaptation after 16 h is best detected at the mRNA level,
426
while protein changes would show much longer delays (see Figure 3). In mammalian fibroblasts, for
427
the first time we explain how iron depletion induces the expression of Pink1 and Parkin as mediators
428
of mitophagy, and how Pink1-/- affected mitophagy impairs Abce1-dependent co-translational quality
429
control.
430
It is important to note that current knowledge believes iron deficiency or hypoxia to act via
Hif-431
1/Fif-2a/Hif-b, triggering a transcriptional induction of Tfrc together with Slc11a2 (Dmt1), Slc40a1
432
(Fpn1), Hmox1, Epo and Cp [62]. However, in MEF we observed an opposite regulation of Tfrc and
433
Hmox1 versus Slc40a1 and Slc11a2.
434
With consistence between WT and mutant cells, iron shortage upregulated the plasma
435
membrane iron import factor Tfrc mRNA together with Ireb2 as stabilizer of its mRNA [77]. Iron
436
depletion also upregulated the mitochondrial membrane iron import factor Abcb10. In contrast to this
437
avid activation of iron recruitment proteins upon iron deficiency, the expression of intracellular iron
438
disposal factors was in positive correlation with iron availability. This iron-dependent expression
439
was particularly strong for the endosomal factors Steap2 and Dmt1 (encoded by Slc11a2), and
440
exceptionally significant for Ppat, Nthl1, Dna2, Pold1 and perhaps Prim2 as components of RNA/DNA
441
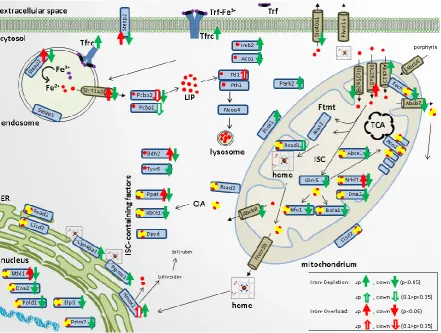
surveillance. Figure 5 summarizes our current findings in an overview scheme, indicating
442
transcriptional changes with colored arrows.
443
444
Figure 5. Overview scheme of cellular iron uptake, storage and export, iron transport and processing,
445
mitochondrial iron homeostasis, heme production and turnover, ISC-biogenesis and ISC-binding within the
446
cells. For each factor with significant expression adaptation, green arrows indicate the direction of transcript
447
change during iron depletion, while red arrows refer to iron overload. Ferric iron (Fe3+) is illustrated with purple
448
sulfur-cluster assembly machinery, FTMT: mitochondrial ferritin, LIP: labile iron pool; TCA: tricarboxylic acid
450
cycle.
451
452
Our novel observation concerning a transcriptional induction of the mitophagy-mediators Pink1
453
and Parkin in MEF by iron chelators is an important finding to explain the previous reports in C.
454
elegans that mitophagy is induced upon iron shortage [7, 8]. A similar induction of Pink1 and Parkin
455
was also reported in human neuroblastoma cells upon deprivation from fetal calf serum, which
456
contains transferrin as the key supplier of iron during cell culture [15]. In the context of human
457
Parkinson pathogenesis, it is noteworthy that the main driver of neurodegeneration in PD, namely
458
the excessive dosage and aggregation of the protein alpha-synuclein, can be modulated by iron via
459
direct binding to an IRE in its mRNA 5’UTR as well as direct binding to the encoded protein [78, 79].
460
Alpha-synuclein is known to have ferrireductase activity [80-82], with aggregation effects similar to
461
Steap3 [83], and has a physiological localization at the interface between mitochondria and
462
endoplasmic reticulum [84]. It is not possible to investigate the connections between iron and
alpha-463
synuclein further in fibroblasts due to its low expression level in these cells, but it is interesting to
464
note that an 8-fold induction of alpha-synuclein transcripts was observed in human fibroblasts from
465
PD patients with Pink1 mutation [85]. Thus, both the negative correlation of iron with Pink1/Parkin
466
expression and its positive correlation with alpha-synuclein aggregation may contribute to its
467
toxicity, modulating mitophagy and the neurodegenerative process in PD.
468
The only expression dysregulation with Pink1-/- genotype-dependence was documented for the
469
mRNA of ISC-associated Abce1 under basal conditions without iron manipulation (Figure 2B and
470
Figure 4). These novel mammalian data confirm that Abce1 has a unique link to the mitophagy factor
471
Pink1, as was observed previously also in D. melanogaster. These experiments in flies demonstrated
472
that nucleus-derived mRNAs encoding mitochondrial precursor proteins such as the complex-I 30kD
473
subunit continuously translated at the outer mitochondrial membrane surface may be damaged and
474
stall the ribosomal translation machinery during stress periods. This leads to a C-terminal extension
475
of certain amino acids non-coded by mRNA template, which is toxic. In a Pink1-dependent manner,
476
this recruits co-translational quality control factors for RNA/proteins in a process named
477
MISTERMINATE, as well as triggering mitophagy. During this mitochondrial surveillance process,
478
Not4 generates poly-ubiquitin signals on the co-translational control protein Abce1, thus attracting
479
autophagy receptors to the mitochondrial outer membrane and contributing to mitophagy initiation
480
[86, 87]. Thus, fly mitophagy is regulated together with proteostasis in Pink1-dependence via Abce1.
481
It is relevant to note that longevity is increased upon several genetic perturbations of mRNA
482
translation within the mTOR pathway in yeast, C. elegans and D. melanogaster and by mutations that
483
slow down the expenditure of cellular energy by ribosome biogenesis [88, 89]. Therefore, it will be
484
interesting to assess the lifespan effects of different Abce1 mutations in the future.
485
Abce1 is one of the most conserved proteins in evolution and is expressed in all organisms except
486
eubacteria. Because of its fundamental role in translation initiation, ribosome biosynthesis and/or
487
ribosome recycling, Abce1 is essential for life. Strong homozygous depletion of the Abce1 homologue
488
pixie in D. melanogaster results in early lethality [90]. Also, in mouse, the homozygous knockout of
489
Abce1 is embryonically lethal, according to the international mouse phenotyping consortium IMPC
490
(https://www.mousephenotype.org/data/genes/MGI:1195458). As an ATPase, Abce1 is responsible
491
for the splitting of the two ribosomal subunits and is thus important for translation termination in
492
mammalian cells, yeast and also archaea. To fulfil these roles, it harbors two essential diamagnetic
493
[4Fe-4S]2+ clusters [91]. The depletion of Abce1 was reported to induce the accumulation of
ribosome-494
associated isolated mRNA-3’-UTRs, consistent with a model of ribosome stalling [92]. It is also known
495
as RNaseL-inhibitor and exerts selective control over the stability of mitochondrial mRNAs during
496
interferon-alpha responses to infection [93]. Decreased ABCE1 protein levels were caused by the
497
induction of ROS and this was attributed to the chelation of iron with subsequent loss of stability of
498
Abce1 [92]. Interestingly, Abce1 as well as Hbs1l transcript levels were shown to be upregulated in the
499
brains of PD patients [87]. Hbs1L is a member of the GTP-binding elongation factor family and was
500
reported to be involved in the regulation of fetal hemoglobin levels [94]. The downregulation of MEF
501
several other ISC-associated factors like Bola1, Ppat, Nthl1, Dna2, Prim2 and Pold1, probably simply
503
reflecting the limited availability of ISC. Jointly, all these data underline the importance of iron for
504
the RNA/DNA quality surveillance inside and outside mitochondria.
505
506
Away from Pink1/Parkin as intrinsic determinants of mitophagy, Parkinson’s disease and
507
longevity, the main focus of our study was iron as extrinsic modulator and on the homeostatic
508
expression adaptations induced by it. Important responses to iron depletion included the slight
509
upregulation of Abcb10 mRNA contrasted by a converse downregulation of Slc25a28, although both
510
transporters are thought to mediate iron import. The substrates of Abcb10 transport activity are
511
currently undefined, but its absence was reported to reduce mitoferrin1 protein levels, iron import
512
into mitochondria, heme biosynthesis and hemoglobinization, while a role in the export of ALA was
513
excluded [95]. It is difficult to identify the individual substrates for each mitochondrial transporter
514
protein, given that Abcb10, the putative iron-importer mitoferrin, the heme-synthesis factor
515
ferrochelatase, and the ISC-exporter Abcb7 coexist in a protein complex [61, 62, 66, 96] where the
516
deletion of one member may destabilize its interactors. Similar to Abcb10, a decreased iron import
517
and heme biosynthesis was also shown upon deletion of mitoferrin [97, 98], leading to universal
518
acceptance of mitoferrin as main mitochondrial iron importer [99]. Upon comparison of the
519
transcriptional regulation of both factors, it is intriguing to note that iron shortage leads to parallel
520
induction of Tfrc for iron recruitment across plasma membranes, and induction of Abcb10 which
521
could recruit iron across mitochondrial membranes, but a converse downregulation of Slc25a28
522
which encodes mitoferrin-2. Interestingly, the reduction of Slc25a28 in C. elegans was reported to
523
result in prolonged lifespan [57]. This paradoxical Slc25a28 downregulation during iron shortage,
524
however, might be expected for a transporter that mediates iron export, but is unusual for an import
525
factor. In only one study so far, Abcb8 was implicated in mitochondrial export functions for iron and
526
factors required for cytosolic ISC-protein maturation [63]. As expected for mitochondrial iron export
527
factors, Abcb8 expression was downregulated after iron depletion, to a similar level as Slc25a28.
528
Regarding the two mitoferrin isoforms, it was also noteworthy that Slc25a28 responded to iron
529
depletion, whereas Slc25a37 seemed regulated only after iron excess. We propose that further studies
530
of transcriptional regulation in response to putative substrate loading would help to elucidate the
531
specific roles of each membrane transporter.
532
Further mRNA inductions in response to iron deprivation included Ireb2/Irp2 as a stabilizer of
533
Tfrc mRNA [77], the over 2-fold induction of the heme-release factor Pgrmc1 [100], and a massive 4-
534
to 5-fold induction of Hmox1 (the rate-limiting enzyme in heme-degradation) in response to 22BP, as
535
another possible pathway of iron recruitment. The previously observed impaired Hmox1 induction
536
after oxidative stress damage in Pink1-depleted cells [101] was not detected in MEF in the absence of
537
stress factors. It is interesting to note that iron-starved cells trigger a strong induction of the
538
mitochondrial ferrochelatase-associated heme-release factor Pgrmc1, but not a similarly strong effort
539
to export ISC from mitochondria through Abcb7 induction. The completely novel observation that
540
iron depletion induces Cyp46a1 as the rate-limiting enzyme of cholesterol degradation provides a hint
541
why iron-deficiency anemia patients show lower blood cholesterol levels, and how iron influences
542
steroidogenesis [102, 103].
543
Conversely, positive correlation between iron availability and expression levels were observed
544
for numerous intracellular iron-employing factors, particularly Steap2 and Dmt1 as components of
545
the endosomal processing, and Nthl1 and Ppat, both of which contain ISC for their proper function.
546
NTHL1 is a DNA N-glycosylase that is localized mainly in the nucleus, but also found in
547
mitochondria [104]. It catalyzes the first step in base excision repair and binds a [4Fe-4S] cluster [55].
548
Nthl1 mRNA seemed to react very sensitively with reduction to almost 50% upon iron depletion and
549
induction to 135% after iron overload. This may reflect the known dependence of Nthl1 and Ppat
550
protein stability on the correct ISC insertion [105]. Ppat belongs to the purine/pyrimidine
551
phosphoribosyltransferase family and catalyzes the first step of de novo purine nucleotide
552
biosynthetic pathway. It also possesses a [4Fe-4S] cluster, which is needed for protein maturation
553
[55]. Ppat maturation and subsequent function are affected in the neurodegenerative disorder
Friedreich Ataxia. This disease is caused by loss-of-function mutations in the Fxn gene encoding the
555
frataxin protein, which starts the ISC biogenesis within mitochondria [106, 107]. Thus, the transcript
556
reductions of Nthl1 and Ppat probably reflect limited ISC supply from mitochondria.
557
All other factors with downregulation upon iron deficiency are either involved in the complex
558
synthesis of ISC or contain one or several ISC. Among them were Bola1, Nfu1 and Glrx5, which play
559
roles in the synthesis of ISC and are localized inside mitochondria. The cytosolic tRNA modification
560
factor Tyw5 associates with iron and was also drastically reduced after iron deprivation. A slight
561
downregulation was noted for ISC-containing cytosolic Irp1/Aco1 and for ISC-containing Rsad1,
562
which is a heme chaperone in the mitochondrial matrix [108]. In contrast, ISC-containing Rsad2 at
563
the mitochondrial outer membrane and the endoplasmic reticulum [109] was not exhibiting
564
dysregulation in MEF after iron manipulation, despite previous reports on its Pink1-dependence in
565
immune responses [29]. Similarly, ISC-containing Fech in mitochondria was not strongly
566
dysregulated. This indicates that ISC homeostasis is not entirely disrupted upon depletion of
567
extracellular iron or in the absence of Pink1, but instead specific vulnerabilities exist, in particular for
568
RNA/DNA quality and genome stability through Ppat / Nthl1 / Dna2 / Prim2 / Pold1 deficiency. This
569
is a central finding, since DNA integrity is crucial for the healthy lifespan [6], and since the DNA
570
repair pathway was recently identified as the most important modifier of onset age and progression
571
velocity in neurodegenerative diseases [110-112].
572
573
574
4. Materials and Methods
575
Mouse embryonic fibroblast generation:
576
The mice used were bred at the Central Animal Facility (ZFE) of the Goethe University Medical
577
Faculty in Frankfurt, under FELASA-certified conditions, in accordance with the ETS123 (European
578
Convention for the Protection of Vertebrate Animals), the Council Directive of 24 November 1986
579
(86/609/EWG) with Annex II and the German Animal Welfare Act. Approval of the local institutional
580
review board (Regierungspraesidium Darmstadt, project V54-19c20/15-FK/1083) was given on 27
581
March 2017. MEF were prepared from individual embryos at 14.5 days post-coitus of WT and Pink1
-/-582
mice, which were generated and bred as previously reported [16]. In brief, embryos were dissected
583
from the uterus, extremities and inner organs were removed and the tissue was treated with 0.05%
584
trypsin (Gibco, Thermo Scientific, Schwerte, Germany) for 10-15 min. Cells were cultivated in
585
Dulbecco's Modified Eagle Medium 4.5 g/l glucose (Invitrogen, Karlsruhe, Germany) plus 15% bovine
586
growth serum (BGS, Thermo Scientific, Schwerte, Germany), 1% glutamine, 1% penicillin and
587
streptomycin (all Invitrogen, Karlsruhe, Germany) at 37 °C and 5% CO2 in a humidified incubator, then
588
Pink1-/- cells and their respective littermate WT controls were frozen in liquid nitrogen.
589
590
Iron overload / depletion experiments:
591
MEF cells were plated in 6 well plates (500.000 cells/well) and incubated for 24 h. Cells were either
592
left in normal growth medium or treated with 200 µ M ferric ammonium citrate (FAC) (Sigma Aldrich,
593
St. Louis, USA), 100 µ M 2,2-bipyridyl (22BP) (Roth, Karlsruhe, Germany), and 100 µ M Deferoxamine
594
mesylate (DFO) (Sigma Aldrich, St. Louis, USA) for 16 h and cell pellets were collected for RNA and
595
protein isolation.
596
597
Reverse transcriptase real-time quantitative PCR:
598
For isolation of total RNA, TRI reagent (Sigma Aldrich, St. Louis, USA) was used, and VILO IV
599
(Thermo Scientific, Schwerte, Germany) for reverse transcription, both following manufacturers’
600
instructions. RT-qPCR was performed applying TaqMan Gene Expression Assays (Applied
601
Biosystems, Thermo Scientific, Schwerte, Germany) in cDNA from 20 ng total RNA in 20 µ l reactions
602
with 2× master mix (Roche, Basel, Switzerland) in a StepOnePlus Real-Time PCR System (Applied
603
Biosystems, Thermo Scientific, Schwerte, Germany). An RT-qPCR assay of Pink1 normalized to Tbp was
604
used to confirm the genotype in MEFs. For quantification of the individual mRNA levels, the following