International Journal of Engineering Research and Development
e-ISSN: 2278-067X, p-ISSN: 2278-800X, www.ijerd.com
Volume 11, Issue 03 (March 2015), PP.43-49
43
Prediction of Compressive Strength and Water Absorption of
Sand-Quarry dust Blocks Using Osadebe’s Regression Model
C. U. Anya
1, N. N. Osadebe
2,E. E. Anike
3andW.O. Onyia
41, 3Federal University of Technology, Owerri, Nigeria 2University of Nigeria, Nsukka
4Enugu State University of Science and Technology, Agbani, Nigeria
Abstract:-Block manufacturers in Nigeria are faced with the problem of mix proportioning to meet the compressive strength and water absorption requirements. This paper developed new models for predicting the 28th day compressive strength and water absorption of sand-quarry dust blocks using Osadebe’s regression model which expresses the response as a function of the proportions of the mixture components. The models were formulated using existing data and were validated using the F statistic and probability plots. A comparison of the models and the existing ones based on Scheffe’s simplex lattice models showed that there is no statistical difference between them. The new models however have wider range of application and are more user friendly.
Keywords:- Sand-quarry dust blocks, Osadebe’s regression model, mix proportioning, Scheffe’s simplex lattice model, Compressive strength, Water absorption.
I.
INTRODUCTION
Partial replacement of sand with quarry dust in the production of concrete and sandcrete block is now a common practice in Nigeria. The practice is highly encouraged as it has been shown by many researchers [1-6] to improve the structural characteristics of the concrete and sandcrete blocks. Block manufacturers in Nigeria are confronted with the problem of mix proportioning to meet the minimum requirements of Nigeria Industrial standard for sandcrete blocks [7]. The problem is even compounded when the sand is partially replaced with quarry dust as in sand-quarry dust blocks. There is therefore the need to develop models that could be used to predict the structural characteristics of sand-quarry dust blocks. Such models, if developed using statistical approaches, can also be used for studying mixture components’ interactions and optimization [8, 9].
Anya and Osadebe [10] developed models for predicting the compressive strength and water absorption of sand-quarry dust blocks using a statistical approach based on Scheffe’s simplex lattice design. Through the models, they studied the mixture components’ interactions. However, the components were expressed in pseudo ratios which have to be transformed to their actual real component ratios. Expressing the components’ proportions in pseudo ratios enabled the individual component contribution to be evaluated but made the model less user friendly. Also the models can be applied only to mixes within the simplex.
The objective of this work is to develop friendlier models with wider range of application for predicting the 28th day compressive strength and water absorption of sand-quarry dust by the use of Osadebe’sregression model in which the components’ proportions are expressed in actual proportions.
II
OSADEBE’S REGRESSION EQUATION
The Osadeberegression equation is another form of mixture experiment models. Osadebe[11] expressed the response, Y as a function of the proportions of the constituents of the mixture, Zi. For mixture
experiments, the sum of all the proportions must add up to 1. That is,
𝑍1+ 𝑍2+ ⋯ + 𝑍𝑞 = 𝑍𝑖 𝑞
𝐼=1
= 1 1
qis the number of mixture components and Zi, the proportion of component i in the mix
Osadebe assumed that the response Y is continuous and differentiable with respect to its predictors, and can be expanded in the neighborhood of a chosen point, Z(0) using Taylor’s series.
𝑍 0 = 𝑍1 0 , 𝑍2 0 , … , 𝑍𝑞 0 𝑇
(2)
44
𝑌 𝑍 = 𝐹 𝑍 0 + 𝜕𝑓 𝑍(0)
𝜕𝑍𝑖 𝑞
𝑖=1
𝑍𝑖− 𝑍 0 + 1
2!
𝜕2𝑓 𝑍0 𝜕𝑍𝑖𝜕𝑍𝑗 𝑞 𝑗 =1 𝑞−1 𝑖=1 𝑍𝑖− 𝑍𝑖 0 𝑍
𝑗− 𝑍𝑗
0
+1 2!
𝜕2𝑓 𝑍(0) 𝜕𝑍𝑖2 𝑞
𝑖=1
𝑍𝑖− 𝑍 0 … ( 3)
For convenience, the point Z0 can be taken as the origin without loss in generality of the formulation and thus;
𝑍1 0 = 0, 𝑍2 0 = 0, . . , 𝑍𝑞 0
= 0 4
Let:
𝑏0= 𝐹 0 , 𝑏𝑖= 𝜕𝐹 0
𝜕𝑍𝑖
, 𝑏𝑖𝑗 =
𝜕2𝐹 0 𝜕𝑍𝑖𝜕𝑍𝑗
, 𝑏𝑖𝑖= 𝜕2𝐹(0)
𝜕𝑍𝑖2 (5)
Substituting Equation (4) into Equation (1) gives:
𝑌 𝑍 = 𝑏0+ 𝑏𝑖𝑍𝑖 𝑞
𝑖=1
+ 𝑏𝑖𝑗𝑍𝑖𝑍𝑗 𝑞
𝑖≤𝑗 ≤𝑞
+ 𝑏𝑖𝑖𝑍𝑖2 𝑞
𝑖=1
6
Multiplying Equation (1) by b0 gives the expression:
𝑏0= 𝑏0𝑍1+ 𝑏0𝑍2+ ⋯ … … + 𝑏0𝑍𝑞 (7)
Multiplying Equation (1) successively by Z1, Z2 … Zqand rearranging, gives respectively: 𝑍12= 𝑍1− 𝑍1𝑍2− … … … … . −𝑍1𝑍𝑞
𝑍22= 𝑍2− 𝑍1𝑍2− … … … . − 𝑍2𝑍𝑞 ………
………. 𝑍𝑞2= 𝑍1− 𝑍1𝑍𝑞− … … … … . −𝑍 𝑞−1 (8)
Substituting Equations (7) and (8) into Eq. (6) and simplifying yields
𝑌 𝑍 = 𝛽𝑖𝑍𝑖 𝑞 𝑖=1 + 𝛽𝑖𝑗𝑍𝑖𝑍𝑗 𝑞 𝑖≤𝑗 ≤𝑞 (9) Where
𝛽𝑖 = 𝑏0+ 𝑏𝑖… … + 𝑏𝑖𝑖 (10) 𝛽𝑖𝑗 = 𝑏𝑖𝑗 − 𝑏𝑖𝑖− 𝑏𝑖𝑗 (11)
Equation (9) is Osadebe’s regression model equation. It is defined if the unknown constant coefficients, 𝛽𝑖 and 𝛽𝑖𝑗 are uniquely determined. If the number of constituents, q, is 4, and the degree of the polynomial, m, is 2 then the Osadebe regression equation is given as:
𝑌 = 𝛽1𝑍1+ 𝛽2𝑍2+ 𝛽3𝑍3 + 𝛽4𝑍4+ 𝛽12𝑍1𝑍2+ 𝛽13𝑍1𝑍3+ 𝛽14𝑍1𝑍4+ 𝛽23𝑍2𝑍3 + 𝛽24𝑍2𝑍4+ 𝛽34𝑍3𝑍4 (12)
The number of coefficients, N is now the same as that for the Scheffe’s {4, 2} model given by [12] as:
𝑁 = 𝐶𝑚 (𝑞+𝑚 −1)
= 𝐶2 (4+2−1)
= 10
Osadebe’s model has been applied by some researchers [13 -15] in solving various problems of concrete mix proportioning.
2.1 Determination of the coefficients of Osadebe’sregression equation
The least number of experimental runs or independent responses necessary to determine the coefficients of the Osadebe’s regression coefficients is N.
Let Y(k) be the response at point k and the vector corresponding to the set of component proportions (predictors) at point k be Z(k). That is:
Z (k) = { Z1(k), Z2(k) , ……., Zq(k) } (13)
Substituting the vector of Eq. (13) into Equation (9) gives:
𝑌 𝑘 = 𝛽𝑖𝑍𝑖 𝑘 𝑞 𝑖=1 + 𝛽𝑖𝑗𝑍𝑖 𝑘 𝑍𝑗 𝑘 𝑞 𝑖≤𝑗 ≤𝑞 (14)
Where 𝑘 = 1, 2, … , 𝑁
Substituting the predictor vectors at each of the N observation points successively into Eq. (9) gives a set of N
linear algebraic equations which can be written in matrix form as:
𝒁𝜷 = 𝒀 (15)
Where
45
𝒁 is an N xN matrix whose elements are the mixture component proportions and their functions .
𝒀is a vector of the observations or responsesat the various N observation points. The solution to Equation (15) is given as:
𝜷 = 𝒁−1𝒀 (16)
The Osadebe model is fitted to only the number of points necessary to define the polynomials. To validate the model, additional measurements are taken at the so called check or control points. The F statistic is determined from the observed and model predicted responses at the check points as follows:
Let the sample variances for the observed and predicted values at the check points be 𝑆𝑜2 and 𝑆𝑝2 and the
population variances, σ12 and σ22 respectively.If 𝑆𝑜2 and 𝑆𝑝2 are equal we conclude that the errors from the
experimental procedures are similar and hence the sample variances are estimates of the same population variance. The hypotheses can be stated as:
Ho: σ12 = σ22
Ha: σ12 ≠ σ22
The test statistic F is given as:
𝐹 =𝑆12 𝑆22
(17)
Where
𝑆12isthe greater of 𝑆𝑜2 and 𝑆𝑝2 and 𝑆22isthe lesser of 𝑆𝑜2 and 𝑆𝑝2
The calculated value of F is compared to the text values for the appropriate level of confidence, 𝛼 and degrees of freedom. The null hypothesis is accepted if the calculated value of F is less than the text value. That is:
𝐹 ≤ 𝐹𝛼 𝑣1,𝑣2 (18)
The calculation of variances and subsequent determination of the F values and the limits can be easily done using standard any of the readily available statistical software.
III.
MATERIAL AND METHODS.
The Primary data used in this work were taken from a previous study by Anya and Osadebe [10] who developed simplex lattice models for predicting the 28th day Compressive strength and Water absorption of Sand-quarry dust blocks. The responses were expressed as functions of the pseudo ratios of the components. River sand with specific gravity of 2.65, bulk density of 1564kg/m3 and fineness modulus of 2.76 was used. The corresponding values for the quarry dust were 2.74, 1296kg/m3 and 2.97. Ordinary Portland cement that conformed to NIS: 444 [16] was also used. The pseudo ratios were transformed to actual component ratios using the relationship:
R = AP 19)
Where RandP are respectively the vectors containing the actual and pseudo ratios of the components and A is a transformation matrix, its elements defined the vertices of the simplex and was obtained after trial mixes as:
The elements of each column of A represented the components’ proportions at a vertex in the followingorder: Water (X1), Cement (X2), Sand (X3) and Quarry dust (X4). The design matrix consisted of 15 independent mixes
with 5 replications giving a total of 20 runs.
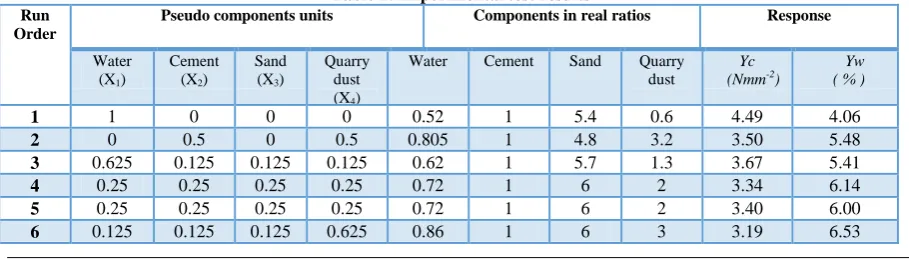
Table 1 shows the design matrix in pseudoand real ratios together with the experimental test results for compressive strength and water absorption as obtained by Anya and Osadebe [10].
Table 1: Experimental test results
Run Order
Pseudo components units Components in real ratios Response
Water (X1)
Cement (X2)
Sand (X3)
Quarry dust (X4)
Water Cement Sand Quarry dust
Yc
(Nmm-2) Yw ( % )
1 1 0 0 0 0.52 1 5.4 0.6 4.49 4.06
2 0 0.5 0 0.5 0.805 1 4.8 3.2 3.50 5.48
3 0.625 0.125 0.125 0.125 0.62 1 5.7 1.3 3.67 5.41
4 0.25 0.25 0.25 0.25 0.72 1 6 2 3.34 6.14
5 0.25 0.25 0.25 0.25 0.72 1 6 2 3.40 6.00
46
7 0 0 1 0 0.75 1 9 1 2.80 7.71
8 0 0 0.5 0.5 0.875 1 7.5 2.5 3.07 6.86
9 0 0 1 0 0.75 1 9 1 2.72 8.00
10 0.125 0.125 0.625 0.125 0.735 1 7.5 1.5 3.04 6.95
11 0 0.5 0.5 0 0.68 1 6.3 1.7 3.39 6.02
12 1 0 0 0 0.52 1 5.4 0.6 4.65 4.26
13 0 0 0 1 1 1 6 4 2.98 7.13
14 0 1 0 0 0.61 1 3.6 2.4 5.19 3.24
15 0.5 0 0 0.5 0.76 1 5.7 2.3 3.2 6.50
16 0 0 0 1 1 1 6 4 2.84 7.36
17 0.5 0 0.5 0 0.635 1 7.2 0.8 3.09 6.80
18 0 1 0 0 0.61 1 3.6 2.4 5.27 3.16
19 0.5 0.5 0 0 0.565 1 4.5 1.5 4.91 3.54
20 0.125 0.625 0.125 0.125 0.665 1 4.8 2.2 4.01 4.78 Legend: Yc =Compressive strength, Yw = Water Absorption
Source: Adapted from Anya and Osadebe[10]
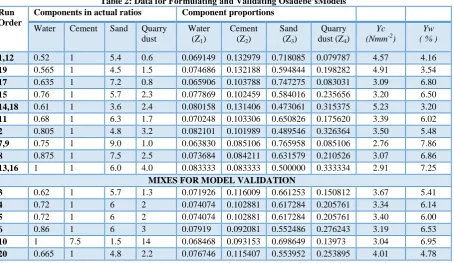
The Osadebe model can be fit to any 10 of the 15 distinct mixes of Table 1, with the actual component ratios converted to components’ proportions. The remaining mixes will be used to validate the model. Table 2 shows the 10 distinct mixes selected for the model formulation and those for model validation and the average experimental values of the compressive strength and water absorption. Cells with two Run Order numbers indicate replicated mixes. The response for such mixes is taken as the average response of the replicated mixes
Table 2: Data for Formulating and Validating Osadebe’sModels Run
Order
Components in actual ratios Component proportions
Water Cement Sand Quarry dust
Water (Z1)
Cement (Z2)
Sand (Z3)
Quarry dust (Z4)
Yc (Nmm-2)
Yw ( % )
1,12 0.52 1 5.4 0.6 0.069149 0.132979 0.718085 0.079787 4.57 4.16
19 0.565 1 4.5 1.5 0.074686 0.132188 0.594844 0.198282 4.91 3.54
17 0.635 1 7.2 0.8 0.065906 0.103788 0.747275 0.083031 3.09 6.80
15 0.76 1 5.7 2.3 0.077869 0.102459 0.584016 0.235656 3.20 6.50
14,18 0.61 1 3.6 2.4 0.080158 0.131406 0.473061 0.315375 5.23 3.20
11 0.68 1 6.3 1.7 0.070248 0.103306 0.650826 0.175620 3.39 6.02
2 0.805 1 4.8 3.2 0.082101 0.101989 0.489546 0.326364 3.50 5.48
7,9 0.75 1 9.0 1.0 0.063830 0.085106 0.765958 0.085106 2.76 7.86
8 0.875 1 7.5 2.5 0.073684 0.084211 0.631579 0.210526 3.07 6.86
13,16 1 1 6.0 4.0 0.083333 0.083333 0.500000 0.333334 2.91 7.25
MIXES FOR MODEL VALIDATION
3 0.62 1 5.7 1.3 0.071926 0.116009 0.661253 0.150812 3.67 5.41
4 0.72 1 6 2 0.074074 0.102881 0.617284 0.205761 3.34 6.14
5 0.72 1 6 2 0.074074 0.102881 0.617284 0.205761 3.40 6.00
6 0.86 1 6 3 0.07919 0.092081 0.552486 0.276243 3.19 6.53
10 1 7.5 1.5 14 0.068468 0.093153 0.698649 0.13973 3.04 6.95
20 0.665 1 4.8 2.2 0.076746 0.115407 0.553952 0.253895 4.01 4.78
Z1, Z2, Z3 and Z4respectively are the proportions of Water, Cement, Sand and Quarrydust in a mix.
IV.
RESULTS AND DISCUSSION
A. Model equations for Compressive strength.
Referring to Eq.15 the elements of the matrix Z are as given in Table 3.
Table 3: Elements of ZMatrix
Z1 Z2 Z3 Z4 Z1Z2 Z1Z3 Z1Z4 Z2Z3 Z2Z4 Z3Z4
0.069149 0.132979 0.718085 0.079787 0.009195 0.049655 0.005517 0.095490 0.010610 0.057294
0.074686 0.132188 0.594844 0.198282 0.009873 0.044427 0.014809 0.078631 0.026211 0.117947
0.065906 0.103788 0.747275 0.083031 0.006840 0.04925 0.005472 0.077558 0.008618 0.062047
47
0.080158 0.131406 0.473061 0.315375 0.010533 0.037920 0.025280 0.062163 0.041442 0.149192
0.070248 0.103306 0.650826 0.175620 0.007257 0.045719 0.012337 0.067234 0.018143 0.114298
0.082101 0.101989 0.489546 0.326364 0.008373 0.040192 0.026795 0.049928 0.033286 0.159770
0.063830 0.085106 0.765958 0.085106 0.005432 0.048891 0.005432 0.065188 0.007243 0.065188
0.073684 0.084211 0.631579 0.210526 0.006205 0.046537 0.015512 0.053186 0.017729 0.132964
0.083333 0.083333 0.500000 0.333334 0.006944 0.041667 0.027778 0.041667 0.027778 0.166667
The vector Y is given as: Y = [4.57 4.91 3.09 3.20 5.23 3.39 5.23 3.50 2.76 3.07 2.91] T. The regression coefficients as obtained from Eq. 16 are then:
The model equation is therefore:
The analysis of variance for the Osadebe compressive strength model using, Microsoft Excel [17], at α = 0.05 is presented in Table 4 while the probability plot of the residuals, made using Minitab 16 [18], is shown in Figure 1.The calculated F statistic of 1.162 is less than the critical value of 5.05 as shown in Table 4. The probability plot of Figure 1 also shows that all the points lie very close to the reference line. The conclusion therefore is that Equation 21 is adequate for predicting the 28th day strength of sand-quarry dust blocks
B. Model Equation for Water Absorption.
A similar analysis for water absorption but with the vector Y given as:
Y = [4.16 3.54 6.80 6.50 3.20 6.02 5.48 7.855 6.86 7.245] T. gave the following model equation
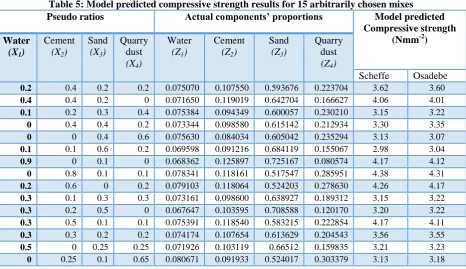
C. Comparison of Compressive Strength Models.
The Scheffe’s simplex lattice model as obtained by [10]for the Compressive strength of Sand-quarry dust blocks is
:
48
difference between the two models. A similar analysis made for the water absorption models gave a p-value of 0.975, indicating that there is no significant difference between the Osadebe and Scheffe’s water absorption models.
Table 5: Model predicted compressive strength results for 15 arbitrarily chosen mixes
Pseudo ratios Actual components’ proportions Model predicted
Compressive strength (Nmm-2) Water
(X1)
Cement
(X2)
Sand
(X3)
Quarry dust
(X4)
Water
(Z1)
Cement
(Z2)
Sand
(Z3)
Quarry dust
(Z4)
Scheffe Osadebe
0.2 0.4 0.2 0.2 0.075070 0.107550 0.593676 0.223704 3.62 3.60
0.4 0.4 0.2 0 0.071650 0.119019 0.642704 0.166627 4.06 4.01
0.1 0.2 0.3 0.4 0.075384 0.094349 0.600057 0.230210 3.15 3.22
0 0.4 0.4 0.2 0.073344 0.098580 0.615142 0.212934 3.30 3.35
0 0 0.4 0.6 0.075630 0.084034 0.605042 0.235294 3.13 3.07
0.1 0.1 0.6 0.2 0.069598 0.091216 0.684119 0.155067 2.98 3.04
0.9 0 0.1 0 0.068362 0.125897 0.725167 0.080574 4.17 4.12
0 0.8 0.1 0.1 0.078341 0.118161 0.517547 0.285951 4.38 4.31
0.2 0.6 0 0.2 0.079103 0.118064 0.524203 0.278630 4.26 4.17
0.3 0.1 0.3 0.3 0.073161 0.098600 0.638927 0.189312 3.15 3.22
0.3 0.2 0.5 0 0.067647 0.103595 0.708588 0.120170 3.20 3.22
0.3 0.5 0.1 0.1 0.075391 0.118540 0.583215 0.222854 4.17 4.11
0.3 0.3 0.2 0.2 0.074174 0.107654 0.613629 0.204543 3.56 3.55
0.5 0 0.25 0.25 0.071926 0.103119 0.66512 0.159835 3.21 3.23
0 0.25 0.1 0.65 0.080671 0.091933 0.524017 0.303379 3.13 3.18
Table 6: Single factor Anova for Scheffe’s and Osadebe’s Compressive strength models
.
SUMMARY
Groups Count Sum Average Variance
Scheffe 15 53.47 3.5646667 0.2515695
Osadebe 15 53.387778 3.5591852 0.2075697
ANOVA
Source of Variation SS df MS F P-value F crit
Between Groups 0.0002254 1 0.0002254 0.0009816 0.9752279 4.1959718
Within Groups 6.4279496 28 0.2295696
Total 6.4281749 29
V.
CONCLUSION AND RECOMMENDATION
49
REFERENCES
[1]. Oyekan, G. L. and Kamiyo, O. M. “Effects of Granite Fines on the Structural and Hygrothermal Properties of Sandcrete Blocks”,Journal of Engineering and Applied Sciences 3 (9), 735– 741, 2008, [2]. Olaniyan, O. S, Afolabi, O. M., Okeyinka, O. M. “Granite fines as a partial replacement for sand in
sandcrete block production”, International journal of Engineering and Technology, 2 (8) 1392-1394, 2012
[3]. Manasseh J. “Use of crushed granite fine as replacement to river sand in concrete production”, Leonardo electronics journal of practice and technologies, Issue 17, 85 – 96, 2010
[4]. Nagabhushana and, Sharadabai, H. “Use of crushed rock powder as replacement of fine aggregate in mortar and concrete.” Indian Journal of Science and Technology. 4 (8) 917 – 922, 2011
[5]. Sukesh, C., Krishna, K. B.,Teja, P. S. S. and Rao, S. K.“Partial Replacement of Sand with Quarry Dust in Concrete”, International Journal of Innovative Technology and Exploring Engineering (IJITEE) ISSN: 2278-3075, 2 (6) 254 – 258, 2013.
[6]. Shridaran, A., Soosan, T. G., Jose, T. and Abraham B. M. “Shear strength studies on soil quarry dust mixtures”,Geotechnical and Geological Engineering, 24 (5) 1163 – 1179, 2006
[7]. Nigerian Industrial Standards “NIS 87: Standards for Sandcrete blocks”, Standard Organization of Nigeria (SON), Lagos, 2004.
[8]. Simon, M. J. “Concrete Mixture Optimization Using Statistical Methods: Final Report”, FHWA Office of Infrastructure Research and Development, 6300, 2003
[9]. Cornell, J.Experiments with Mixtures: Designs, Models and the Analysis of Mixture Data. 3ed. New York John Wiley and Sons Inc., 2002
[10]. Anya, C. U and Osadebe, N. N. “Mixture Experiment Models for Predicting the Compressive Strength and Water Absorption of Sand-Quarry Dust Blocks”,The International Journal of Engineering and Sciences, 4 (2), 27 – 31, 2015
[11]. Osadebe, N. N. (2003). “Generalized mathematical modelling of compressive strength of normal concrete as a multi-variant function of the properties of itsconstituent components”, A paper delivered at the College of Engineering, University of Nigeria, Nsukka. 2003
[12]. Cornell, J. Experiments with Mixtures: Designs, Models and the Analysis of Mixture Data. 3rded.,New York, USA, John Wiley and Sons Inc.,2002
[13]. Anyaogu, L., Chijioke, C. and Okoye, P. “PredictionofCompressiveStrengthofPFA- Cement Concrete”,IOSR Journal of Mechanical and Civil Engineering, 6(1), 01-09, 2013
[14]. Mama, B. O. and Osadebe, N. N. “Comparative analysis of two mathematical models for prediction of compressive strength of sandcrete blocks using alluvial deposit”,Nigerian Journal of Technology, 30(2) 82 – 89, 2011
[15]. Onwuka, D. O., Okere, C. E., Arimanwa, J. I. and Onwuka, S. U. “Prediction of concrete mix ratios using modified regression theory”,Computational. Method in Civil Engineering, vol. 2, No 1. pp 95 – 107, 2011
[16]. Nigeria Industrial Standards.NIS 444: Quality standard for Ordinary Portland cement. Standard Organization of Nigeria, Lagos, 2003.