Dark Forces at DA
Φ
NE
F. Curciarello1,2,aon behalf of the KLOE-2 Collaborationb
1Dipartimento di Fisica e di Scienze della Terra, Università di Messina 2INFN Sezione Catania
Abstract.The DAΦNEΦ-factory is an ideal place to search for forces beyond the Standard Model. By using the KLOE detector, limits on U-boson couplingε2of the order of 10−5÷10−7and on theα
D×ε2product have
been set through the study of theΦDalitz decay, Uγevents and the Higgsstrahlung process. An improvement of these limits is expected thanks to the KLOE detector and DAΦNE upgrades of KLOE-2.
1 Introduction
The Standard Model of physics (SM) represents the most complete theoretical framework currently available to de-scribe fundamental particle composition and interactions. However, there are strong hints of physics beyond it as, for example, non-zero neutrino masses and the discrepancy between calculated and measured value of the muon mag-netic moment aμ. Particularly, the numerous evidences of gravitational anomalies in galaxies and in cosmic mi-crowave background [1] are usually considered as the ef-fect of a large amount of non-barionic matter, called dark matter (DM). Many extensions of the SM [2–6] consider a Weak Interacting Massive Particle (WIMP) as a viable DM candidate and assume that WIMPs are charged un-der a new kind of interaction called "dark force". This dark force between WIMPs should be mediated by a new gauge vector boson, the U boson, also referred to as dark photon or A’, with strength αD. The U is thought to be produced during dark matter annihilation processes and then decay prevalently into leptons if its mass is lower than two proton masses. Usually, the dark photon is as-sociated to an extra abelian gauge symmetry,UD, that can couple to SM through a kinetic mixing portal giving rise to a production rate strongly suppressed by the very small coupling [2–6]. The ratio of dark and SM hypercharge
ae-mail: [email protected]
bThe KLOE-2 Collaboration: D. Babusci, I. Balwierz-Pytko, G. Bencivenni, C. Bloise, F. Bossi, P. Branchini, A. Budano, L. Caldeira Balkeståhl, G. Capon, F. Ceradini, P. Ciambrone, F. Curcia-rello, E. Czerwi´nski, E. Danè, V. De Leo, E. De Lucia, G. De Robertis, A. De Santis, P. De Simone, A. Di Cicco, A. Di Domenico, C. Di Do-nato, R. Di Salvo, D. Domenici, O. Erriquez, G. Fanizzi, A. Fan-tini, G. Felici, S. Fiore, P. Franzini, A. Gajos, P. Gauzzi, G. Giardina, S. Giovannella, E. Graziani, F. Happacher, L. Heijkenskjöld, B. Höis-tad, M. Jacewicz, T. Johansson, K. Kacprzak, D. Kami´nska, A. Kupsc, J. Lee-Franzini, F. Loddo, S. Loffredo, G. Mandaglio, M. Martemi-anov, M. Martini, M. Mascolo, R. Messi, S. Miscetti, G. Morello, D. Moricciani, P. Moskal, F. Nguyen, A. Palladino, A. Passeri, V. Patera, I. Prado Longhi, A. Ranieri, P. Santangelo, I. Sarra, M. Schioppa, B. Sci-ascia, M. Silarski, C. Taccini, L. Tortora, G. Venanzoni, W. Wi´slicki, M. Wolke, J. Zdebik
h
ij dark F
ij QED F
χ
Figure 1.Kinetic mixing mechanism;χis a dark matter particle, FQEDij and F
ij
darkare the SM hypercharge and dark tensors
respec-tively, h is the Higgs boson
coupling constants gives the mixing strength ε2 between the photon and the dark photon [2]. A further hypothesis is that the new symmetry is spontaneously broken by an Higgs-like mechanism, thus resulting in the existence of an additional scalar particle in the dark sector. A U bo-son with mass ofO(1GeV) andεin the range 10−2–10−7 could explain all puzzling effects observed in recent astro-physics experiments [7–13] and account also for the muon magnetic moment anomaly. For this reason, many efforts have been made in the last years to find evidence of its ex-istence, with unfortunately null result for the moment [14– 21].
At KLOE-2, dark forces can be probed by using dif-ferent approaches involving meson decays, Uγradiative return processes and Higgsstrahlung.
In the following we will report on the status of dark forces searches at KLOE/KLOE-2.
2 DA
Φ
NE facility and KLOE Detector
DAΦNE is ane+e−collider running at the energy √s =
mφ =1.0195 GeV which is located at the National Labo-ratories of Frascati of INFN. It consists of a linear accel-DOI: 10.1051/
C
Owned by the authors, published by EDP Sciences, 2015 /201
epjconf 596010 0
This is an Open Access article distributed under the terms of the Creative Commons Attribution License 4.0, which permits unrestricted use, distribution, and reproduction in any medium, provided the original work is properly cited.
erator, a damping ring, nearly 180 m of transfer lines, two storage rings that intersect at two points.
The KLOE detector is made up of a large cylindri-cal drift chamber (DC), surrounded by a lead scintillat-ing fiber electromagnetic calorimeter (EMC). A supercon-ducting coil around the EMC provides a 0.52 T magnetic field. The EMC provides measurement of photon ener-gies, impact point and an accurate measurement of the time of arrival of particles. The DC is well suited for tracking of the particles and reaction vertex reconstruc-tion. The calorimeter is divided into a barrel and two end– caps and covers 98% of the solid angle. The modules are read out at both ends by 4880 photo–multipliers. Energy and time resolutions are σE/E = 5.7%/√E(GeV) and σt = 57 ps/√E(GeV) ⊕100 ps, respectively. The
all-stereo drift chamber, 4min diameter and 3.3mlong, has a mechanical structure of carbon fiber-epoxy composite and operates with a light gas mixture (90% helium, 10% isobutane). The position resolutions are σxy ∼ 150μm andσz ∼ 2 mm. The momentum resolution isσp⊥/p⊥ better than 0.4% for large angle tracks. Vertices are recon-structed with a spatial resolution of∼3 mm.
3 Dark forces at KLOE
KLOE is particularly suited for dark forces searches thanks to the high data statistics, the clear event topolo-gies and a good knowledge of backgrounds. Moreover, the cross sections of many processes involving dark pho-ton at e+e− colliders scale with 1/s, compensating the lower luminosity with respect to B-factories. Furthermore, DAΦNE it’s an ideal place to study rare light meson de-cays.
At KLOE, dark forces have been investigated by using three different methods: light meson decays, Uγ events and by Higgsstrahlung process.
3.1 ΦDalitz decay
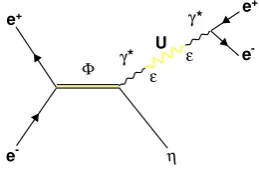
The U boson can be produced in vector (V) to pseu-doscalar (P) meson decays, with a rate that is ε2 times suppressed with respect to the ordinary V → P transi-tions [22] (see Fig. 2). The U boson is supposed to de-cay intoe+e−with a non-negligible branching ratio, thus, V → PU events are expected to produce a sharp peak in the invariant mass distribution of the electron-positron pair over the continuum Dalitz background V→Pe+e−.
-e
+
e
*
γ U
* γ
-e
+
e
ε ε
Φ
η
Figure 2.U boson production through Dalitzφmeson decay
By following this idea, KLOE published two limits on the U-boson couplingε2, investigating theφ→ηe+e− de-cay, where theηmeson was tagged by itsπ+π−π0[16] and 3π0decays [17]. The first analysis selected about 13,000 events by analyzing a data sample of 1.5fb−1 integrated luminosity with a 2% of background contamination. The limit was set by using the Confidence Level Signal (CLS) technique [23–26]. This first upper limit (UL) has been then combined, improving sample statistic (1.7fb−1) and background rejection, with a new limit derived by tagging theηmeson by its neutral decay into 3π0[17]. For this new analysis, 30577 events are selected with 3% background contamination and an analysis efficiency of 15–30% at low and highe+e−invariant mass, respectively. The determi-nation of the limit is done by varying theMUmass, with 1 MeV step, in the range between 5 and 470 MeV. Only five bins (5 MeV width) of the reconstructed Mee vari-able, centered at MU are considered. For each channel, the irreducible background is extracted directly from our data after applying a bin-by-bin subtraction of the non-irreducible backgrounds and correcting for the analysis ef-ficiency. TheMeedistribution is then fit, excluding the bins used for the upper limit evaluation.
Figure 3. Meespectrum for the Dalitz decayφ → ηe+e−, with
η→π0π0π0(top) andη→π+π−π0(bottom), red line is a fit to
the distribution
The limit has been extracted for bothηdecay channels and then combined. The combined limit evaluation is done by taking into account the different luminosity, efficiency and relative branching ratios of the two data samples.
In Fig. 4, top, the UL at 90% confidence level (CL) is shown for each ηdecay channels. In Fig. 4, bottom, the smoothed combined upper limit on the branching fraction for the process φ → ηU,U → e+e−, is compared with evaluations from each of the twoηdecays. The combined UL on the productBR(φ → ηU)×BR(U→ e+e−) varies from 10−6 at smallM
Udown to 3×10⁻⁸. Using the Vec-tor Meson Dominance expectation for the transition form factor slope (bφη ∼1 GeV2) an UL on the parameterε2at 90% CL can be derived ofε2<1.7×10⁻⁵for 30<M
Figure 4. Top: upper limit at 90% CL on the number of events for the decay chainφ → ηU,U→ e+e−withη→ π0π0π0and
η → π+π−π0. Bottom: smoothed upper limit at 90% CL on
BR(φ → ηU)×BR(U → e+e−) for the twoηdecay channels and for the combined procedure
of U-boson parameters as possible explanation of theaμ discrepancy.
3.2 Uγevents
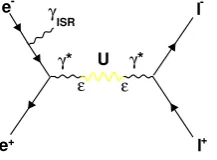
The U boson can be produced in any process in which a photon is involved but with a rate strongly suppressed by the small coupling. At KLOE, an interesting channel is the U-boson radiative productione+e− →Uγ,U→l+l−,l=
e, μshown in Fig. 5.
+
e
-e
*
γ U
ISR
γ
+
l
-l
ε ε
* γ
Figure 5. Resonant U-boson production ine+e−collisions with Initial State Radiation (ISR) emission
It is considered a very simple and clean channel, inde-pendent of the existence and of the details of the Higgs sector of the secluded group. The expected signal is a Breit-Wigner peak in the invariant mass distribution of the lepton pair induced by the mechanism of photon radia-tive return and corresponding to U-boson resonant produc-tion [27].
KLOE investigated both the μ+μ−γ and e+e−γ final states.
3.2.1 μ+μ−γlimit
This search employed a data sample collected in 2002 at DAΦNE e+e− collider with an integrated luminosity
of 239.3 pb−1. The U-boson peak would appear in the dimuon mass spectrum. The μ+μ−γ event selection re-quires two tracks of opposite charge with 50◦< θ <130◦ and an undetected photon whose momentum points at small polar angle (θ <15◦, >165◦) [28, 29]. Pions and muons are separated by means of the variable Mtrk de-fined as the mass of particlesx+, x−in thee+e−→x+x−γ process, calculated from the overdetermined system of kinematical constraints of the reaction. The Mtrk values between 80–115 identify muons while Mtrk values>130 MeV identify pions. To improve π/μ separation a cut based on the quality of fitted tracks has been used resulting in a suppression of the left tail ofππγ Mtrkdistribution up to 40% [28]. At the end of the analysis chain, the resid-ual background is obtained by fitting the Mtrk data dis-tribution with Monte Carlo (MC) simulations describing signal,π+π−γandπ+π−π0backgrounds plus a distribution obtained from data for thee+e−γ [28, 29].
(GeV) μ μ
M
0.6 0.7 0.8 0.9
(nb/GeV)μ
μ
M
/d
σ
d
0 5 10 15 20 25 30 35 40
KLOE measurement γ
μ μ
PHOKARA simulation γ
μ μ
Figure 6. μ+μ−γabsolute cross section for data compared with
the QED NLO MC PHOKHARA prediction in the 520–980 MeV energy range
(GeV)
U M
0.6 0.7 0.8 0.9
Entries/(0.002 GeV)
0 200 400 600 800 1000
90% CL
Figure 7.Upper limit on number of U-boson events excluded at the 90% CL
PHOKHARA [30], as shown in Fig. 6. No structures are visible in the Mμμ spectrum. We extracted the limit on the number of U-boson candidates through the CLS tech-nique [23–26] by comparing the expected and observed μ+μ−γyield, and a MC generation of the U-boson signal
which takes into account theMμμinvariant mass resolution (1.5 MeV to 1.8 MeV asMμμincreases), see Fig. 7. A sys-tematic error of 1.4–1.8% on the expected background has also been taken into account in the limit evaluation. The limit on the number of U-boson events has been converted in terms of the kinetic mixing parameterε2 by using the following formula:
ε2(M
ll)= NCLS(MHll)/((Meff(Mll)×L(Mll))
ll)×I(Mll) , (1)
where l=μ, eff(Mll) represents the overall efficiency
(1-15% asMμμincreases [28]),L(Mll) is the integrated lumi-nosity,H(Mll) is the radiator function obtained from QED including NLO corrections [28], andI(Mll) is the effective U cross section [4]. The limit onε2 [28] is of 1.6×10⁻⁵ and 8.6×10⁻⁷ in the 520–980 MeV energy range. This limit represents the first one derived by a direct study of theμ+μ−γchannel.
3.2.2 e+e−γlimit
The KLOE search for the U→e+e−employed a data sam-ple of an integrated luminosity of 1.54 fb−1. In this analy-sis the hard ISR photon has been explicitly detected in the calorimeter barrel by requiring for the charged leptons and photon a polar angle 50◦<θ<130◦. This large-angle event selection allowed us to have a sufficient statistics to reach the dielectron mass threshold. A cut on the track mass variable (−70 MeV<Mtrk<70 MeV) was again applied to remove background contamination fromμ+μ−γ,π+π−γ, π+π−π0, e+e− → γγ (where the photon converts into an e+e−pair) and other φdecays. At the end of the
analy-sis chain the background contamination is less than 1.5%. Figure 8 shows the final dielectron invariant-mass
distribu-Figure 8. Dielectron invariant mass distribution compared with Babayaga-NLO simulation
tion demonstrating excellent agreement with a Babayaga-NLO MC simulation [27]. Also in this case no resonant
U-boson peak was observed and again the CLStechnique is applied to estimate NCLs , the number of U-boson sig-nal events excluded at 90% CL (see Fig. 9). A
prelimi-Figure 9.Upper limit on number of U-boson candidates at 90% CL, violet line is a smoothing
nary limit on the kinetic mixing parameter as a function of MUwas set by using eq. 1 withl=e,eff(Mll)=1.5–2.5% and L=1.54 fb−1. The resulting exclusion plot is shown in Fig. 11 with all other existing limits in the region of 0–1000 MeV.
3.3 Dark Higgsstrahlung process
A natural consequence of the U-boson existence is the breaking of the UDsymmetry associated to it by a Higgs-like mechanism through an additional scalar particle, the dark Higgs h. The expected signature depends on the U and hmass hierarchy . If the his lighter than the U bo-son it turns out to be very long-lived and escapes detection (see Ref. [31]). The expected signal will be a lepton pair from the U-boson decay plus missing energy.
-e
+
e
* γ
h’
-l
+
l
ε U
U
Figure 10. Diagram of the U-boson production through Hig-gsstrahalung process
Figure 11. 90% CL KLOE exclusion plots forε2as a function of the U-boson mass [16, 17, 28]. Limits from A1 [14], Apex [15],
WASA [18], HADES [19] and BaBar [20] are also shown. The black and grey lines are the limits from the muon and electron magnetic moment anomalies [21]
invisible [32]. The analysis has been performed by us-ing a data sample of 1.65 fb−1collected at center of mass energy Ecm corresponding to theφ peak (∼1019 MeV) and a data sample of 0.2 fb−1 at E
cm = 1000 MeV (off -peak sample). The event selection requires [32] events with only two opposite charge tracks, with a reconstructed vertex inside a 4×30 cm cylinder around the interaction point (IP). Each track must have an associated EMC clus-ter and the visible momentum direction has to be in the barrel (|cosθ| < 0.75). After the missing energy and the particle identification selections, a huge background from φ → K+K−,K± → μ±νevents survives in the on-peak sample. A cut based on the vertex-IP distance and on the goodness of the track fittingχ2allowed to reduce the K±background. The expected signal would appear in the
Mμμ−Mmissbi-dimensional spectra. In order too keep most of the signal in one bin only, a 5 MeV bin width in the
Mμμhas been chosen while forMmissa variable binning of 15, 30 and 50 MeV widths is used. Results are shown in Fig. 12 for the on-peak and off-peak sample. In the second case of course the huge backgrounds coming fromφ res-onant processes are suppressed. No signal signature has
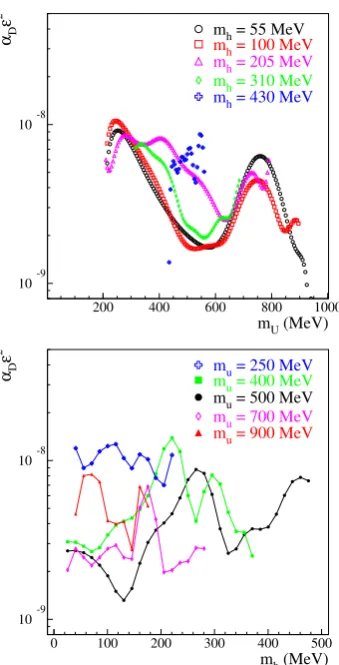
been observed and a bayesian limit on the number of sig-nal events at 90% CL has been evaluated, bin-by-bin, for the on-peak and off-peak sample separately. A conserva-tive systematic error of about 10% is considered for the limit extraction. Results have been translated in terms of αD×ε2 by using the integrated luminosity information, the signal efficiency (15–25%), the dark Higgsstrahlung cross section and the branching fraction of the U→μ+μ− decay [31]. Results were then combined by taking into account the different integrated luminosities, different sig-nal efficiencies and cross sections of the two data sam-ples. The combined preliminary upper limits projected in the Mμμ and Mmiss directions and slightly smoothed are shown in Fig. 13. Values of the order of 10−9 ÷10−8 in αD×ε2 are excluded at 90% CL for a large range of the dark photon and dark Higgs masses. These limits translate inε∼10−3−10−4forα
Figure 12. Top panel: Mmiss Vs Mμμ for on-peak sample
(1.65 fb−1 integrated luminosity). Bottom panel: M
missVsMμμ for the off-peak sample, (0.2 fb−1integrated luminosity)
Conclusions
The KLOE2 Collaboration searched for dark forces by performing five analyses on four different processes. No evidence for the existence of new "dark" particles was found. 90% CL limits of 10−7 −10−5 have been set on the kinetic mixing parameterε2in the energy range 5–980 MeV. Bayesian 90% CL limits on the productαD×ε2of 10−9−10−8in the parameter space 2m
μ<MU<1000 MeV and 10<mh <500 MeV have been extracted. DAΦNE luminosity and detectors upgrades, especially the insertion of the inner tracker, are expected to improve these limits of a factor of about two in the next KLOE-2 experiment.
References
[1] Particle Data Group Collaboration, J. Beringer et al., Phys. Rev. D86, 010001 (2012)
[2] B. Holdom, Phys. Lett. B166, 196 (1985)
[3] C. Boehm, P. Fayet, Nucl. Phys. B683, 219 (2004) [4] P. Fayet, Phys. Rev. D75, 115017 (2007)
[5] Y. Mambrini, J. Cosmol. Astropart. Phys.1009, 022 (2010)
10-9 10-8
200 400 600 800 1000
mU (MeV)
αD
ε
2
mh = 55 MeV
mh = 100 MeV mh = 205 MeV
mh = 310 MeV
mh = 430 MeV
10-9 10-8
0 100 200 300 400 500
mh (MeV)
αD
ε
2
mu = 250 MeV
mu = 400 MeV
mu = 500 MeV
mu = 700 MeV mu = 900 MeV
Figure 13.Preliminary combined 90% CL upper limits inαD×ε2
as a function ofMμμfor different values ofmh(upper plot) and as
a function ofMmissfor different values ofMU(bottom plot plot)
[6] M. Pospelov, A. Ritz, M.B. Voloshin, Phys. Lett. B 662, 53 (2008)
[7] O. Adriani, et al., Nature458, 607 (2009)
[8] M. Aguilar, et al. Phys. Rev. Lett. 110, 141102 (2013)
[9] P. Jean, et al., Astronomy Astrophysics 407, L55 (2003)
[10] J. Chang, et al., Nature456, 362 (2008)
[11] F. Aharonian, et al., Phys. Rev. Lett. 101, 261104 (2008)
[12] A. A. Abdo, et al., Phys. Rev. Lett. 102, 181101 (2009)
[13] R. Barnabei, et al., Eur. Phys. J. C56, 333 (2008) [14] H. Merkel, et al., Phys. Rev. Lett. 112 221802,
(2014)
[15] S. Abrahamyan, et al., Phys. Rev. Lett.107, 191804 (2011)
[16] F. Archilli, et al., Phys. Lett. B706, 251 (2012) [17] D. Babusci, et al., Phys. Lett. B720, 111 (2013) [18] P. Adlarson, et al., Phys. Lett. B726, 187 (2013) [19] G. Agakishiev et al., Phys. Lett. B731, 265 (2014) [20] B. Aubert, et al., Phys. Rev. Lett. 103, 081803
Toro, Phys. Rev. D80, 075018 (2009); J. P. Lees et al., Phys. Rev. Lett.113, 201801 (2014)
[21] M. Pospelov, Phys. Rev. D80, 095002 (2009) [22] M. Reece, L.T. Wang, JHEP07, 051 (2009)
[23] G. J. Feldman and R. D. Cousins, Phys. Rev. D57, 3873 (1998)
[24] T. Junk, Nucl. Instr. Meth. A434, 435 (1999) [25] A. L. Read, J. Phys. G: Nucl. Part. Phys.28, 2693
(2002)
[26] http://root.cern.ch/root/html/TLimit.html
[27] L. Barzè et al., Eur. Phys. J. C71, 1680 (2011) [28] D. Babusci et al., Phys. Lett. B736, (2014) 459 [29] D. Babusci, et al., Phys. Lett. B720, (2013) 336 [30] H. Czy˙z , A. Grzelinska, J.H. Kühn, G. Rodrigo, Eur.
Phys. J. C39, (2005) 411
[31] B. Batell et al., Phys. Rev. D79, 11508 (2009) [32] D. Babusci et al., arXiv:1501.06795 [hep-ex] [33] J.P. Lees et al. (BaBar Collab.) Phys. Rev. Lett.108,


![Figure 11. 90% CL KLOE exclusion plots for ε2 as a function of the U-boson mass [16, 17, 28]](https://thumb-us.123doks.com/thumbv2/123dok_us/8172671.1364690/5.595.88.509.83.412/figure-cl-kloe-exclusion-plots-function-boson-mass.webp)