Design & Development of an Automatic Test Packet Generation
Prototype for Resolving Functional and Performance Problems
Ayaz Mohiuddin
1&Mohammed Ayazuddin
21. Lecturer, Department of Information Technology, Salalah College of Technology, Salalah,
Sultanate of Oman, Saudi Arabia.
2. Assistant Professor, Department of IT, Nawab Shah Alam Khan College of Engineering &
Technology, Malakpet, Hyderabad, Telangana, India.
ABSTRACT:
Networks are getting larger and more complex, yet administrators rely on rudimentary tools such asand to debug problems. We propose an automated and systematic approach for testing and debugging networks called
“Automatic Test Packet Generation” (ATPG). ATPG reads router configurations and generates a device-independent
model. The model is used to generate a minimum set of test packets to (minimally) exercise every link in the network or
(maximally) exercise every rule in the network. Test packets are sent periodically, and detected failures trigger a
separate mechanism to localize the fault. ATPG can detect both functional (e.g., incorrect firewall rule) and
performance problems (e.g., congested queue). ATPG complements but goes beyond earlier work in static checking
(which cannot detect liveness or performance faults) or fault localization (which only localize faults given liveness
results). We describe our prototype ATPG implementation and results are indicated on two real-world data sets. We find
that a small number of test packets suffices to test all rules in these networks: For example, 4000 packets can cover all
rules in Stanford backbone network, while 54 are enough to cover all links. Sending 4000 test packets 10 times per
second consumes less than 1% of link capacity. ATPG code and the datasets are publicly available.
Keywords:
Automated Test Packet Generation (ATPG); Media Access Control Address; Ethernet Network; Fault Localization; All-Pairs Reachability Table; Polynomial RuntimeINTRODUCTION
Networking is the word basically relating to computers and their connectivity. It is very often used in the world of computers and their use in different connections. The term networking implies the link between two or more computers and their devices, with the vital purpose of sharing the data stored in the computers, with each other. The networks between the computing devices are very common these days due to the launch of various hardware and computer software which aid in making the activity more convenient to build and use.[1]
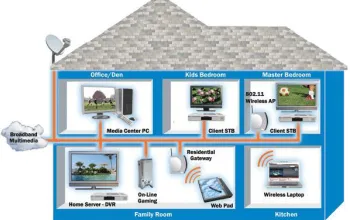
Figure 2: Networking Functions
When computers communicate on a network, they send out data packets without knowing if anyone is listening. Computers in a network all have a connection to the network and that is called to be connected to a network bus. What one computer sends out will reach all the other computers on the local network.[2] Above diagrams show the
clear idea about the networking functions.
For the different computers to be able to distinguish between each other, every every computer has a unique ID called MAC-address (Media Access Control Address). This address is not only unique on your network but unique for all devices that can be hooked up to a network. The MAC-address is tied to the hardware and has nothing to do with IP-addresses. Since all computers on the network receives everything that is sent out from all other computers the MAC-addresses is primarily used by the computers to filter out incoming network traffic that is addressed to the individual computer.[3] When a computer communicates with another computer on the network, it sends out both the other computers MAC-address and the MAC-address of its own. Inthat way the receiving computer will not only recognize that this packet is for me but also, who sent this data packet so a return response can be sent to the sender.[4]
MAC-address (Media Access Control
Address)
This address is not only unique on a network but unique for all devices that can be hooked up to a network. The MAC-address is tied to the hardware and has nothing to do with IP-addresses. Since all computers on the network receives everything that is sent out from all other computers the MAC-addresses is primarily used by the computers to filter out incoming
network traffic that is addressed to the individual computer. When a computer communicates with another computer on the network, it sends out both the other computers MAC-address and the MAC-address of its own. In that way the receiving computer will not only recognize that this packet is for me but also who sent this data packet so a return response can be sent to the sender.
On an Ethernet network
As described here, all computers hear all network traffic since they are connected to the same bus. This network structure is called multi-drop. On a network that is heavy loaded even the resent packets collide with other packets and have to be resent again. If several computers communicate with each other at high speed they may not be able to utilize more than 25% of the total network bandwidth. This is a the way to minimize this problem is to use network switches.One problem with this network structure is that when you have, let say ten computers on a network and they communicate frequently and due to that they send out there data packets randomly, collisions occur between them.
Characteristics of Networking
The following characteristics should be considered in network design and ongoing maintenance:
1) Availability
is typically measured in a percentagebased on the number of minutes that exist in a year. Therefore, uptime would be the number of minutes the network is available divided by the number of minutes in a year.
2) Cost
includes the cost of the network components,their installation, and theirongoing maintenance.
3) Reliability
defines the reliability of the networkcomponents and the connectivity between them. Mean time between failures (MTBF) is commonly used to measure reliability. [5]
4) Security
includes the protection of the networkcomponents and the data they contain and/or the data transmitted between them.
5) Speed
includes how fast data is transmitted betweennetwork end points (thedata rate).
6) Scalability
defines how well the network can adaptto new growth, including new users, applications, and network components.
7) Topology
describes the physical cabling layout andthe logical way datamoves between components. [6]
Types of Networks
budgets need different types of networks. Networks can be divided into one of two categories:
Peer-to-Peer Network:
A peer-to-peer network has no dedicated servers; instead, a number of workstations are connected together for the purpose of sharing information or devices. Peer-to-peer networks are designed to satisfy the networking needs of home networks or of small companies that do not want to spend a lot of money on a dedicated server but still want to have the capability to share information or devices like in school, college, cyber cafe
Server-Based Networks:
In server-based network data files that will be used by all of the users are stored on the one server. With a server-based network, the network server stores a list of users who may use network resources and usually holds the resources as well. This will help by giving you a central point to set up permissions on the data files, and it will give you a central point from which to back up all of the data in case data loss should occur.[7]
Network Communications:
Computer networks use signals to transmit data, and protocols are the languages computers use to communicate.
Protocols provide a variety of communications services to the computers on the network.
Local area networks connect computers using a shared, half-duplex, baseband medium, and wide area networks link distant networks.
Enterprise networks often consist of clients and servers on horizontal segments connected by a common backbone, while peer-to-peer networks consist of a small number of computers on a single LAN.
Advantages of Networking:
1. Easy Communication:
It is very easy to communicate through a network. People can communicate efficiently using a network with a group of people. They can enjoy the benefit of emails, instant messaging, telephony, video conferencing, chat rooms, etc.
2.
Ability to Share Files, Data and
Information:
This is one of the major advantages of networking computers. People can find and share information and data because of networking. This is beneficial for large organizations to maintain their data
in an organized manner and facilitate access for desired people.[8]
3.
Sharing Hardware:
Another important advantage of networking is the ability to share hardware.
For an example, a printer can be shared among the users in a network so that there’s no need to have individual printers for each and every computer in the company. This will significantly reduce the cost of purchasing hardware.
4. Sharing Software:
Users can share software within the network easily. Networkable versions of software are available at considerable savings compared to individually licensed version of the same software. Therefore large companies can reduce the cost of buying software by networking their computers.
5. Security:
Sensitive files and programs on a network can be password protected. Then those files can only be accessed by the authorized users. This is another important advantage of networking when there are concerns about security issues. Also each and every user has their own set of privileges to prevent those accessing restricted files and programs.[9]
6. Speed:
Sharing and transferring files within networks is very rapid, depending on the type of network. This will save time while maintaining the integrity of files.
LITERATURE SURVEY
tradeoff between ensuring that all links in a network are frequently monitored to detect performance anomalies, while minimizing probing overhead. The localization algorithm is designed to use existing path measurement data in such a way as to minimize the number of paths necessary for additional probing in order to identify the link(s) responsible for an observed performance anomaly. Our results show that our method is able to accurately detect and localize performance anomalies in a timely fashion and with lower probe and computational overheads than previously proposed methodologies.
In this research paper, we develop failure-resilient techniques for monitoring link delays and faults in a Service Provider or Enterprise IP network. Our two-phased approach attempts to minimize both the monitoring infrastructure costs as well as the additional traffic due to probe messages. In the first phase, we compute the locations of a minimal set of monitoring stations such that all network links are covered, even in the presence of several link failures. Subsequently, in the second phase, we compute a minimal set of probe messages that are transmitted by the stations to measure link delays and isolate network faults. We show that both the station selection problem as well as the probe assignment problem are NP-hard. We then propose greedy approximation algorithms that achieve a logarithmic approximation factor for the station selection problem and a constant factor for the probe assignment problem. These approximation ratios are provably very close to the best possible bounds for any algorithm.[11]
We present a new symbolic execution tool, KLEE, capable of automatically generating tests that achieve high coverage on a diverse set of complex and environmentally-intensive programs. We used KLEE to thoroughly check all 89 stand-alone programs in the GNU COREUTILS utility suite, which form the core user-level environment installed on millions of UNIX systems, and arguably are the single most heavily tested set of open-source programs in existence. KLEE-generated tests achieve high line coverage — on average over 90% per tool (median: over 94%) and significantly beat the coverage of the developers' own hand-written test suites.[12] When we did the same for 75 equivalent tools in the BUSYBOX embedded system suite, results were even better, including 100% coverage on 31 of them. We also used KLEE as a bug finding tool, applying it to 452 applications (over 430K total lines of code), where it found 56 serious bugs,
including three in COREUTILS that had been missed for over 15 years. Finally, we used KLEE to cross-check purportedly identical BUSY-BOX and COREUTILS utilities, finding functional correctness errors and a myriad of inconsistencies.
The emergence of Open Flow-capable switches enables exciting new network functionality, at the risk of programming errors that make communication less reliable. The centralized programming model, where a single controller program manages the network, seems to reduce the likelihood of bugs. However, the system is inherently distributed and asynchronous, with events happening at different switches and end hosts, and inevitable delays affecting communication with the controller. In this paper, we present efficient, systematic techniques for testing unmodified controller programs. Our NICE tool applies model checking to explore the state space of the entire system--the controller, the switches, and the hosts. Scalability is the main challenge, given the diversity of data packets, the large system state, and the many possible event orderings. To address this, we propose a novel way to augment model checking with symbolic execution of event handlers (to identify representative packets that exercise code paths on the controller). We also present a simplified Open Flow switch model (to reduce the state space), and effective strategies for generating event interleaving likely to uncover bugs. Our prototype tests Python applications on the popular NOX platform. In testing three real applications--a MAC-learning switch, in-network server load balancing, and energy-efficient traffic engineering--we uncover eleven bugs.[13]
real network performance measures that exhibit the required properties. Moreover, the algorithm is sufficiently simple that we can analyze its performance explicitly.[15]
SYSTEM STUDY
FEASIBILITY STUDY
The feasibility of the project is analyzed in this phase and business proposal is put forth with a very general plan for the project and some cost estimates. During system analysis the feasibility study of the proposed system is to be carried out. This is to ensure that the proposed system is not a burden to the company. For feasibility analysis, some understanding of the major requirements for the system is essential.
Three key considerations involved in the feasibility analysis are
ECONOMIC FEASIBILITY TECHNICAL FEASIBILITY SOCIAL FEASIBILITY
ECONOMIC FEASIBILITY
This study is carried out to check the economic impact that the system will have on the organization. The amount of fund that the company can pour into the research and development of the system is limited. The expenditures must be justified. Thus the developed system as well within the budget and this was achieved because most of the technologies used are freely available. Only the customized products had to be purchased.
TECHNICAL FEASIBILITY
This study is carried out to check the technical feasibility, that is, the technical requirements of the system. Any system developed must not have a high demand on the available technical resources. This will lead to high demands on the available technical resources. This will lead to high demands being placed on the client. The developed system must have a modest requirement, as only minimal or null changes are required for implementing this system.
SOCIAL FEASIBILITY
The aspect of study is to check the level of acceptance of the system by the user. This includes the process of training the user to use the system efficiently. The user must not feel threatened by the system, instead must accept it as a necessity. The level of acceptance by the users solely depends on the methods that are employed to educate the user about the system and to make him familiar with it. His level of confidence must be raised so that he is also able to
make some constructive criticism, which is welcomed, as he is the final user of the system.
SYSTEM ARCHITECTURE
Figure 3: System Architecture
DATA FLOW DIAGRAM
• The DFD is also called as bubble chart. It is a simple graphical formalism that can be used to represent a system in terms of input data to the system, various processing carried out on this data, and the output data is generated by this system.
• The data flow diagram (DFD) is one of the most important modeling tools. It is used to model the system components. These components are the system process, the data used by the process, an external entity that interacts with the system and the information flows in the system.
• DFD shows how the information moves through the system and how it is modified by a series of transformations. It is a graphical technique that depicts information flow and the transformations that are applied as data moves from input to output.
•
DFD is also known as bubble chart. A DFD may be used to represent a system at any level of abstraction. DFD may be partitioned into levels that represent increasing information flow and functional detail.UML DIAGRAMS
UML stands for Unified Modeling Language. UML is a standardized general-purpose modeling language in the field of object-oriented software engineering. The standard is managed, and was created by the Object Management Group.
The goal is for UML to become a common language for creating models of object oriented computer software. In its current form UML is comprised of two major components: a Meta-model and a notation. In the future, some form of method or process may also be added to; or associated with, UML.
The Unified Modeling Language is a standard language for specifying, Visualization, Constructing and documenting the artifacts of software system, as well as for business modeling and other non-software systems.
The UML represents a collection of best engineering practices that have proven successful in the modeling of large and complex systems.
The UML is a very important part of developing objects oriented software and the software development process. The UML uses mostly graphical notations to express the design of software projects.
GOALS:
The Primary goals in the design of the UML are as follows:
• Provide users a ready-to-use, expressive visual modeling Language so that they can develop and exchange meaningful models. • Provide extendibility and specialization
mechanisms to extend the core concepts. • Be independent of particular programming
languages and development process.
• Provide a formal basis for understanding the modeling language.
• Encourage the growth of OO tools market. • Support higher level development concepts
such as collaborations, frameworks, patterns and components.
• Integrate best practices.
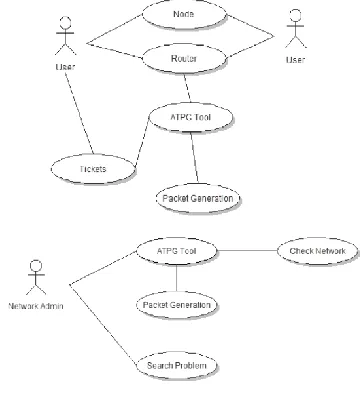
USE CASE DIAGRAM
A use case diagram in the Unified Modeling Language (UML) is a type of behavioral diagram defined by and created from a Use-case analysis. Its purpose is to present a graphical overview of the
functionality provided by a system in terms of actors, their goals (represented as use cases), and any dependencies between those use cases. The main purpose of a use case diagram is to show what system functions are performed for which actor. Roles of the actors in the system can be depicted.
Figure 5: Use Case Diagram
SEQUENCE DIAGRAM
A sequence diagram in Unified Modeling Language (UML) is a kind of interaction diagram that shows how processes operate with one another and in what order. It is a construct of a Message Sequence Chart. Sequence diagrams are sometimes called event diagrams, event scenarios, and timing diagrams.
ACTIVITY DIAGRAM
Activity diagrams are graphical representations of workflows of stepwise activities and actions with support for choice, iteration and concurrency. In the Unified Modeling Language, activity diagrams can be used to describe the business and operational step-by-step workflows of components in a system. An activity diagram shows the overall flow of control.
Figure 7: Activity Diagram
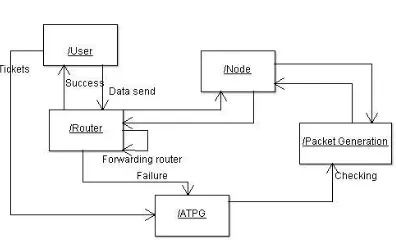
Collaboration Diagram
Figure 8: Collaboration Diagram
INPUT DESIGN
The input design is the link between the information system and the user. It comprises the developing specification and procedures for data preparation and those steps are necessary to put transaction data in to a usable form for processing can be achieved by inspecting the computer to read data from a written or printed document or it can occur by having people keying the data directly into the system. The design of input focuses on controlling the amount of input required, controlling the errors, avoiding delay, avoiding extra steps and keeping the process simple. The input is designed in such a way so that it provides security and ease of use with retaining the privacy. Input Design considered the following things:
What data should be given as input? How the data should be arranged or coded? The dialog to guide the operating personnel
in providing input.
Methods for preparing input validations and steps to follow when error occur.
OBJECTIVES
Input Design is the process of converting a user-oriented description of the input into a computer-based system. This design is important to avoid errors in the data input process and show the correct direction to the management for getting correct information from the computerized system. It is achieved by creating user-friendly screens for the data entry to handle large volume of data. The goal of designing input is to make data entry easier and to be free from errors. The data entry screen is designed in such a way that all the data manipulates can be performed. It also provides record viewing facilities.
When the data is entered it will check for its validity. Data can be entered with the help of screens. Appropriate messages are provided as when needed so that the user will not be in maize of instant. Thus the objective of input design is to create an input layout that is easy to follow.
OUTPUT DESIGN
A quality output is one, which meets the requirements of the end user and presents the information clearly. In any system results of processing are communicated to the users and to other system through outputs. In output design it is determined how the information is to be displaced for immediate need and also the hard copy output. It is the most important and direct source information to the user.
Efficient and intelligent output design improves the system’s relationship to help user decision-making.
• Create document, report, or other formats that contain information produced by the system. The output form of an information system should accomplish one or more of the following objectives.
Convey information about past activities, current status or projections of the Future. Signal important events, opportunities, problems, or warnings.
Trigger an action. Confirm an action.
SYSTEM ANALYSIS
EXISTING SYSTEM
Testing liveness of a network is a fundamental problem for ISPs and large data center operators. Sending probes between every pair of edge ports is neither exhaustive nor scalable. It suffices to find a minimal set of end-to-end packets that traverse each link. However, doing this requires a way of abstracting across device specific configuration files, generating headers and the links they reach, and finally determining a minimum set of test packets (Min-Set-Cover).
DISADVANTAGES OF EXISTING SYSTEM
Not designed to identify liveness failures, bugs router hardware or software, or performance problems.
The two most common causes of network failure are hardware failures and software bugs, and that problems manifest themselves both as reachability failures and throughput/latency degradation.
PROPOSED SYSTEM
Automatic Test Packet Generation (ATPG) is a framework that automatically generates a minimal set of packets to test the liveness of the underlying topology and the congruence between data plane state and configuration specifications. The tool can also automatically generate packets to test performance assertions such as packet latency.
It can also be specialized to generate a minimal set of packets that merely test every link for network liveness.
ADVANTAGES OF PROPOSED SYSTEM
A survey of network operators revealing common failures and root causes.
A test packet generation algorithm.
A fault localization algorithm to isolate faulty
devices and rules.
ATPG use cases for functional and performance testing.
Evaluation of a prototype ATPG system using rule sets collected from the Stanford and Internet2 backbones.
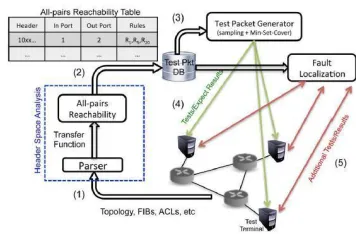
Figure 9: Block Diagram of Proposed System
MODULES:
Test Packet Generation
Generate All-Pairs Reachability Table
ATPG Tool
Fault Localization
MODULES DESCRIPTION
Test Packet Generation:
We assume a set of test terminals in the network can send and receive test packets. Our goal is to generate a set of test packets to exercise every rule in every switch function, so that any fault will be observed by at least one test packet. This is analogous to software test suites that try to test every possible branch in a program. The broader goal can be limited to testing every link or every queue. When generating test packets, ATPG must respect two key constraints First Port (ATPG must only use test terminals that are available) and Header (ATPG must only use headers that each test terminal is permitted to send).
Router
Router
Router N
N
N Parser
All Pairs Reachability
Test Packet
DB
Test Packet Generator
Generate All-Pairs Reachability Table:
ATPG starts by computing the complete set of packet headers that can be sent from each test terminal to every other test terminal. For each such header, ATPG finds the complete set of rules it exercises along the path. To do so, ATPG applies the all-pairs reachability algorithm described. On every terminal port, an all- header (a header that has all wild carded bits) is applied to the transfer function of the first switch connected to each test terminal. Header constraints are applied here.
ATPG Tool:
ATPG generates the minimal number of test packets so that every forwarding rule in the network is exercised and covered by at least one test packet. When an error is detected, ATPG uses a fault localization algorithm to determine the failing rules or links.
Fault Localization:
ATPG periodically sends a set of test packets. If test packets fail, ATPG pinpoints the fault(s) that caused the problem. A rule fails if its observed behavior differs from its expected behavior. ATPG keeps track of where rules fail using a result function ―Success‖ and ―failure‖ depend on the nature of the rule: A forwarding rule fails if a test packet is not delivered to the intended output port, whereas a drop rule behaves correctly when packets are dropped. Similarly, a link failure is a failure of a forwarding rule in the topology function. On the other hand, if an output link is congested, failure is captured by the latency of a test packet going above a threshold.
SYSTEM TESTING
The purpose of testing is to discover errors. Testing is the process of trying to discover every conceivable fault or weakness in a work product. It provides a way to check the functionality of components, sub-assemblies, assemblies and/or a finished product It is the process of exercising software with the intent of ensuring that the
Software system meets its requirements and user expectations and does not fail in an unacceptable manner. There are various types of test. Each test type addresses a specific testing requirement.
TYPES OF TESTS
Unit testing
Unit testing involves the design of test cases that validate that the internal program logic is functioning properly, and that program inputs produce valid outputs. All decision branches and internal code flow should be validated. It is the testing of individual software units of the application .it is done after the completion of an individual unit before integration. This is a structural testing, that relies on knowledge of its construction and is invasive. Unit tests perform basic tests at component level and test a specific business process, application, and/or system configuration. Unit tests ensure that each unique path of a business process performs accurately to the documented specifications and contains clearly defined inputs and expected results.
Integration testing
Integration tests are designed to test integrated software components to determine if they actually run as one program. Testing is event driven and is more concerned with the basic outcome of screens or fields. Integration tests demonstrate that although the components were individually satisfaction, as shown by successfully unit testing, the combination of components is correct and consistent. Integration testing is specifically aimed at exposing the problems that arise from the combination of components.
Functional test
Functional tests provide systematic demonstrations that functions tested are available as specified by the business and technical requirements, system documentation, and user manuals.
Functional testing is centered on the following items: Valid Input : identified classes of valid input must be accepted.
Invalid Input : identified classes of invalid input must be rejected.
Functions : identified functions must be exercised.
Output : identified classes of application outputs must be exercised.
Systems/Procedures : interfacing systems or procedures must be invoked.
additional tests are identified and the effective value of current tests is determined.
System Test
System testing ensures that the entire integrated software system meets requirements. It tests a configuration to ensure known and predictable results. An example of system testing is the configuration oriented system integration test. System testing is based on process descriptions and flows, emphasizing pre-driven process links and integration points.
White Box Testing
White Box Testing is a testing in which in which the software tester has knowledge of the inner workings, structure and language of the software, or at least its purpose. It is purpose. It is used to test areas that cannot be reached from a black box level.
Black Box Testing
Black Box Testing is testing the software without any knowledge of the inner workings, structure or language of the module being tested. Black box tests, as most other kinds of tests, must be written from a definitive source document, such as specification or requirements document, such as specification or requirements document. It is a testing in which the software under test is treated, as a black box you cannot ―see‖ into it. The test provides inputs and responds to outputs without considering how the software works.
Unit Testing
Unit testing is usually conducted as part of a combined code and unit test phase of the software lifecycle, although it is not uncommon for coding and unit testing to be conducted as two distinct phases.
Test strategy and approach
Field testing will be performed manually and functional tests will be written in detail.
Test objectives
All field entries must work properly.
Pages must be activated from the identified link. The entry screen, messages and responses must not be delayed.
Features to be tested
Verify that the entries are of the correct format No duplicate entries should be allowed
All links should take the user to the correct page.
Integration Testing
Software integration testing is the incremental integration testing of two or more integrated software components on a single platform to produce failures caused by interface defects.
The task of the integration test is to check that components or software applications, e.g. components in a software system or – one step up – software applications at the company level – interact without error.
Test Results:
All the test cases mentioned above passedsuccessfully. No defects encountered.
Acceptance Testing
User Acceptance Testing is a critical phase of any project and requires significant participation by the end user. It also ensures that the system meets the functional requirements.
Test Results:
All the test cases mentioned above passedsuccessfully. No defects encountered.
IMPLEMENTATION
MODULES
Test Packet Generation
Generate All-Pairs Reachability Table ATPG Tool
Fault Localization
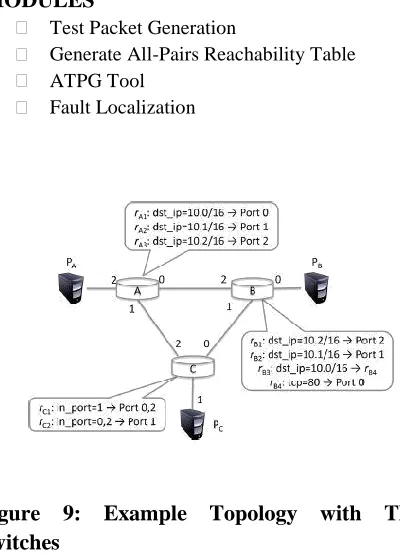
Figure 9: Example Topology with Three
Switches
MODULES DESCRIPTION
Test Packet Generation:
a set of test packets to exercise every rule in every switch function, so that any fault will be observed by at least one test packet. This is analogous to software test suites that try to test every possible branch in a program. The broader goal can be limited to testing every link or every queue. When generating test packets, ATPG must respect two key constraints First Port (ATPG must only use test terminals that are available) and Header (ATPG must only use headers that each test terminal is permitted to send).
1) Algorithm:
We assume a set of test terminals in thenetwork can send and receivetest packets. Our goal is to generate a set of test packets to exercise every rule in every switch function, so that any fault will be observed by at least one test packet. This is analogous to software test suites that try to test every possible branch in a program. The broader goal can be limited to testing every link or every queue.
When generating test packets, ATPG must respect two key constraints: 1) Port: ATPG must only use test terminals that are available; 2) Header: ATPG must only use headers that each test terminal is permitted to send. For example, the network administrator may only allow using a specific set of VLANs. Formally, we have the following problem.
2) Properties:
The TPS algorithm has the followinguseful properties.
Property 1 (Coverage):
The set of test packetsexercise all reachable rules and respect all port and header constraints.
Proof Sketch:
Define a rule to be reachable if it can beexercised by at least one packet satisfying the header constraint, and can be received by at least one test terminal. A reachable rule must be in the all-pairs reachability table; thus, set cover will pick at least one packet that exercises this rule. Some rules are not reachable: For example, an IP prefix may be made unreachable by a set of more specific prefixes either deliberately (to provide backup) or accidentally (due to misconfiguration).
Property 2 (Near-Optimality): The set of test packets
selected by TPS is optimal within logarithmic factors among all tests giving complete coverage.
Proof Sketch: This follows from the logarithmic (in the
size of the set) approximation factor inherent in Greedy Set Cover.
Property 3 (Polynomial Runtime):
The complexityof finding test packets isO(TD ) where T the number of test terminals is, D is the network diameter, and R is the average number of rules in each switch.
Proof Sketch:
The complexity of computingreachability from one input port is O(D ) [16], and this computation is repeated for each test terminal.
Generate All-Pairs Reachability Table:
ATPG starts by computing the complete set of packet headers that can be sent from each test terminal to every other test terminal. For each such header, ATPG finds the complete set of rules it exercises along the path. To do so, ATPG applies the all-pairs reachability algorithm described. On every terminal port, an all- header (a header that has all wild carded bits) is applied to the transfer function of the first switch connected to each test terminal. Header constraints are applied here.
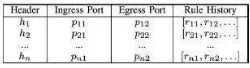
ATPG starts by computing the complete set of packet headers that can be sent from each test terminal to every other test terminal. For each such header, ATPG finds the complete set of rules it exercises along the path. To do so, ATPG applies the all-pairs reachability algorithm described in [16]: On every terminal port, an all- header (a header that has all wild carded bits) is applied to the transfer function of the first switch connected to each test terminal. Header constraints are applied here. For example, if traffic can only be sent on VLAN, then instead of starting with an all-header, the VLAN tag bits are set to . As each packet pk traverses the network using the network function, the set of rules that match pk are recorded in pk.history. Doing this for all pairs of terminal ports generates an all-pairs reachability table as shown in Table I For each row, the header column is a wildcard expression representing the equivalent class of packets that can reach an egress terminal from an ingress test terminal.
Table 1: All-pairs reachability table
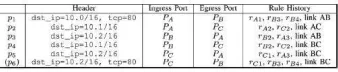
pass through switch A. A forwards packets with dst_ip = 10.0/16 to B and those with dst_ip = 10.1/16 to C. B th en forwards dst_ip = 10.0/16, tcp = 80 to , and switch C forwards dst_ip = 10.1/16 to . These are reflected in the first two rows of Table 2.
Table 2: Corresponding all-pairs
reachability table
ATPG Tool
ATPG generates the minimal number of test packets so that every forwarding rule in the network is exercised and covered by at least one test packet. When an error is detected, ATPG uses a fault localization algorithm to determine the failing rules or links.
Fault Localization
ATPG periodically sends a set of test packets. If test packets fail, ATPG pinpoints the fault(s) that caused the problem. A rule fails if its observed behavior differs from its expected behavior. ATPG keeps track of where rules fail using a result function ―Success‖ and ―failure‖ depend on the nature of the rule: A forwarding rule fails if a test packet is not delivered to the intended output port, whereas a drop rule behaves correctly when packets are dropped. Similarly, a link failure is a failure of a forwarding rule in the topology function. On the other hand, if an output link is congested, failure is captured by the latency of a test packet going above a threshold.
We divide faults into two categories: action faults and match faults. An action fault occurs when every packet matching the rule is processed incorrectly. Examples of action faults include unexpected packet loss, a missing rule, congestion, and mis-wiring. On the other hand, match faults are harder to detect because they only affect some packets matching the rule: for example, when a rule matches a header it should not, or when a rule misses a header it should match. Match faults can only be detected by more exhaustive sampling such that at least one test packet exercises each faulty region. For example, if a TCAM bit is supposed to be, but is ―stuck at 1,‖ then all packets with a 0 in the corresponding position will not match correctly. Detecting this error
requires at least two packets to exercise the rule: one with a 1 in this position, and the other with a 0.
We will only consider action faults because they cover most likely failure conditions and can be detected using only one test packet per rule. We leave match faults for future work.
We can typically only observe a packet at the edge of the network after it has been processed by every matching rule. Therefore, we define an end-to-end version of the result function
DISCUSSION
Overhead and Performance
The principal sources of overhead for ATPG are polling the network periodically for forwarding state and performing all pairs reachability. While one can reduce overhead by running the offline ATPG calculation less frequently, this runs the risk of using out-of-date forwarding information. Instead, we reduce overhead in two ways. First, we have recently sped up the all-pairs reachability calculation using a fast multithreaded/multi-machine header space library. Second, instead of extracting the complete network state every time ATPG is triggered, an incremental state updater can significantly reduce both the retrieval time and the time to calculate reachability. We are working on a real-time version of ATPG that incorporates both techniques. Test agents within terminals incur negligible overhead because they merely de-multiplex test packets addressed to their IP address at a modest rate (e.g., 1 per millisecond) compared to the link speeds Gb/s most modern CPUs are capable of receiving.
Limitations
As with all testing methodologies, ATPG has limitations.
1)
Dynamic boxes:
ATPG cannot model boxeswhose internal state can be changed by test packets. For example, an NAT that dynamically assigns TCP ports to outgoing packets can confuse the online monitor as the same test packet can give different results.
2)
Nondeterministic boxes:
Boxes canmodel such rules. However, if there are known packet patterns that can iterate through all possible outputs, ATPG can generate packets to traverse every output.
3) Invisible rules: A failed rule can make a
backup rule active, and as a result,no changes may be observed by the test packets. This can happen when, despite a failure, a test packet is routed to the expected destination by other rules. In addition, an error in a backup rule cannot be detected in normal operation. Another example is when two drop rules appear in a row: The failure of one rule is undetectable since the effect will be masked by the other rule.
4)
Transient network states:
ATPG cannotuncover errors whose lifetime is shorter than the time between each round of tests. For example, congestion may disappear before an available bandwidth probing test concludes. Finer-grained test agents are needed to capture abnormalities of short duration.
5)
Sampling:
ATPG uses sampling when generatingtest packets. As a result, ATPG can miss match faults since the error is not uniform across all matching headers. In the worst case (when only one header is in error), exhaustive testing is needed.
RESULTS & CONCLUSION
Testing liveness of a network is a fundamental problem for ISPs and large data center operators. Sending probes between every pair of edge ports is neither exhaustive nor scalable [30]. It suffices to find a minimal set of end-to-end packets that traverse each link. However, doing this requires a way of abstracting across device specific configuration files (e.g., header space), generating headers and the links they reach (e.g., all-pairs reachability), and finally determining a minimum set of test packets (Min-Set-Cover). Even the fundamental problem of automatically generating test packets for efficient liveness testing requires techniques akin to ATPG.
ATPG, however, goes much further than liveness testing with the same framework. ATPG can test for reachability policy (by testing all rules including drop rules) and performance health (by associating performance measures such as latency and loss with test packets). Our implementation also augments testing with
a simple fault localization scheme also constructed using the header space framework. As in software testing, the formal model helps maximize test coverage while minimizing test packets. Our results show that all forwarding rules in Stanford backbone or Internet2 can be exercised by a surprisingly small number of test packets ( for Stanford, and for Internet2).
Network managers today use primitive tools such as and. Our survey results indicate that they are eager for more sophisticated tools. Other fields of engineering indicate that these desires are not unreasonable: For example, both the ASIC and software design industries are buttressed by billion-dollar tool businesses that supply techniques for both static (e.g., design rule) and dynamic (e.g., timing) verification. In fact, many months after we built and named our system, we discovered to our surprise that ATPG was a well-known acronym in hardware chip testing, where it stands for Automatic Test Pattern Generation [2]. We hope network ATPG will be equally useful for automated dynamic testing of production networks.
REFERENCES
[1] ―ATPG code repository,‖ [Online]. Available: http://eastzone.github.com/atpg/
[2] ―Automatic Test Pattern Generation,‖ 2013 [Online]. Available:
http://en.wikipedia.org/wiki/Automatic_test_pattern_gen eration
[3] P. Barford, N. Duffield, A. Ron, and J. Sommers, ―Network performance anomaly detection and localization,‖ in Proc. IEEE INFOCOM, Apr. , pp. 1377– 1385.
[4] ―Beacon,‖ [Online]. Available: http://www.beaconcontroller.net/
[5] Y. Bejerano and R. Rastogi, ―Robust monitoring of link delays and faults in IP networks,‖ IEEE/ACM Trans. Netw., vol. 14, no. 5, pp. 1092–1103, Oct. 2006.
Proc. OSDI, Berkeley, CA, USA, 2008, pp. 209– 224.
[7] M. Canini,D.Venzano, P. Peresini,D.Kostic, and J. Rexford, ―A NICE way to test OpenFlow applications,‖ in Proc. NSDI, 2012, pp. 10–10.
[8] A. Dhamdhere, R. Teixeira, C. Dovrolis, and C. Diot, ―Netdiagnoser:
Troubleshooting network unreachabilities using end-to-end probes and routing data,‖ in Proc. ACM CoNEXT, 2007, pp. 18:1–18:12.
[9] N. Duffield, ―Network tomography of binary network performance characteristics,‖ IEEE Trans. Inf. Theory, vol. 52, no. 12, pp. 5373–5388, Dec. 2006.
[10] N. Duffield, F. L. Presti, V. Paxson, and D. Towsley, ―Inferring link loss using striped unicast probes,‖ in Proc. IEEE INFOCOM, 2001, vol. 2, pp. 915– 923.
[11] N. G. Duffield and M. Grossglauser, ―Trajectory sampling for direct traffic observation,‖ IEEE/ACM Trans. Netw., vol. 9, no. 3, pp. 280–292, Jun. 2001.
[12] P. Gill, N. Jain, and N. Nagappan, ―Understanding network failures in data centers: Measurement, analysis, and implications,‖ in Proc. ACM SIGCOMM, 2011, pp. 350–361.
[13] ―Hassel, the Header Space Library,‖ [Online]. Available:
https://bitbucket.org/peymank/hassel-public/
[14] Internet2, Ann Arbor, MI, USA, ―The Internet2 observatory data collections,‖
[Online]. Available: http://www.internet2.edu/observatory/archive/data- collections.html