Analysis of Reinforced Concrete Building under Blast
Loading Using SAP 2000
S. Md. Abu Sofian& M.Mujahid Ahmed
1P.G. Scholar, 2Assistant Professor
1,2 Dept. of CIVIL ENGINEERING,
1,2 Geethanjali College Of Engineering And Technology, Nannur.
Email:-1[email protected] , 2[email protected]
Abstract:
Now-a-days terrorist attacks are expanding quickly everywhere throughout the world. They were assaulting the place like open spots, gather buildings, essential structure and so forth. So subsequently their future huge property loss, disappointment of close by structures and some human loss likewise will emerge if the assault is extreme one. The majority of the human loss is happening because of crumple of structures. So on the off chance that we figure out how to plan the structures to oppose the blasting or a blast we can ready to lessen the harm and just as the human loss moreover. So to plan the structure to oppose the blasting, first we should know how the structure or building is acting under the state of blasting or under the impact loading. To decide the conduct of structure we should know the loading parameters on the structure to break down.
So the primary objective of this
investigation is to decide the shoot loading on the structure and to decide the conduct of RC structure under that loading. With the goal that we can know, how the structure will carry on or can perform under blasting. In this project work, the execution or conduct of a hundred feet structure under the impact loading is resolved. Two blast loads were considered to decide the conduct of 100 feet structure. The loads are of 5000lbs. These blast loads were detonated in various three standoff separations, said to be as 50, 100, and 150 feet's. At every standoff separate the conduct of structure is resolved under two touchy loads. The impact parameters were resolved according
to the Army Corps of Engineers,
Department of Defense, U.S. Air Force and Indian Code IS:4991-1968. The loading on the structure is dynamic in nature so the came about impact parameters which are resolved is given as the contribution for the structure in Time-History examination of SAP 2000. So thus we can decide the removals, increasing speed and speeds regarding comparing times, which are said to be as the execution of the structure.
Keywords : Terrorist, Response of building, Blast Loading, Blast scaling
Introduction
Engineers, Department of Defense, U.S. Air Force and other administrative office and open organizations. A significant part of the work is finished by the Massachusetts Institute of Technology (MIT), the University of Illinois, and other driving instructive establishments and designing firms.
Fiascos, for example, the terrorist bombings of the U.S. international safe havens in Nairobi, Kenya and Dar es Salaam, Tanzania in 1998, the Khobar Towers military sleeping quarters in Dhahran, Saudi Arabia in 1996, the Murrah Federal Building in Oklahoma City in 1995, and the World Trade Center in New York in 1993 have shown the requirement for an intensive examination of the conduct of structures exposed to impact loads. To give satisfactory security against blasts, the design and development of open buildings are accepting reestablished consideration of auxiliary architects in light of the fact that the impact of impact is exceptionally intricate to get it. The point in impact obstruction structure is to maintain a strategic distance from dynamic collapse. Since the serious issue while blast is dynamic is the collapse of structure. So on the off chance that we can't stop the dynamic collapse of building however can lessen the harm of blast: either human loss or a property loss.
The significant risk after a blast is the dynamic collapse. Furthermore, today the focal point of every one of the an architects and designers are to capture the dynamic collapse of building. A definitive objective is that, the structure ought to be shielded from the impact, which is probably going to be the Target of terrorist attacks for the most part. The dynamic reaction of the structure to impact loading is mind boggling to break down, on account of the non-direct conduct of the materials just as the
geometry. Consequently, examinations and design of impact loading requires nitty gritty information of impact and its wonders.
Strong explosives are primarily high explosives for which impact are best known. Materials, for example, mercury blasts and lead azide are essential explosives. Auxiliary explosives are those make impact wave which can result in across the board harm to the environment. Precedents incorporate trinitrotoluene (TNT) and ANFO (ammonium nitrate fuel oil). Two blast loads were considered to decide the conduct of 100 feet structure. The loads are of 5000lbs. These blast loads were detonated in various three standoff separations, said to be as 50, 100, and 150 feet's. At every standoff remove the conduct of structure is resolved under two unstable loads. The impact parameters were resolved according to the Army Corps of Engineers, Department of Defense, U.S. Air Force[1].The loading on the structure is dynamic in nature so the came about impact parameters which are resolved is given as the contribution for the structure in Time-History investigation of SAP 2000.
Blast Loading Concept Explosion
An explosion is characterized as, quick and sudden arrival of vitality. Hazardous materials can be grouped by their physical state as solids, fluids or gases. Strong explosives are chiefly high explosives for which impact are best known. Secondary explosives are those make impact wave which can result in boundless harm to the
environment. Models incorporate
trinitrotoluene and ammonium nitrate fuel oil.
What exactly happens during blasting
hot gas extends driving out the volume, it involves. As a result, a layer of compacted air(blast wave) shapes before this gas volume the majority of the vitality discharged by the explosion. Impact wave quickly increments to an estimation of weight all the more then the surrounding weight. This is alluded to as the side-on overpressure that rots as the stun wave grows outwards from the explosion source.
A little while later the weight falls beneath the surrounding weight as appeared in Fig-3.2. This stage is only the negative stage. The zone which is having a pinnacle overpressure more than the encompassing weight and directly diminished to the surrounding weight is known as the positive stage.
1.Figure: 3.1. Blast wave propagation
2. Figure: 3.2. Blast wave pressure-time history.
Positive duration is much lesser than the negative duration. The overpressure (pso) in
the positive duration is much greater than the pressure in the negative pressure (pso-). Determination of blast loading
Parameters
Blast loading can be determined by some empirical expressions and by some other codes or by some provisions. So in general the blast load is calculated by
Empirical expressions determined by some number of experiments.
As per Indian code IS 4991-1968.
Provisions as per unified facilities criteria (UFC 3-340-02, 5 December 2008.).
Indian code had mentioned only the effect of the positive duration and positive over pressures. The effect of the negative duration and the negative over pressure is not considered. To determine the exact and near to exact analysis of the building, the effect of negative over pressure should also consider.
By Empirical Expressions
Use of the TNT (Trinitrotoluene) as a reference for determining the scaled distance Z, is universal. The first step in quantifying the explosive wave from a source other than the TNT, is to convert the charge mass into an equivalent mass of the TNT. It is performed so that the charge mass of explosive is multiplied by the conversion factor based on the specific energy of the charge and their TNT. Specific energy of different explosive types and their conversion factors of that of the TNT are given in the next table.
Table: 3.1.Conversion factors for different type of explosives.
EXPLOSIVE
Specific Energy
TNT Equivalent Qx/ KJ/Kg Qx/QTNT Compound B (60%
RDX and 40% TNT)
5190 1148
RDX (Ciklonit) 5360 1185
HMX 5680 1256
Nitro-glycerine (liquid)
6700 1481
TNT 4520 1000
Explosive gelatine (91 % nitro-glycerine, 7,9% nitrocellulose, 0,9 % antracid, 0,2 % water)
4520 1000
dynamite
Semtex 5660 1250
Explosion wave front speed U = ao
Where ao = speed of sound in m/sec
Alternative expression U = 345(1+0.0083Pso2) in m/sec
Dynamic (blast wave) pressure qo
=
It can be written also as qo = 0.0032Pso2 in
kpa
Where Pso = peak over pressure
Po = ambient pressure
There are various proposals for calculation of the main explosion parameters.
New marks and Hansen’s [9] proposed the use of following values
Pso = 6874 +93
Mills[10] proposed the following Pso= + + -0.019 kpa
Brode[11] gives the following expressions for to determine the peak over pressures, Ps= +1 ...bars Ps>10 bars
Ps = , 0.1<Ps<10
bars
Where scaled distance Z =
R = distance from the centre of the spherical charge
W = charge mass expressed in kilogram of TNT
Other important parameters include,
to = duration of the positive phase during which the a pressure is greater than the
Pressure of the surrounding air
is = the specific wave impulse that is equal to the area under the pressure-time
Curve from the moment of arrival, tA, to the end of the positive phase
and is given by expression
is=
is=
Figure: 3.4. Pressure-Time profile of Explosion Wave
Where is the maximum value of negative pressure.
Brode [11] proposed the following expression for negative pressure
: bars Z>1.6.
And the corresponding negative impulse specific force is given by
CALCULATION OF BLAST PARAMETERS ANALYTICAL SOLUTION
We assumed that, the blast wave is considered as plane. The blast parameters are determined as follows;
DESCRIPTION OF DATA FOR TRIAL-I Size of building 60fts X 60fts.
Distance of building from the origin of explosion, R= 150 ft
Height of the building H= 100ft
Explosive weight W= 2500 lbs
Scaled distance Z= = 11.05
ft/
DETERMINATION OF BLAST
PARAMETERS
- peak positive incident pressure Pso
- time of arrival of blast wave tA
- wave length of positive pressure phase LW
- duration of positive phase of blast pressure to.
From fig-2-15[1] for Z= 11.05 ft/ ;
Pso = 7.93 psi = 5.154 ms/lb1/3
= 2.53
= 2.75 ms/lb1/3
Specific impulsive force is =
7.41x25001/3 = 100.57 psi ms
FRONT WALL PEAK POSITIVE REFLECTED PRESSURE
From fig-2-193[1] ;
Pso = 7.93 psi and α = 0o, Cra = 2.38.
Therefore reflected peak pressure is given by, Pra = Cra *Pso = 2.38*7.93 = 18.87.
Unit positive reflected impulse from fig-2-194[1] ;
= 12.81, ira = 174.05 psi.
FRONT WALL LOADING POSITIVE PHASE
Calculation of sound velocity in reflected over pressure region,
Cr from 2-192[1]; Pso =7.93 psi Cr = 1.25
ft/ms
Clearing time for reflected pressure tc;
tc= = = 71.00 ms.
Where S= 30ft (60/2 =30);
G= 100/2 =50> 30, so G= 50 R = S/G = 30/50 =0.6
Calculation of fictitious positive phase duration,
tof = 2is/Pso = (2x100.57)/7.93 = 25.36 ms.
From fig- 2-3[1]; peak dynamic pressure is given by,
Pso = 7.93 psi then qo =1.43 psi.
Drag coefficient based on from suction, CD =1.0 then Pso+CDqo = 7.93+ 1*1.43 =
9.36 psi.
Calculation of factitious duration of the reflected pressure acc to equation
tr = = = 18.44 ms
pressure time curve is plotted in fig.
FRONT WALL LOADING NEGATIVE PHASE
Peak positive reflected pressure Pra =18.87
psi, then from fig 2-15[1] Z(Pra) =11.20;
Peak Negative pressure is Pa- = 1.60 psi for
Z = 11.20
Fictitious negative phase duration, trf- =
0.0139 *W1/3 = 144.56 ms
Negative specific impulsive force is given by, = 18.80, ira- = 246.34 psi ms
Therefore negative phase rise = 0.27 trf- =
0.27*144.56 = 39.03 ms
The negative phase time parameter to+0.27
trf- = 37.32+39.03 = 76.35 ms
Total negative phase duration, to+ trf- =
37.32+144.56 = 181.88 ms.
SIDE WALL LOADING POSITIVE PHASE
Calculation of loading on the rear half of the side wall L =30 ft
Wavelength to span ratio = Lw/L = 38/30
=1.27
Based on fig- 2-196, 2-197 and 2-198 [1] for point on B Lw/L = 1.27,
Psof = 5.74 psi, CE =0.53, CE-=0.26,
= 1.78, = 4.2, and =
11.52.
Where CE = equivalent load factor, td = rise
time, tr = fictitious reflected pressure
duration,tof = fictitious positive pressure
phase duration
Therefore peak positive pressure Pso =
CE*Psof =0.53*5.74 = 3.04 psi
tr =1.78*25001/3 = 24.15 ms
tof= 5.2 * 25001/3 = 27.00 ms.
Peak dynamic pressure from fig-2-3[1] CE Psof= 3.04 then qo = 0.23 psi.
Calculation of peak positive pressure from equation CE Psof + CD qo =3.04-0.4*0.23=
2.95 psi
SIDE WALL NEGATIVE PRESSURE PHASE
Peak negative reflected pressure (Pr-) = CE
-Psof-= 0.26*5.74 =1.50 psi
Negative phase duration tof- = 11.52*25001/3
=156.35 ms
Negative phase rise time 0.27*t-of = 42.21
ms
The negative phase time parameter to
=40.22 ms
Peak rise time to +0.27 * tof- = 40.25+42.21
= 82.46 ms
Total negative duration to + tof- =
40.25+156.35 =196.60 ms
ROOF LOADING – POSITIVE PHASE
Calculation of roof loading, L= 60fts Psof =4.44 psi
Based on fig 2-196, 2-197, 2-198[1];
CE = 0.35, CE- =0.22
= 2.49,
= 6.93; = 12.43
Hence peak positive pressure is CEPsof =
0.35*4.44 =1.56 psi
Rise time tr =2.49*25001/3 = 33.79 ms and
tof = 84.05 ms
Peak dynamic pressure from fig-2-3[1]; For CEPsof =1.56 psi then qo =0.13 psi
Calculation of peak positive reflected pressure CEPsof+CDqo= 1.56-0.4*0.12= 1.51
psi
ROOF LOADING –NEGATIVE PRESSURE
Peak negative reflected pressure Pr- = CE
-Psof- =0.22*4.44= 0.98 psi.
Total Time of peak negative pressure tof-=
12.43*25001/3 = 168.70 ms
Negative pressure rise time 0.27*t-of =
0.27*168.70= 45.55 ms.
The negative pressure time parameter, to=42.48ms
There fore peak rise is to+ 0.27*tof-=
42.48+45.55 = 88.03 ms.
Total duration is to + tof- = 42.48+168.70=
211.18 ms.
The negative pressure-time curve is plotted in figure.
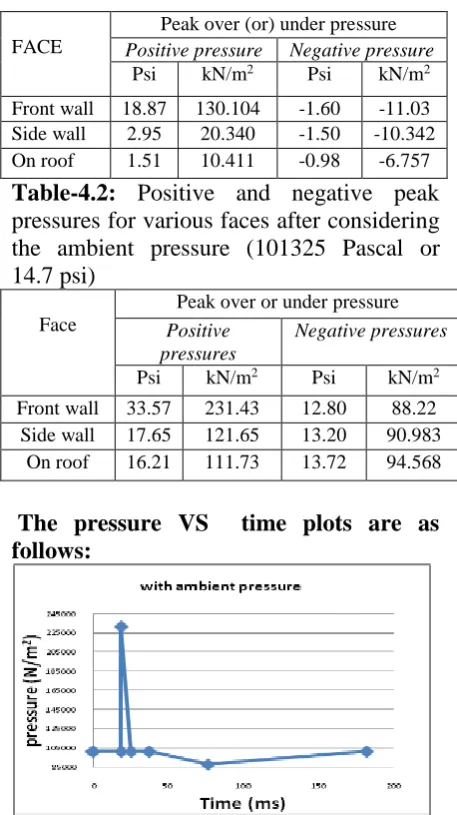
Table-4.1: Positive and negative peak over and under pressure for various faces without considering atmosphere pressure.
FACE
Peak over (or) under pressure Positive pressure Negative pressure
Psi kN/m2 Psi kN/m2 Front wall 18.87 130.104 -1.60 -11.03 Side wall 2.95 20.340 -1.50 -10.342 On roof 1.51 10.411 -0.98 -6.757
Table-4.2: Positive and negative peak pressures for various faces after considering the ambient pressure (101325 Pascal or 14.7 psi)
Face
Peak over or under pressure Positive
pressures
Negative pressures
Psi kN/m2 Psi kN/m2 Front wall 33.57 231.43 12.80 88.22 Side wall 17.65 121.65 13.20 90.983
On roof 16.21 111.73 13.72 94.568
The pressure VS time plots are as follows:
Figure 4.1.b.: Pressure-time plot on side wall with and without considering ambient pressure.
Figure 4.1.C. pressure-time plot on roof with and without ambient pressure.
DESCRIPTION OF DATA FOR TRIAL-2
Size of building 60fts X 60fts.
Distance of building from the origin of explosion R= 150 ft
Height of the building H= 100ft
Explosion weight W= 5000 lbs
Scaled distance Z= = 8.77 ft/
For 5000lbs explosion weight, the positive and negative pressures are calculated as.
Table 4.3: Positive and negative peak over and under pressure for various faces without considering atmosphere pressure.
FACE
Peak over (or) under pressure Positive pressure Negative pressure
Psi kN/m2 Psi kN/m2 Front wall 32.40 223390.
22
-2.6 -17927
Side wall 4.19 28890 -2.28 -15720 On roof 2.00 13789 -1.51 -10411
Table-4.4: Positive and negative peak pressures for various faces after considering the ambient pressure (101325 Pascal or 14.7 psi)
Face
Peak over or under pressure Positive pressures Negative pressures
Psi kN/m2 Psi kN/m2 Front wall 47.10 324715 12.10 83398 Side wall 18.90 130215 12.42 85605 On roof 16.70 115114 13.20 90914
The pressure and time plots are as follows:
front wall without and with considering ambient pressure.
Figure 4.2.b: Pressure-time plot on side wall with and without considering ambient pressure.
Figure 4.2.c.pressure-time plot on roof with and without ambient pressure
DESCRIPTION OF DATA FOR TRIAL-3
Size of building 60fts X 60fts.
Distance of building from the origin of explosion R= 100 ft
Height of the building H= 100ft
Explosion weight W= 2500 lbs
Scaled distance Z= = 7.37 ft/
Table-4.5: Positive and negative peak over and under pressure for various faces without considering atmosphere pressure.
FACE
Peak over (or) under pressure Positive pressure Negative pressure
Psi kN/m2 Psi kN/m2
Front wall 51.60 355.77 -3.6 -24.82 Side wall 6.98 48.12 -1.70 -11.7 On roof 5.10 35.16 -1.2 -8.27
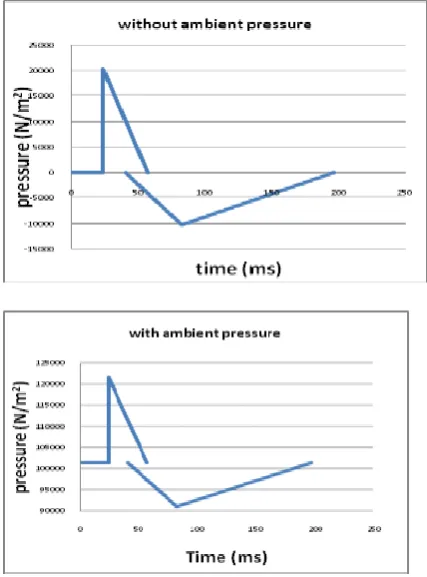
Table-4.6: Positive and negative peak pressures for various faces after considering the ambient pressure (101.325 kilo Pascal or 14.7 psi)
FACE
Peak over (or) under pressure Positive pressure Negative pressure
Psi kN/m2 Psi kN/m2 Front wall 66.30 457.095 11.10 76.50 Side wall 21.08 148.445 13.00 89.60 On roof 19.20 136.48 13.5 93.05
Pressure and time plots
Figure 4.3: Variation of blast pressure on side face without ATM pressure.
Figure 4.3: Variation of blast pressure on Roof without considering ATM pressure. DESCRIPTION OF DATA FOR TRAIL-4
Size of building 60fts X 60fts.
Distance of building from the origin of explosion R= 100 ft
Height of the building H= 100ft
Explosion weight W= 5000 lbs
Scaled distance Z= = 5.85 ft/
Table- 4.7 positive and negative peak over and under pressure for various faces without considering atmosphere pressure.
Face
Peak over or under pressure
Positive pressures Negative pressures
Psi kN/m2 Psi kN/m2
Front wall 87.73 604.8 -4.60 -31.71
Side wall 18.30 126.1 -3.20 -22.03
On roof 10.18 70.19 -2.34 -16.14
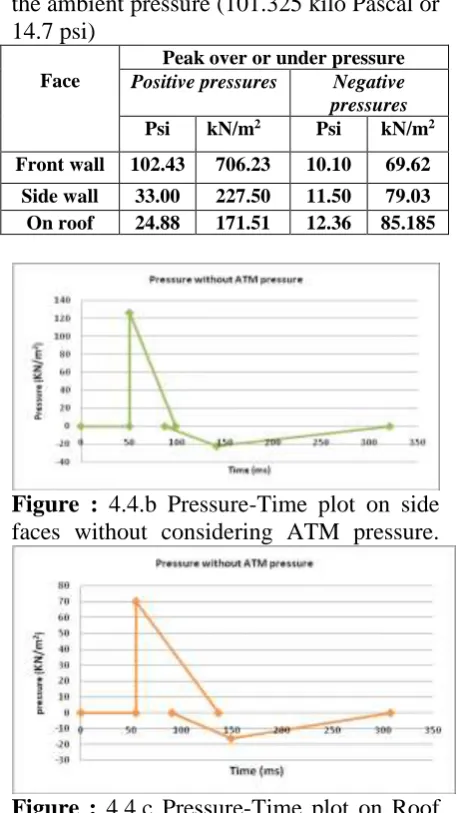
Table-4.8: Positive and negative peak pressures for various faces after considering
the ambient pressure (101.325 kilo Pascal or 14.7 psi)
Face
Peak over or under pressure
Positive pressures Negative pressures
Psi kN/m2 Psi kN/m2
Front wall 102.43 706.23 10.10 69.62
Side wall 33.00 227.50 11.50 79.03
On roof 24.88 171.51 12.36 85.185
Figure : 4.4.b Pressure-Time plot on side faces without considering ATM pressure.
Figure : 4.4.c Pressure-Time plot on Roof without considering ATM pressure.
DESCRIPTION OF DATA FOR TRIAL-5
Size of building 60fts X 60fts.
Distance of building from the origin of explosion R= 50 ft
Height of the building H= 100ft
Explosion weight W= 2500 lbs
Scaled distance Z= = 5.85
ft/
Table 4.9: Positive and negative peak over and under pressure for various faces without considering atmosphere pressure.
Face
Peak over or under pressure
Positive pressures Negative pressures
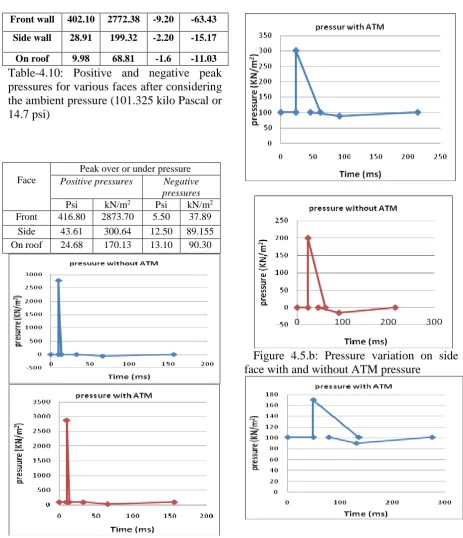
Front wall 402.10 2772.38 -9.20 -63.43
Side wall 28.91 199.32 -2.20 -15.17
On roof 9.98 68.81 -1.6 -11.03
Table-4.10: Positive and negative peak pressures for various faces after considering the ambient pressure (101.325 kilo Pascal or 14.7 psi)
Face
Peak over or under pressure Positive pressures Negative
pressures
Psi kN/m2 Psi kN/m2
Front wall
416.80 2873.70 5.50 37.89 Side
wall
43.61 300.64 12.50 89.155 On roof 24.68 170.13 13.10 90.30
Figure 4.5.a :Pressure variation on front wall with and without ATM pressure
Figure 4.5.b: Pressure variation on side face with and without ATM pressure
Figure 4.5.c: Variation of pressure on roof with and without ATM pressure
1.1.1.4.1.6. DESCRIPTION OF DATA FOR TRAIL-6
Size of building 60fts X 60fts.
Distance of building from the origin of explosion R= 50 ft
Height of the building H= 100 ft
Explosion weight W= 5000 lbs
Scaled distance Z= = 5.85
ft/
Table-4.11: Positive and negative peak over and under pressure for various faces without considering atmosphere pressure.
Face
Peak over or under pressure
Positive pressures Negative pressures
Psi kN/m2 Psi kN/m2
Front wall
840.0 5791.60 -14.20 -97.90
Side wall 65.00 448.16 -2.70 -18.62
On roof 24.68 170.13 -1.54 -10.62
Table- 4.12 positive and negative peak pressures for various faces after considering the ambient pressure (101.325 kilo Pascal or 14.7 psi)
Face
Peak over or under pressure
Positive pressures Negative pressures
Psi kN/m2 Psi kN/m
2
Front wall 854.70 5892.9 0.50 8.425
Side wall 79.70 549.485 12.0 82.70
On roof 39.38 271.45 13.1
6
90.70 5
Figure 4.6.a Pressure-Time plot on Front face without considering ATM pressure.
Figure 4.6.b Pressure-Time plot on Side face without considering ATM pressure.
Figure 4.6.c Pressure-Time plot on Roof without considering ATM pressure.
main points that I have observed is listed below.
As above said the peak positive pressure is much greater than the peak negative pressure on all the faces of the building.
The intensity of the peak reflected pressure are much more than the peak positive pressure. So, the effect of the reflected pressure is more on the front face (side where explosion occurred) of the building or structure.
In case of side face and Roof of the building, the reflected pressure is less then the peak positive pressure. So the effect of the reflected pressure on these face is low when compare with the front face.
Among the peak positive pressure and the reflected pressure, the greater value is considered on the face in Pressure-Time plots.
The negative pressure on the front face started after the end of the positive pressure that to not an immediate occurrence, but started after some milliseconds as shown in pressure-Time plots.
But in case of side faces of the structures, the Negative pressure started before the end of the positive pressure this is clearly observed in the pressure-Time plots.
In case of the Roof, the Negative pressure is started much before departure of the positive pressure the variation as shown in plots.
CALCULATION OF IMPULSE OR BLAST LOADING
SPECIFIC WAVE IMPULSE (is)
The specific wave impulse that is equal to the area under the pressure-time curve from the moment of arrival, tA, to the end of the positive phase and is given by expression
is= .
Figure 5.1 :Typical pressure-Time plot
The specific wave impulse said to be positive whenever the area considered only the positive phase from the Time-pressure plot. It is denoted by the notation (
i
s+). If the area taken from the negative phase, then it known as the negative specific wave of impulse (is-).
This specific wave impulse is used to determine the impulsive force that is acting on the building.
Impulsive force is further divided into positive impulsive force and negative impulsive force.
Impulsive force is calculated as, IF =
is*Ab
Where Ab = blast influence area.
Positive Specific wave impulse is given
by, (is+) = 0.5*18.44*130.10
= 1199.52 KN/m2-ms.
Negative specific wave impulse is given
by (is-) = 0.5*39.03*11.03
= 215.25 KN/m2-ms.
The radius of blast wave on the front face of the structure is given by the condition,
;
Where tr = reflected positive duration =
18.87 ms
tc = clearance time = 71.00 ms
R = Radius of blast wave on the building. S = half the width of the building.= 9.15 m Therefore the Radius is given by, R =
= 2.37 m.
Positive impulsive force If+ =( is+ )*
= 21706.03 kN ms. Similarly negative Impulse force = -3814.35 kN ms.
For different weights of explosion at
different standoff distances, the positive and negative Impulsive forces were calculated as mentioned above and they are given in the below table.
Table 5.1 Impulse force and radius of blast wave for two explosion weights.
E Explo- sion
weight (lbs)
Standoff distance (ft)
Positive impulsive force (kN-ms)
Negative impulsive force (kN-ms)
Radius of blast wave R (m) 2500
50 32057 7552 1.50
100 22241 4084 1.96
150 21706 3814 2.38
5000
50 104585 19689 2.20 100 68604 11390 2.46 150 45161 10208 2.71
Figure 5.2 Variation of positive Impulsive force with respect to standoff distance.
Figure 5.3 Variation of negative Impulsive
force with respect to standoff distance.
Figure 5.5 a. Typical plots for Impulsive
force and Time for 2500 lbs @50 feet
Figure 5.6 Typical plots for Impulsive force and Time for 5000 lbs @ 50, 100, 150
feet’s.
MODELLING IN SAP 2000 ABOUT SAP2000:
The SAP name has been synonymous with state-of-the-art analytical methods since its introduction over 30 years ago. SAP2000 follows in the same tradition featuring a very sophisticated, intuitive and versatile user interface powered by an unmatched analysis engine and design tools for engineers working on transportation, industrial, public works, sports, and other facilities. From its 3D object based graphical modelling environment to the wide variety of analysis and design options completely integrated across one powerful user interface, SAP2000 has proven to be the most integrated, productive and practical general purpose structural program on the market today. Now we can harness the power of SAP2000 for all of your analysis and design tasks, including small day-to-day problems.
Complex Models can be generated and meshed with powerful built in templates. Integrated design code features can automatically generate wind, wave,
bridge, and seismic loads with
energy methods for drift control, velocity-dependent dampers, base isolators, support plasticity and nonlinear segmental construction analysis. Nonlinear analyses can be static and/or time history, with options for FNA nonlinear time history dynamic analysis and direct integration. From a simple small 2D static frame analysis to a large complex 3D nonlinear dynamic analysis, SAP2000 is the easiest, most productive solution for structural analysis and design needs.
GENERAL INTRODUCTION
For performing the linear and Non-linear analysis to the framed structure by manually, is very difficult task and also a time consuming process. So huge manual errors will occur when we done by manually. To eliminate this type of errors and recent few decades implemented some software’s to eliminate the difficulties. If we want to know the performance of any structure, firstly we should have to model the structure. So for modelling I opted for SAP2000. My intention is to determine the behaviour of the structure under blast loading. So to determine that first we should know the behaviour of explosion and shockwave then to model that building and to provide appropriate structural components. In order to accomplish the desire objectives, linear and nonlinear model time history analysis has been conducted on the building frames model in SAP2000 in this study. Concrete frame buildings have been taken where the frames have been used for performance evaluation and model using the background of software SAP2000. Using unified facilities criteria [1], the blast pressure time functions have been estimated and were applied to the building frames. Linear and nonlinear dynamic modal time history analysis is conducted for the modelled building frames. Subsequently analysis results were recorded for performance evaluation.
EVALUATION OF BLAST RESPONSE
Today in this present era, where the world got advanced with the latest technologies software’s that may analyze 2D as well as 3D models with a good accuracy and better simulation with the actual effect of the disastrous loads on the structures. Using the environment of software it is now possible to automobile nonlinear analysis using SAP2000 in this study. Frame works modeled for linear and non linear response were run using the estimated base shear and response spectrum for linear analysis using blast pressure time curves for nonlinear analysis and in this direction the appropriate analysis is carried out.
It seems some odd that the frameworks are modelled previously in linear analysis using response spectrum analysis for considered earthquake ground motion.. As the direction, intensity, blast off distance and type of blast source is erratic. So, in this study a model is taken, which is previously checked for maximum effect of earthquake ground motion as for linear analysis and performance of the structure is the analyzed using nonlinear dynamic model time-history analysis. Details of building frame work are as follows,
Size of the building 60ft X 60ft.
Height of the building 100 feet’s (10 storey building).
Explosion weights 2500lbs and 5000lbs.
Standoff distances are 50, 100, and 150 fts.
RESPONSE SPECTRUM ANALYSIS
pseudo-spectral acceleration, velocity, or displacement as a function of structural period for a given time history and level of
damping. It is practical to envelope response spectra such that a smooth curve represents the peak response for each realization of structural period.
Response-spectrum analysis is useful for design decision-making because it relates structural type-selection to dynamic performance.Structural performance objectives should be taken into account during preliminary design and response-spectrum analysis.
DAMPING AND RSA
RSA provides insight into how damping affects structural response. A family of response curves may be developed with variable levels of damping. As damping increases, response spectra shift downward.
The International Building Code (IBC) is based on 5% damping. This accounts for incidental damping from hysteretic behaviour, which is not explicitly modelled during RSA.
Viscous dampers do not affect structural stiffness, are not modelled during RSA, and are not accounted for in the IBC provision for 5% damping.
ADDITIONAL NOTES ON RSA
All response quantities are positive, therefore RSA is not suitable for torsional irregularity. A static lateral-load procedure is best for measuring accidental torsion. The same applies when considering uplift and compression during foundation design.
Modal response may be combined using SRSS, CQC, ABS, or GMC methods. CQC is best when periods are closely spaced, with cross-correlation between mode shapes. SRSS is suitable when periods differ by more than 10%.
Ritz vectors are recommended for RSA because this formulation is computationally efficient. Only
pertinent mode shapes which occur in the horizontal plane are identified. Eigen vectors use the full stiffness and mass matrices, which also account for vertical modes. Eigen formulation is useful when considering floor vibration, out-of-plane vibration of shear-wall systems, etc. Eigen application is also useful for locating modelling errors.
TIME-HISTORY ANALYSIS
Non-linear analysis is further divided into two types. They are non-linear static analysis or pushover analysis and nonlinear dynamic analysis or Time-History analysis. Pushover analysis is a broad variety of analysis method both elastic and inelastic, are available for the design of future buildings or for checking structures already exits. Since the most customary inelastic analysis procedure insists in the nonlinear time history analysis, which is regarded as impractical and time consuming, but it will give the accurate results.
Time history analyses are based upon the accelerograms that are applied at the base of buildings. The calculations of the structure performance under dynamic action can be considered either assuming elastic or inelastic (dynamic) behaviour. For the nonlinear time history analysis, as suggested by EN1998:1.2004 the mathematical model shall include the strength of structural element as well as their post-elastic behaviour. In case that realistic model is available, the nonlinear time history analysis is definitely more accurate method; structural behaviour including damage progression effect can be realistically traced, which allows an optimized structure design.
a large number of accelerogram should be used. At the same time, these accelerogram should be representative for the respective building site, .g. in terms of soil condition, distance to the source etc. Since these prerequisite is often not fulfilled, it is allowed to use simulated(synthetically generated) accelerogram that are consistent with source and path mechanisms and the underlying soil conditions, accelerogram shall be chosen accordingly to the provision given in E N 1998-1, section 3.2.3.1.
SOME MOST IMPORTANT POINTS IN TIME-HISTORY ANALYSIS
Analysis of a structure, applying data over increment time steps as a function of,
– Acceleration – Force – Moment, or – Displacement
The smaller is time steps, the more accurate the solution will be.
Eigen values generated for the structure based on response to time history. Considered to be more realistic
compared to response spectrum analysis.
Most useful for very long or very tall structures (flexible structures).
DRAW BACKS IN TIME HISTORY ANALYSIS
It will take much time to perform analysis.
Generates and require large quantities of Data.
May not always reduce seismic forces in structure. Depends on
-soil properties
-structural type and available data
AIM OF MODELLING
The main objective of evaluating the performance of a system for unconditional unknowingly blast effect mainly depends on the preliminary design and the method of analysis.. There are two main concerns for
modeling a beam-column or any other structural members.
Force-displacement relationship. A beam-column member exerts a force on the adjacent members and the connections including these members have deformations that contribute to the displacement of the complete structure.
Demand-capacity measures. Force and deformations are important for modelling the behaviour of the structure, but demand capacity ratios are required to access performance assessment without demand-capacity ratios, however member performance assessment requires demand-capacity ratios.
MODELLING OF BUILDING FRAMES
Frameworks modelled for nonlinear response were run for nonlinear static analysis using the estimated base shear under code based values. Details of the building frame works are listed below,
Ten storey R C building frame of 18.28m x 18.28 m size.
Height of each storey is 3.048 m.
Grade of concrete for beams and columns is M25.
Internal brick wall thickness is 150mm
External wall thickness is 230mm.
Density of concrete is 25 kN/m3.
Density of Brick work- 18 KN/m3.
Live load on floors- 3.0 kN/m2.
Live load on roof – 1.5 kN/m2.
Grade of steel used – Fe415 and Fe500. Floor finishing – 1.0 kN/m2.
Seismic criteria considered for this building is:
1. Response reduction factor, R= 5. 2. Importance factor, I= 1.5.
3. Zone factor for Zone IV, Z= 0.24. The building plan consists of 4 X 3 bays. The storey height is 3.04
Table-6.1 The dimensions of all the beams and column.
All External columns 300 X 600 mm All Internal columns 450 X 600 mm Slab thickness 120 mm
Figure 6.1: Plan of G+10 storey R C building in SAP 2000
Figure 6.2: 3-D model view of G+10 storey R C building in SAP2000
RESULTS AND DISCUSSION RC BUILDING SUBJECTED TO
BLAST LOADING
A 100 feet height RC building is taken to analysis for Blast loading. The size of the building is 60 ft X 60 ft. The building is modelled in SAP 2000, and performed Response spectrum analysis. The plan of the structure is shown in figure-6.1 and the 3D model in SAP 2000 as shown in figure-6.2 the blast loading on the structure is determined for two individual explosion weights said to be as 2500 lbs and 5000 lbs at a standoff distance of 50, 100, 150 feet’s. All the blast parameters are evaluated and the final Impulsive force is determined and plotted. These Impulsive force and time plots to the model in Time-history analysis. To determine the performance of any structure it is necessary to subject the
structure to Time-history analysis, if the input function is nonlinear dynamic in nature. Time-History analysis is very complex and time consuming, but it will give accurate values. At every standoff distance we have calculated Impulsive force, and these were used in TH. Blast loading is entirely different from seismic load. The seismic load will said to be vibrative forces where as the blast load is impulsive. The performance of the building is determined at every standoff distances and the plots between Displacement-Time, acceleration-Time were shown in results.
RESULTS SUMMARY
When the explosion weights of 2500 lbs and 5000 lbs are exploded at a standoff distance of 50 100 and 150 feet the Impulsive force-Time plot as shown in figure-5.5 and 5.6 is given as input to the nonlinear dynamic Time history analysis, then the resulted plots are as follows, and the maximum displacements of joint and maximum accelerations are tabulated below:
Table 7.1 maximum Displacements and acceleration
Explosive Weight (lbs)
Standoff Distance (ft)
Max
Displacement (mm)
Max. Acceleration (m/s2)
2500
50 75 215
100 67 158
150 44 130
5000
50 648 4930
100 597 2200
150 244 498
Figure 7.2 Acceleration-Time Plots for 2500 Lbs And 5000 Lbs @50 Feet Standoff Distance Respectively
Figure 7.3 Displacement – Time Plots for 2500 Lbs And 5000 Lbs @100 Feet’s Standoff Distance Respectively
Figure 7.4 Acceleration-Time Plots For 2500 Lbs And 5000 Lbs @100 Feet’s Standoff Distance Respectively
Figure 7.6 Acceleration-Time Plots For 2500 Lbs And 5000 Lbs @150 Feet’s Standoff Distance Respectively
CONCLUSIONS
IS 4991-1968 didn't considered the negative pressure in the Pressure-Time plot, why they didn't thought about mean, under the effect of positive stage span, the dislodging of the structure is more than the removal when thought about the Negative pressure. This will go about as a wellbeing factor, so the structure will be exceptionally sheltered in the event that we experienced the Indian code. The variety that I'm watched is given beneath plots.
Figure 7.7.a: Displacement of 2500@50 Feet’s with Considering Negative Pressure
Figure 7.7.b: Displacement of 2500@50 Feet Without Considering Negative Pressure
In above plots the dislodging of 2500lbs @50 feet's is 74mm when the negative stage span is considered. On the off chance that the negative stage term is dismissed, the uprooting is seen as 90mm. So by that we can realize that there is more redirection under the loading without thinking about the Negative stage term. So this issue behind that why our Indian code didn't thought about the negative stage span. In any case, Indian code didn't give the adequate information to deciding the impact parameters when the explosion weight is more than 1 ton. Since the parameters were given just for one ton touchy weight. So our Indian code requires Revision.
Aside from impact of Negative pressure, a portion of the accompanying focuses were seen amid my investigation. The positive and Negative incautious forces were in expanding request when the standoff separations are in decline. The Impact shoot range on the structure is more at standoff separation of 150 feet's, and after that the sweep is in diminishing request when the standoff remove is likewise diminished.
The avoidances in structure, under the explosion weight 5000lbs are about 10 times of redirection under the touchy load of 2500lbs.
So the harm and the impact under the explosion load of 5000lbs is 10times more than the explosion load of 2500lbs. As I said in over, the presentation of Negative period of loading diminishes the sufficiency of vibration of the building, however it may not impact for high story buildings. Due to sudden change in the loading from positive stage to negative stage, building by then moves inactively, the sections at the best will move aloof and the base segments will move effectively as a result of inversion loading. The impact of tallness of building doesn't make a difference while ascertaining the impact parameters, yet the impact of impact parameter will be more on the tall buildings, so therefore more harm will happen for high raise building.
SCOPE OF FUTURE STUDY
Present investigation has restricted extension with accentuation on structure explosion association. To grow clear understanding, it uncovers that, more research ought to be done on this subject. To decide the correct conduct or the execution of the building requires some model investigation. Yet, it is exceptionally hard to state that, which building is protected and which one isn't. Since the explosion like in World exchange focus (2001) won't ready to withstand by a building on the planet. A portion of the Recommendations for future work are proposed as pursues, to know the better execution of any building, advancement of model is required. Revision of Indian code 4991-1968, is required on the grounds that it does exclude the Negative stage loading, since it may demonstrate impact for tall buildings. Not just hence, IS code gives the information just to one ton unstable weight, so it is extremely hard to discover the shoot parameters for over one ton dangerous load by IS code. Comparative investigation as far as diagnostic methodology ought to be expanded for finding the execution
under fluctuating interest emerging because of impact loading.
Study of auxiliary components (shaft, segments, chunks ets) should be given due weight age under impact loading. Non auxiliary components conduct likewise to be examined in subtleties for limiting harm cost under loading emerging because of impact. Interaction of basic and non basic components as far as standardized harm record be produced. Vulnerability Steel building may likewise be assessed under the recommended states of impact loading.
REFERENCES
[1]. TM 5-1300(UFC 3-340-02) U.S. Army Corps of Engineers (1990), “Structures to Resist the Effects of Accidental Explosions”, U.S. Army Corps of Engineers, Washington, D.C., (also Navy NAVFAC P200-397 or Air Force AFR 88-22).
[2]. T. Ngo, P. Mendis, A. Gupta & J. Ramsay, “ Blast Loading and Blast Effects on structure”, The University of Melbourne, Australia, 2007.
[3]. Zeynep Koccaz, Fatih Sutcu, and Necdet Torunbalci study on “architectural and structural design for blast resistant buildings”. 14 WCEE-05-01-0536.
[4]. “Response Of Model Structure Under Simulated Blast-Induced Ground Excitations”, by Yong LU, Hong HAO, Guowei MA and Yingxin ZHOU.12 WCEE-2000-0972.
[5]. Alexander M. Remennikov, (2003) “A review of methods for predicting bomb blast effects on buildings”, Journal of battlefield technology, vol 6, no 3. pp 155-161.
[6]. “Prediction and Assessment of Loads from Various Accidental Explosions
for Simulating the Response of
Underground Structures using Finite Element Method” by Akinola Johnson Olarewaju. Ppr.2013.032-alr.
Nuclear Engineering and design 236. pp.993-1002.
[8]. Impacts and Analysis for Buildings under Terrorist Attacks by Edward Eskew, Shinae Jang Department of Civil and Environmental Engineering University of Connecticut. Ppr 2012.11.16.
[9]. ]. Newmark, N. M.; Hansen, R. J.Design of blast resistant structures. // Shock and vibration Handbook, Vol. 3, Eds. Harris and Crede. McGraw-Hill, New York, USA.1961.
[10]. Mills, C. A. The design of concrete structure to resist explosions and weapon effects. //Proceedings of the 1st Int. Conference on concrete for hazard protections, Edinburgh, UK, pp. 61-73, 1987.
[11]. Brode, H. L. Numerical solution of spherical blast waves. // Journal of Applied Physics, American Institute of Physics,New York, 1955.
[12]. IS 4991-1968; criteria for blast resistant design of structures for explosions above ground (third Reprint AUGUEST 1993). Bureau of Indian Standards, Manak Bhavan 9, Bahadur shah Zafar Marag, New Delhi, India.
[13]. Remennikov, A. M. A Review of Methods for Predicting Blast Effects on Buildings. // Journal of Battlefield Technology, Aragon Press Pty Ltd., 6, 3(2003), pp. 5- 10.
[14]. Mays, G. C.; Smith, P. D; Blast Effects on Buildings – Design of Buildings to Optimize Resistance to Blast Loading, Tomas Telford, 2001.
[15]. Crandell, F.J. “Ground vibration due to blasting and its effects upon structures”, J. of the Boston Soc. of Civil Engineers, April 1949, 222-245.
[16]. Edwards, A. T., and Northwood, T. D. “Experimental Studies of the effects of Blasting on structures”, The engineers, 1960, V.210, 538-546.
[17]. Moon, Nitesh N. Prediction of Blast Loading and its Impact on Buildings,
Department of Civil Engineering, National Institute of Technology, Rourkela, 2009. [18]. Duranovic, N.Eksperimentalno
modeliranje impulsom opterecenih