microstructure evolutions of a HMX-based explosive. Hopkinson bar compression experiments are carried-out on samples confined with a brass sleeve. The latter is instrumented in order to determine the confining pressure on the explosive sample, directly function of the sleeve thickness and yield strength. A sample confined at 75 MPa and deformed at 250 s−1is recovered, cross-sectioned and studied using optical microscopy. Distributed microplasticity and microcracking appear similar to those induced by confined quasi-static experiments, indicating that stress triaxiality is the most important loading parameter. The sample also displays a large shear macrocrack, resulting from the formation of an adiabatic shear band. Shear banding seems to proceed by strong plastic strain gradients, followed by dynamic re-crystallization. Further strong thermal effects are observed, resulting in local reactive melting.
1 Introduction
Low velocity impacts on HMX-based explosives are an important issue of pyrotechnic safety, as they are known to induce violent responses, generally deflagrations and even detonations in rare cases. Ignition of the explosive is thought to proceed by a sequential hot spot process, involving heterogeneous deformation and self-heating, that triggers local chemical reactions (hot spots) and energy release, and finally hot spot spreading and coalescence. In the frame of physically-based modelling approach, it is thought that sub-macroscopic physical processes really involved should first be sought and identified.
For this purpose, a methodology has been defined, aiming at mapping and relating small-scale effects to macroscopic loads. It relies on optical microscopy stud-ies of polished microsections of samples recovered af-ter a series of compression experiments, mainly parame-trized by stress triaxiality (confining pressure) and strain rate, in a range representative to low velocity impacts. In the past [1, 2], samples from quasi-static uniaxial com-pression, Hopkinson bar compression experiments and quasi-static conventional triaxial compressions have been studied in such a way. Recently, Hopkinson bar experi-ments on confined samples have been designed, allowing high pressure and strain rate to be applied simultaneously on explosives [3]. The present study is dedicated to the microstructural characterization of a sample recovered after such an experiment.
The material at stake is a bimodal HMX plastic-bonded explosive containing less than 5% rubbery binder, and hot-pressed to more than 98% theoretical maximum density.
2 Hopkinson bar experiments
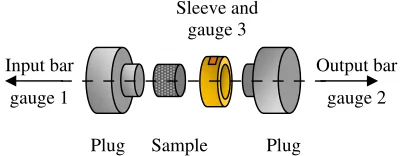
Confined dynamic compression experiments are performed using the well-known Split Hopkinson Pressure Bar (SHPB) apparatus. It is composed of three 20 mm diameter steel
Plug Plug Sample
Sleeve and gauge 3
Input bar
gauge 1
Output bar
gauge 2
Fig. 1.Schematic of the solid confining system used on a SHPB apparatus.
bars. The striker’s length is half the input bar’s, i.e. 1.25 m. The output bar is 2 m long. The samples are 10 mm diameter cylinders, and hat-shaped steel plugs are used to adapt the difference of sections between the sample and the bars. The confining pressure is applied to the sample by a brass sleeve, in which the sample is inserted (Figure 1). To ensure tight contact and confining pressure transmission from the beginning of the experiment, the inner diameter of the sleeve is machined to be slightly smaller than the sample’s diameter [4].
The compression stress is applied to the sample through the plugs. The sample then exerts a radial stress on the sleeve, which expands radially in an elastic fashion until its yield stress is reached. A transient phase follows, and lasts until the entire sleeve has flowed. At this stage, the radial traction at the sleeve-sample interface (which represents the sample confining pressure) becomes constant. Using an elastic-perfectly plastic sleeve material (brass in the present case), the confining pressure and its evolution can be computed (Figure 2) from the knowledge of the sleeve hoop strain measured at its external surface [3].
The experiment is instrumented by two strain gauges glued to the input and output bars respectively, and by a gauge glued on the sleeve, (Figure 1). The signals of both the Hopkinson bars and the sleeve are recorded through quarter-Wheatstone bridges and signal condition-ing amplifiers linked to dedicated acquisition software.
Fig. 2.Internal traction calculated for the four tests from the hoop strain measurement given by gauge 3.
The longitudinal stress-strain sample response is deter-mined via standard Hopkinson data extraction procedure, and the confining pressure is calculated as described above. The unconfined compressive behaviour of the stud-ied material displays a highly rate-dependent quasi-brittle (concrete-like) behaviour, characterized by a peak stress of 18 MPa at 10−6s−1, but 50 MPa at 300 s−1 [5]. The strain at peak stress tends to increase with strain rate. Confined quasi-static compression experiments show that a brittle-ductile transition takes place around 30 MPa confining pressure, with a strain hardening elastic-plastic behaviour at higher confinement [2, 3].
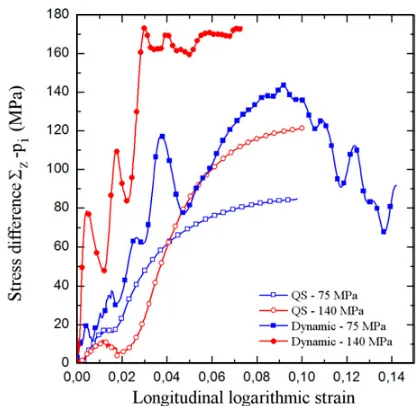
The aim of the present work being to assess the effect of combined high strain rate and confining pressure, four compression experiments are performed for two strain rates (10−4s−1and 300 s−1) and for two confining pressures (75 and 140 MPa).
The two quasi-static experiments are conducted with an electromechanical machine. The sample longitudinal strain is directly calculated from the upper platen displace-ment. The sample responses are displayed in Figure 3 in the principal stress difference versus longitudinal strain plot, together with the results of the two dynamic exper-iments. The end of each curve does not correspond to sample fracture, but to the sleeve gauge record ending.
Dynamic tests were performed with a quasi constant strain rate of 250 s−1, except for the first 2% longitudinal strain where a peak of 350–450 s−1 is observed. The bar gauge signals were very noisy, especially in the rising phase, so that data reduction was performed using only the output bar signal. These oscillations will be explained later, using numerical simulations. It should be added that the load is not limited to the first compressive wave generated by the impact of the projectile on the input bar, but also of all compressive and tensile waves generated by reflections on the interfaces. As the strain recordings are only available for the first compressive wave (i.e. for 500µs), we have no information on the mechanical response (particularly for strain magnitudes) of the sample after the first 500µs.
Fig. 3.Results of axial stress-strain curves for the quasi-static and dynamic compression tests.
Fig. 4.View of the recovered sample from above (left), and after axial slicing (right). Dashed lines represent the 10 mm diam. ends of the plugs.
The first 2% strain of the quasi-static results of Fig-ure 3 correspond to the transient yielding phase of the sleeve. Nevertheless, these curves show a clear pressure-dependent behaviour, with a strong increase of ductility. No ultimate strength is detected: the explosive behaviour appears elastoplastic, which brings out a brittle-ductile transition under pressure, consistently with previous find-ings [1, 2].
The comparison between quasi-static and dynamic results of Figure 3 shows that the effect of strain rate is weaker under confinement than in the uniaxial case discussed above. Actually, confinement effect seems to be predominant compared with rate effect. This has already been observed for concrete-like materials [6].
The 75-MPa-dynamic result displays clear softening at 9% of longitudinal strain, although no softening is ob-served for the quasi-static tests at such strain magnitudes. This is thought to be the consequence of strain localization followed by macrocracking, as discussed below.
As seen on the axial cross-section (Figure 4), the sample is slightly rotated and has undergone an anti-clockwise tilt of a few degrees.
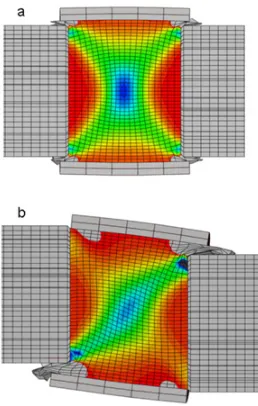
Fig. 5. Numerical results, longitudinal strain fields (red: 0%, yellow: −12.5%, green: −25%, blue: −50%). a: symmetrical case, showing strain gradients produced by friction cones;b: ill-aligned case, showing rotational motion and an S-shaped strain localization zone.
Explicit, with and without off-axis shifts, for comparison purposes. The centred case shows the existence of the friction cones classically observed in compression exper-iments, as displayed in Figure 5a. This induces strains gradients throughout the sample, consistently with mi-crostructural findings (see below).
In the ill-centred case (see Figure 5b), one branch of the friction cone is strongly enhanced, resulting in an S-shaped shear band. The branch connects the sample edges free from plugs contact. The shear banding premises appear only a few tens of microseconds after the beginning of the sample compression, i.e. less than 1% of compression. High gradients of longitudinal strain result, along with material flow through the gaps created by this shifting, between the plugs and the sleeve. This simulation con-firms that off-axis shifting leads to a rotational motion of the sample. Although the simulation is not suited for strain localization treatment, the numerical results are quite consistent with observations. It is therefore likely that off-axis shifting of the plugs of the 75-MPa-dynamic test is responsible for the fracture of the sample and to its softening response. Moreover, the numerical analysis shows that off-axis impacts induce force oscillations, and is thus very probably responsible for the noisy experimental signals.
Owing to its complex and well-documented loading path and history, the following microstructural study fo-cuses on the 75 MPa sample.
3 Initial microstructure
Figure 6 shows a representative view of the initial mi-crostructure of the material. The latter appears as a com-posite of large HMX grains (denoted as grains in the fol-lowing) and a mixture of small grains and binder (denoted as matrix hereafter).
Fig. 6.Initial microstructure of the studied material.
Fig. 7.Overall view of the axial plane at low magnification.
The initial microstructure is not defect-free. The grains contain intra-granular microcracks, many of which arising from grains mutual contact areas. The matrix grains are generally free from microcracks. The grains also contain twin-like structures, as do some of the largest matrix grains. Finally, some grains and the matrix display pores. The largest part of the porosity (total value slightly larger than 1%) lies in the matrix, and appears as inter-granular in nature.
There is no preferential orientation of the grains, nor of the defects present in the sample.
4 Microstructural study
4.1 Introduction
Fig. 8.Example of twinned and microcraked grains.
∼0.5 mm symmetrical off-axis shifts. Finally, material has flowed between the plug and the sleeve, leaving a “horn” at the top-left corner of the sample.
Detailed observation reveals the superposition of a variety of features at the microscopic scale distributed throughout the sample, and several macrocracks, the most obvious one being the large S-crack.
4.2 Microcracking and microplasticity
Outside the macrocrack zones, microstructural changes are rather well distributed and include preferential orientation, increase of twin density, intra- and inter-granular microc-racking. None of those alterations appear uniform in the sample. They are stronger in the central zone than at the sample periphery.
Figure 7 shows a horizontal preferred orientation of the grains, especially in the central and lower zones of the sample. It is not clear whether the change of orientation is associated or not with an elongation of the grains.
At higher magnification, the grains display a significant increase of both twins and intra-granular microcracks, compared to the initial state (Figure 8). Detailed obser-vation of feature interceptions shows that twinning and microcracking are concomitant.
Intra-granular microcracks seldom display tangential displacement jumps. Opening displacements remain of the order of a micron at most. A careful examination of grains shows that twinning and microcracking are concomitant.
Grain-matrix debonding is frequently observed. Al-though residual opening can locally reach of couple of mi-crons, it is generally very small. Yet it produces an optical artefact at low and medium magnification enhancing grain boundaries.
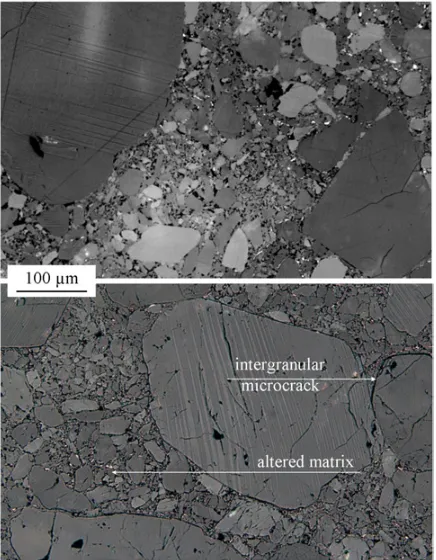
The matrix itself displays two kinds of alterations, namely dilation and intra-granular microcracking (Fig-ure 9). The latter tend to be oriented. The former can only be detected at the highest magnification and is better ex-posed near the macrocracks. Neither preferred orientation nor elongation of the fine grains in the matrix have been observed.
4.3 The S-crack zone
The S-crack, which crosses the whole sample, is char-acterized by an opening of around 20µm, and a large
Fig. 9.Morphologies of the matrix of the pristine material (upper view) and of the recovered sample (lower view) taken at the same magnification.
Fig. 10.Heavy plastic deformation in the neighbourhood of the S-crack.
tangential displacement. The latter is difficult to assess, as corresponding features can hardly be recognized on both sides of the crack. To fix ideas, if a tentative value of 650µm is chosen for the tangential displacement jump, then the remaining average longitudinal strain is of the order of 13%. Two more or less parallel replicas are present in the central zone of the sample. Although of limited extension, they bear a tangential displacement of the order of 100µm.
The S-crack is characterized by a large local gradient of plastic deformation. In its neighbourhood, the grains are so heavily deformed that individual twins can no longer be resolved (see Figure 10).
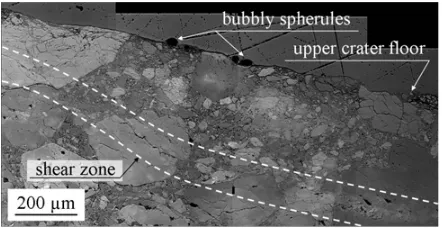
Fig. 11.Thermal effects along the S-crack.
Fig. 12.The top crater and its surroundings.
opening, many bubbly spherules can be found, interpreted as vesicular glass resulting from quenched reaction and outgassing HMX liquid droplets (figure 11).
4.4 The craters and related macrocracks
The surface of the crater and its immediate surroundings bear a close similarity with those of the S-crack, and dis-plays the same thermal effects, including re-crystallization, local melting and spherules (Figure 12). This surface is thus interpreted as the lower lip of a shear macrocrack. This is supported by the evidence of shear deformation
∼500µm below the crater floor.
Emanating from the left boundary of the crater, a mode I macrocrack develops symmetrically on both sides of the sample, and end up in the S-crack (Figure 13). The region between the crater and the S-crack is pervaded by intra-granular microcracks oriented perpendicular to the crater surface, suggesting a tensile state of stress.
5 Discussion and conclusions
The analyzed sample displays a very complex structure, characterized by the superposition of distributed features (microplasticity, microcracks) and localized objects (S and crater macrocracks and their vicinities). The numerical analysis suggests that the compression process can be di-vided into two successive steps, namely quasi-homogeneous deformation and strain localization. It is reasonable to consider that the first stage is associated with the hardening part of the overall response (see Figure 1). Accordingly, the
Fig. 13.A mode I macrocrack linking the upper crater with the S-crack.
second stage of strain localization should be characterized by a softening response corresponding to strain accumu-lation in the localized zone and (visco)-elastic unloading elsewhere.
To the first stage should thus belong most of the distributed small scale features. The intensity of microplas-ticity and microcracking is clearly not homogeneous and displays gradients, especially in the ortho-axial direction. They are maximum along the vertical axis and decrease to much lower values at the lateral edges of the sample, i.e. at the sample-sleeve interface. This is attributable to friction at this interface, preventing or slowing down longitudinal straining in its vicinity.
The deformation mechanisms are concomitant crys-tal plasticity, microcracking and matrix alteration. This is what was observed in samples recovered after quasi-static triaxial compression experiments in the same con-fining pressure range [1, 2]. Meanwhile, this picture is very different from observations in a sample recovered after a dynamic uniaxial compression experiment [1, 2]. This confers a relatively minor role to strain rate under confinement, from a microstructural standpoint.
The predominant horizontal orientation of (large) grains is either due to crystal plasticity or to simple grain rota-tion. Quantitative measurements on large grain elongations should allow determining the right mechanism. The very limited grain-matrix microcrack residual opening shows that the matrix accommodates grain plasticity irreversibly. This probably occurs by small grains relative motion rather than by small grain plasticity, since no obvious change in the small grains average aspect ratio is noticed.
It is difficult to suggest an interpretation for the forma-tion of the craters and the mode I cracks. They indicate that strong shear and tensile stress states occur in this zone, but additional analyses are required for further understanding of these phenomena.
The present results represent the very first attempt to evaluate and link the macro- and mesoscopic responses of the studied material when submitted to a well-controlled load representative to low velocity impacts. More work is clearly required. However, these first results demonstrate the interest of the proposed methodology. As the respective
Detonation, Coeur d’Alene (ID), USA (2010)
3. P. Bailly, F. Delvare, J. Vial, J.-L. Hanus, M. Biessy, D. Picart, Int. J. Impact Engrg.,38(2011)
4. P. Bailly, F. Delvare, M. Biessy, D. Picart, DYMAT 2009, Bruxelles, Belgium (2009)
5. D. Picart, M. Biessy, J.-L. Brigolle, DYMAT 2009, Bruxelles, Belgium (2009)
6. M. J. Schmidt, O. Cazacu, J. Phys. IV France, 134 (2006)