Prioritization of Sub Watersheds using
Morphometric Analysis: A Remote Sensing
and GIS Perspective
Love Kumar1, D. Khalkho*2, P. Katre3, G. K. Nigam4
Ph.D. Scholar, SVCAET & RS, FAE, IGKV, Raipur, C.G, India1
Scientist/Asstt. Professor, SVCAET & RS, FAE, IGKV, Raipur, C.G, India 2&3
ABSTRACT: Geographical information system and remote sensing are proven to be an efficient tool for locating water harvesting structures by prioritization of Sub-Watersheds through morphometric analysis. In this study, the morphometric analysis and prioritization of seventeen Sub-watersheds of maniari watershed, situated in Lormi block of Mungeli District Chhattisgaarh State, India, was studied. For prioritization of sub-watersheds, morphometric analysis was utilized by using the Linear parameters such as Stream order, Stream length, Stream length ratio, Basin length, Bifurcation ratio, Mean bifurcation ratio, Drainage density, Stream frequency, Texture ratio, Length of overland flow and Shape parameters such as Form factor, Shape factor, Circulatory ratio, Elongation ratio, and Compactness constant. The different prioritization ranks were assigned after evaluation of the compound factor. So the entire study area has been further divided into 17 sub watersheds named 4G3F4n, 4G3F4p, 4G3F4q, 4G3F4r, 4G3F5a, 4G3F5b, 4G3F5c, 4G3F5d, 4G3F5f, 4G3F5g, 4G3F5h, 4G3F5j, 4G3F5k, 4G3F5m, 4G3F5n, 4G3F5p and 4G3F5s, ranging in geographical area from 39.57 km2 to 112.78 km2 and has been taken up for prioritization based on morphometric analysis using GIS and remote sensing techniques. The drainage density of sub watersheds varies between 1.04 to 4.35 km/km 2 and low drainage density values of subwatershed 4G3F4n indicates that it has highly resistant, impermeable subsoil material with dense vegetative cover and low relief. The elongation ratio varies from 0.62 to 0.67 which indicates high relief and steep ground slope. The high value of circularity ratio for 4G3F5h subwatershed (0.69) indicates the late maturity stage of topography. This anomaly is due to diversity of slope, relief and structural conditions prevailing in this subwatershed. The compound parameter values are calculated and the sub watershed with the lowest compound parameter is given the highest priority. The subwatershed 4G3F5m has a minimum compound parameter value of 4.5 is likely to be subjected to maximum soil erosion and susceptible to natural hazards. Hence it should be provided with immediate soil conservation measures.
KEYWORDS: Watershed, GIS, Remote sensing, Morphometric analysis, Prioritization
I. INTRODUCTION
and geomorphic processes occur within the watershed. The prioritization process identifies the highest priority watershed(s) or erosion susceptibility zone to initiate treatment. Watershed prioritization is the ranking of different micro-watersheds of the catchment according to the order in which they may be undertaken for drainageline treatment and soil conservation measures. Once the micro-watersheds are prioritized, quantitative assessment of morphometric parameters of micro-watersheds serve as basic information for adopting suitable soil and water conservation measures.
In the present study an attempt has been made to quantify various morphometric parameters of in accessible maniari Sub watershed of Mungeli District and prioritize erosion susceptibility zones mapping based on ranks obtained from morphometric parameters to initiate management. The present study utilizes the Geographic Information System (GIS) analytic techniques to evaluate morphometric parameters. The morphometric parameters considered for analysis are area of watershed, perimeter, length of basin, stream length, bifurcation ratio, drainage density, drainage texture, stream frequency, compactness coefficient, form factor, circularity ratio, elongation ratio, length of overland flow etc. Watershed boundary map, drainage network map and contour map are utilized for computation of morphometric parameters. A watershed management programme has been proposed for one of the high priority Sub watershed.
II. MATERIALS AND METHODS
Description of Study area
Sub watershed is is situated in Lormi block of Mungeli District and located between 21011’0”and 21034’0” N latitudes and 81028’30” and 81057’30” E longitudes (Fig 1). It falls in SOI topographical map no. 64 F/12 (1: 50,000). The Maniari watershed covers geographical area of 1085.65 km2. The general elevation of the area ranges from 262 to 980 m above mean sea level (MSL).
Database and Methodology
The study was carried out on sub-watershed level utilizing survey of India SOI toposheets. All the steams were digitized from Survey of India Toposheets, 2009 on a scale of 1:50,000. odification map provided by Survey of India, Raipur, Chhattisgarh. Maniari watershed is covered by topographic map No. (64 F/6, 64 F/7, 64 F/10, 64 F/11, 64 F/12, 64 F/14, 64 F/15, and 64 F/16) of 1:50,000 scale having 10 m contour interval. Strahler (1964) system of stream analysis is probably the simplest, most used system and the same has been adopted for this study. The study was carried out in GIS environment utilizing Arcgis 10 a for digitization and computational purposes and also for output generation. Map creation, Scanning, Georeferencing, Spatial data and Topology Creation are the steps involved in the morphometric analysis of Sub-watersheds. The various morphometric parameters such as area, perimeter, length of basin, stream length stream number, bifurcation ratio, drainage density, stream frequency, drainage texture, length of basin, form factor, circulatory ratio, elongation ratio, length of overland flow were computed using standard methodology and formulae are given in Table 1 and Methodology used in this study is shown in Fig. 2.
III. RESULTS AND DISCUSSION
Morphometric analysis
Morphometry is a science that attempts to quantify the shape of a drainage basin. It can also be defined as the measurement and mathematical analysis of the earth‟s surface, shape and dimensions of its landforms. The morphometry of a drainage basin reveals the impact of climate on geomorphic processes among various landforms. A drainage basin, which is defined as the area receiving water from rainfall in a particular set of channels, is the most convenient unit for the study of geomorphology and hydrology. The amount of water reaching the stream is dependent upon the size of the basin, the total precipitation and the losses due to evaporation and absorption by soil and vegetation. The drainage network is influenced by lithology, structure etc. the texture of drainage pattern and its density not only define a given geomorphic region, but also indicate the stage in the cycle of erosion. The properties and pattern of a drainage basin are dependent upon a number of classes and among them, nature, distribution, morphology of the drainage network that carry runoff are the most important features. The watershed was divided into seventeen sub-watersheds shown in Fig. 1.The information about basic morphometric parameters such as area (A), perimeter (P), length (L), and number of streams (N) was obtained from sub watershed delineated layer, and basin length (Lb) was calculated from stream length, while the bifurcation ratio (Rb) was calculated from the number of streams ( Fig. 3). Other morphometric parameters were calculated using the equations as described in Table 1. Linear parameters have a direct relationship with erodibility by (Nooka Ratnam et al. 2005): Higher the meter value, higher is the erodibility. For prioritization of sub watersheds, the highest value of linear parameters was rated as rank 1, second highest value was rated as rank 2 and so on, and the least value was rated last in rank. On the contrary, the shape parameters have an inverse relation with linear parameters, so that the lower their value, the more the erodibility (Patel and Dholakia 2010; Patel et al. 2012). Lower the value more is the erodibility. Thus the lowest value of shape parameters was rated as rank 1, next lower valuewas rated as rank 2 and so on and the highest value was rated last in rank. Compound factor was then worked out by summing all the ranks of linear parameters as well as shape parameters and then dividing by number of parameters. From the group of sub-watersheds, highest prioritized rank was assigned to sub-watershed having lowest compound factor and vice versa (Patel et al. 2012).
Basic parameters Basic parameters include watershed area, perimeter, stream length, stream order, and basin length.
Area
The rate of runoff of any drainage basin depends on its area and physiography. The drainage basin area is a dimensional parameter and it is denoted by A. The drainage basin is instrumental in governing the rate at which water is supplied to the main stream as it precedes to the outlet. Area of basin of a particular order is defined as the total area projected upon a horizontal plane, contributing overland flow to the channel segment of a given order including all the tributaries of the lower order. The factors which are dependent on the basin length are length of stream, degree of slope, drainage frequency, drainage density, shape parameters (i.e., form factor, circulatory ratio and elongation ratio), rainfall, rate of runoff etc. Larger the area, smaller is the runoff and vice versa. Table 3 shows that in geographical area of Sub watersheds value ranges from 39.57 km2 to 112.78 km2 for the watersheds with lowest value for sub-watershed no 4G3F5s and highest value for the sub-sub-watershed no 4G3F5p respectively.
Perimeter
Basin Length
It is the length of longest dimension of a basin as projected on a horizontal plane and it is denoted by Lb. As the basin length increases, the peak discharge decreases. Table 3 shows that in basin lengths of Sub watersheds value ranges from 10.60 km to 19.21 km for the sub-watersheds with lowest value for sub-watershed no 4G3F5s and highest value for the sub-watershed no 4G3F5p respectively.
Stream Order
The designation of stream orders is the first step in drainage basin analysis. It is based on hierarchic ranking of streams proposed by (Strahler, 1964). The first order streams have no tributaries. The second order streams have only first order streams as tributaries. Similarly, third order streams have first and second order streams as tributaries and so on. After analysis of the drainage map, it is found that maniari watershed is 6th order stream and drainage pattern is dendrite. The basins Stream Order of different sub-watersheds are given in Table 2.
Stream Length
It is the total length of streams in a particular order and it is denoted as Lu. The numbers of streams of various orders in a Sub-watershed were counted and their lengths measured in GIS. Generally, the total length of stream segments decrease with stream order. Length of different drain segments have been extracted in GIS and presented in Table 2. Higher length of streams in sub-watersheds revealed good morphologic characteristics. Table 3 shows that in Total length of stream of Sub watersheds value ranges from 84.03 km to 373.03 km for the sub-watersheds with lowest value for sub-watershed no 4G3F4n and highest value for the sub-watershed no 4G3F5h respectively.
Basin length (Lb)
It is usually defined as the distance measured along the main channel from the watershed outlet to the basin-divide. Since the channel does not extend to the basin-divide, it is necessary to extend a line from the end of the channel to the basin-divide following a path where the greatest volume of water would travel. Thus, the length is measured along the principal flow path. Basin length is the basic input parameter to count the major shape parameters. Table 3 shows that in Basin length (Lb) of Sub watersheds value ranges from 10.60 to 19.21 for the sub-watersheds with lowest value for sub-watershed no 4G3F4s and highest value for the sub-watersheds no 4G3F5p respectively.
Linear parameters include bifurcation ratio, drainage density, stream frequency, texture ratio, and length of overland flow.
Bifurcation Ratio
It is the ratio of the numbers of streams of a given order to the number of streams of the next higher order. Horton (1945) considered bifurcation ratio (Rb) as an index of relief and dissections. Strahler (1957) demonstrated that Rb shows only a small variation for different region on different environment except where powerful geological control dominates. Lower Rb values are the characteristic of structurally less distributed watersheds without any distortion in drainage pattern (Nag, 1998). Higher value of Rb for sub-watershed indicates high runoff, low recharge and mature topography. A high Rb is expected in the region of steeply digging rock strata, where narrow valley is confined between the ridges. Irregular Rb values in these sub-watersheds do not subscribe to Horton‟s Law of stream numbers. These irregularities are dependent on geological and lithological development of drainage basin (Strahler, 1964). Table
4 shows that in mean bifurcation ratios (Rb) of Sub watersheds values ranges from 2.33 to 4.81 for the sub-watersheds with lowest value for sub-watershed no 4G3F4n and highest value for the sub-watershed no 4G3F5p respectively.
Drainage Density
drainage density is observed in region of weak and impermeable subsurface material and sparse vegetation and mountainous relief. Table 4 shows that the Drainage Density (Dd) of Sub watersheds value ranges from 1.04 to 4.35 for the Sub watersheds with lowest value for Sub watershed no 4G3F4n and highest value for the Sub watershed no 4G3F5a respectively.
Length of Overland Flow
It is the length of water over the ground before it gets concentrated into definite stream channels (Horton, 1945). This factor relates inversely to the average slope of the channel and is quite synonymous with the length of sheet flow to a large degree. It approximately equals to half of reciprocal of drainage density. Table 4 shows that in Length of Overland Flow (Lg) of Sub watersheds value ranges from 0.52 to 2.27 for the sub-watersheds with lowest value for sub-watershed no 4G3F4n and highest value for the sub-watershed no 4G3F5a respectively.
Stream/Drainage Frequency
Drainage frequency is the measure of the topographic feature. Stream frequency/drainage frequency (Df) is the total number of stream segments of all orders per unit area (Horton, 1932).
Table 4 shows that in Stream/Drainage Frequency (Df) of Sub watersheds value ranges from 0.17 to 6.69 for the sub-watersheds with lowest value for sub-watershed no 4G3F4n and highest value for the sub-watershed no 4G3F5n respectively.
Texture ratio
It is the total number of stream segment of all orders per perimeter of that area (Horton, 1945). Horton recognized infiltration capacity as the single important factor which influences Texture ratio (Rt) and considered the drainage texture to include drainage density and drainage frequency. Table 4 shows that in Texture ratio (Rt) of Sub watersheds value ranges from 0.19 to 13.44 for the Sub watersheds with lowest value for Sub watershed no 4G3F4n and highest value for the Sub watershed no 4G3F5h respectively.
Shape parameters Shape parameters include form factor, shape factor, elongation ratio, compactness ratio, and circulatory ratio.
Form Factor
It is defined as the ratio of basin area to square of the basin length (Horton, 1932). The value of form factor would always be less than 0.7854 (for a perfectly circular basin). Smaller the value of form factor, more elongated will be the basin. The basins with high form factor have high peak flows of shorter durations, whereas, elongated sub-watershed with low form factor have lower peak flow of longer duration. Flood flows of such elongated basins are easier to manage than of the circular basin. Table 4 shows that in form factor (Rf) of Sub watersheds value ranges from 0.31 to 0.35 for the Sub watersheds with lowest value for Sub watershed no 4G3F5p and highest value for the Sub watershed no 4G3F5s respectively.
Shape factor
It is defined as the ratio of the square of the basin length to area of the basin (Horton 1945) and is in inverse proportion with form factor (Rf). Table 4 shows that in shape factor (BS) of Sub watersheds value ranges from 2.84 to 3.27 for the sub-watersheds with lowest value for Sub-watershed no 4G3F5s and highest value for the Sub-watershed no 4G3F5p respectively.
Elongation Ratio
relief and steep ground slope (Strahler, 1964). Table 4 shows that in the elongation ratio (Re) of Sub watersheds value ranges from 0.62 to 0.67 for the Sub-watersheds with lowest value for Sub-watershed no 4G3F5p and highest value for the Sub-watersheds no 4G3F5s respectively.
Compactness coefficient (Cc)
Compactness coefficient (Cc) can be represented as basin perimeter divided by the circumference of a circle to the same area of the basin and also known as the Gravelius index (GI). Lower values of this parameter indicate more elongation of the basin and less erosion, while higher values indicate less elongation and high erosion. In this study, Table 4 shows that the Compactness coefficient (Cc) of Sub watersheds value ranges from 1.20 to 2.33 for the sub-watersheds with lowest value for Sub-watershed no 4G3F5h and highest value for the Sub-watershed no 4G3F5f respectively.
Circulatory Ratio
It is ratio of the area of the basin to the area of circle having the same circumference as the perimeter of the basin (Miller, 1953). It is influenced by the length and frequency of streams, geological structures, land use/land cover, climate, relief and slope of the basin Table 4 shows that the circulatory ratio (Rc) of Sub watersheds value ranges from 0.18 to 0.69 for the watersheds with lowest value for watershed no 4G3F5f and highest value for the Sub-watershed no 4G3F5h respectively. Sub-Sub-watershed having circular to oval shape allows quick runoff and results in a high peaked and narrow hydrograph, while elongated shape of Sub-watershed allows slow disposal of water, and results in a broad and low peaked hydrograph. High value of Rc indicates mature and old topography. for the Sub-watersheds with lowest value for Sub-watershed no 4G3F5f and highest value for the Sub-watershed no 4G3F5h respectively.
Prioritization of Sub Watersheds Based on morphometric analysis
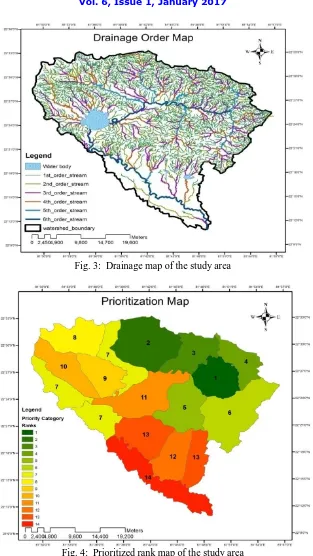
For prioritization, the compound factor is computed by summing all the ranks of linear parameters as well as shape parameters and then dividing by the number of parameters. From the group of these sub watersheds, highest rank was assigned to the sub watershed having the lowest compound factor and so on. Depending upon the value of compound factor, ranking to each sub watershed was assigned as shown in Fig. 4. For subwatersheds, watershed no. 4G3F5m is given rank 1 with least compound factor value 4.5, and it is followed by watersheds no. 4G3F5h and 4G3F5j, as second and third, respectively. The values of compound factor and respective rank of all mini-watersheds are shown in Table 5.
Conclusions
Fig. 1: Layout of the study area
Fig. 3: Drainage map of the study area
Table 2: Sub watershed wise areal parameters
Morphometric parameter Formula Reference
Stream order Hierarchial rank Strahler (1964)
Stream length (Lu) Length of stream Horton (1945)
Mean stream length (Lsm)
Lsm =Lu/Nu
where, Lsm = mean stream length Lu = Total stream length of order ‘u’ Nu = Total no. of stream segments of order ‘u’
Horton (1945)
Stream length ratio (RL)
RL = Lu / Lu-1
where, RL = stream length ratio Lu = Total stream length of order ‘u’ Lu-1 = Total stream length of its next lower order
Horton (1945)
Bifurcation ratio (Rb)
Rb = Nu / Nu + 1 Rb = Bifurcation ratio
Nu = Total no. of stream segments of order ‘u’
Nu + 1 = no. of stream segments of the next higherorder
Schumm (1956)
Mean bifurcation ratio(Rbm) Rbm = Average of bifurcation ratios of all
orders Strahler (1957)
Basin length (Lb)
Lb = 1.321A0.568
where, A= Area of the basin
Nookaratnam (2005)
Drainage density (Dd)
Dd = Lu /A
where, Dd = Drainage density Lu = Total stream length of all orders A = Area of basin (km2)
Horton (1932)
Stream frequency (Fs)
Fs = Nu / A
where Fs = Stream frequency
Nu = Total no. of streams of all orders A = Area of basin (km2)
Horton (1932)
Texture ratio (Rt)
Rt = Nu / p
where, Rt = Texture ratio
Nu = Total no. of streams of all orders P = Perimeter (km)
Horton (1945)
Form factor (Rf)
Rf = A/Lb2
where, A = Area of basin (km2)
Lb2 = Square of basin length Horton (1932)
Shape factor (Bs)
Bs = Lb2/Ah
where, Lb = Square of basin length A= Area of basin (km2)
Nookaratnam (2005)
Circulatory ratio (Rc)
Rc = 4 x π x A /P2
where, Rc = circulatory ratio A = Area of basin (km2)
P = Square of the perimeter (km)
Elongation ratio (Re)
Re =(4 xA / π )0.5/ Lb
where, Re = Elongation Ratio A = Area of basin (km2) Lb = Basin length
Schumm (1956)
Length of overland flow (Lg)
Lg = 1/2Dd
where, Lg = Length of overland flow Dd = Drainage Density
Horton (1945)
Compactness constant (Cc)
Cc = 0.2821P/A0.5
where, A = Area of basin (km2)
P = Perimeter (km) Horton (1945)
Table 2: Sub watershed wise areal parameters
S.No. Sub Watershed Area
(km2) Number of Streams Stream Length in Km
1st 2nd 3rd 4th 5th 6th 1st 2nd 3rd 4th 5th 6th
1 4G3F4n 80.59 8 4 1 1 0 0 7.08 22.9 3.52 50.53 0 0
2 4G3F4p 39.961 42 11 2 3 1 0 31.48 18.73 9.25 8.44 50.53 0
3 4G3F4q 55.13 74 16 6 1 1 0 48.22 21.17 17.12 0.51 50.53 0
4 4G3F4r 64.86 112 21 7 3 1 1 75.89 34.02 19.32 10.28 2.86 50.53
5 4G3F5a 43.93 91 25 10 3 2 2 66.61 21.16 18.2 10.2 6.5 68.33
6 4G3F5b 87.87 174 50 13 5 3 2 115.97 62.12 38.46 13.03 17.23 36.17
7 4G3F5c 58.99 173 31 8 6 2 1 98.13 33.05 23.1 20.9 6.53 17.79
8 4G3F5d 50.85 146 34 10 7 1 1 85.14 25.36 16.02 16.54 4.26 17.79
9 4G3F5f 45.22 120 27 4 1 2 2 78.78 22.31 19.12 3.1 15.87 36.17
10 4G3F5g 64.44 228 53 12 3 1 0 120.35 43.8 19.7 17.47 5.28 0
11 4G3F5h 105.59 454 92 30 11 2 0 222.89 65.09 54.5 18.06 12.49 0
12 4G3F5j 55.07 236 57 10 6 2 1 112.67 44.74 25.54 13.01 7.76 18.38
13 4G3F5k 69.38 259 59 14 6 1 1 147.65 51.87 17.32 9.67 9.37 18.38
14 4G3F5m 58.17 258 64 21 3 2 2 128.01 42.73 32.81 4.2 13.07 22.68
15 4G3F5n 43.47 225 44 13 5 4 0 98.66 37.44 21.42 5.01 11.23 0
16 4G3F5p 112.78 415 97 27 8 1 0 215.55 65.34 56.2 22.31 11.89 0
17 4G3F5s 39.57 91 20 7 1 1 0 47.12 26.95 9.71 1.39 50.53 0
Table 3 : morphometric parameters of sub watershed
Sub Watershed
Area (km2)
Perimeter (Km)
Elevation(m) Basin Length (Km) max Length (km) Total Relief (m) Number of Streams Total Stream Length (Km)
Max Min
4G3F4n 80.59 73.23 337.78 263.82 15.88 27.6 73.96 14 84.03
4G3F4p 39.96 33.66 653.04 293.56 10.66 14.45 359.48 59 118.43
4G3F4q 55.13 35.31 672.74 296.42 12.80 13.63 376.32 98 137.55
4G3F4r 64.86 38.25 665.95 309.58 14.03 11.49 356.37 145 192.9
4G3F5a 43.93 40.16 776.96 349.43 11.25 16.14 427.53 133 191
4G3F5b 87.87 57.99 654.67 345.21 16.67 21.05 309.46 247 282.98
4G3F5d 50.85 33.86 699.62 342.68 12.22 10.95 356.94 199 165.11
4G3F5f 45.22 55.54 919.02 343.44 11.43 16.79 575.58 156 175.35
4G3F5g 64.44 40.04 979.95 496.28 13.98 10.73 483.67 297 206.6
4G3F5h 105.59 43.82 822.03 392.85 18.51 17.26 429.18 589 373.03
4G3F5j 55.07 43.13 739.2 394.3 12.79 13.56 344.9 312 222.1
4G3F5k 69.38 42.17 701.12 395.11 14.58 13.81 306.01 340 254.26
4G3F5m 58.17 33.70 626.28 393.75 13.19 10.22 232.53 350 243.5
4G3F5n 43.47 39.38 744.5 421.87 11.18 12.79 322.63 291 173.76
4G3F5p 112.78 55.67 663.9 421.76 19.21 13.29 242.14 548 371.29
4G3F5s 39.57 31.08 619.96 321.39 10.60 12.59 298.57 120 135.7
Table 4 Analyzed morphometric parameters Morphometric Parameters
Linear Parameters Shape Parameters
Sub Watershed Rb Dd Fs Lg Rt Rc Rf Bs Re Cc
4G3F4n 2.33 1.04 0.17 0.52 0.19 0.19 0.32 3.13 0.64 2.30
4G3F4p 3.25 2.96 1.48 1.48 1.75 0.44 0.35 2.84 0.67 1.50
4G3F4q 3.57 2.49 1.78 1.25 2.78 0.56 0.34 2.97 0.65 1.34
4G3F4r 2.93 2.97 2.24 1.49 3.79 0.56 0.33 3.04 0.65 1.34
4G3F5a 2.39 4.35 3.03 2.17 3.31 0.34 0.35 2.88 0.67 1.71
4G3F5b 2.62 3.22 2.81 1.61 4.26 0.33 0.32 3.16 0.63 1.75
4G3F5c 3.16 3.38 3.75 1.69 5.43 0.45 0.33 3.00 0.65 1.50
4G3F5d 3.42 3.25 3.91 1.62 5.88 0.56 0.34 2.94 0.66 1.34
4G3F5f 3.34 3.88 3.45 1.94 2.81 0.18 0.35 2.89 0.66 2.33
4G3F5g 3.93 3.21 4.61 1.60 7.42 0.50 0.33 3.03 0.65 1.41
4G3F5h 4.06 3.53 5.58 1.77 13.44 0.69 0.31 3.24 0.63 1.20
4G3F5j 3.30 4.03 5.67 2.02 7.23 0.37 0.34 2.97 0.66 1.64
4G3F5k 3.59 3.66 4.90 1.83 8.06 0.49 0.33 3.06 0.64 1.43
4G3F5m 3.32 4.19 6.02 2.09 10.39 0.64 0.33 2.99 0.65 1.25
4G3F5n 3.09 4.00 6.69 2.00 7.39 0.35 0.35 2.88 0.67 1.69
4G3F5p 4.81 3.29 4.86 1.65 9.84 0.46 0.31 3.27 0.62 1.48
4G3F5s 3.85 3.43 3.03 1.71 3.86 0.51 0.35 2.84 0.67 1.39
Table 5 Calculation of compound factor and prioritized ranks Morphometric Parameters
Linear Parameters Shape Parameters
Sub Watershed Rb Dd Fs Lg Rt Rc Rf Bs Re Cc Cp Prioritized Ranks
4G3F4n 17 17 16 17 17 3 2 11 2 13 11.5 14
4G3F4p 11 15 15 15 16 7 5 1 5 8 9.8 13
4G3F4q 6 16 14 16 15 13 4 5 3 3 9.5 12
4G3F4r 14 14 13 14 12 13 3 9 3 3 9.8 13
4G3F5a 16 1 11 1 13 4 5 2 5 11 6.9 7
4G3F5b 15 12 12 12 10 3 2 12 1 12 9.1 11
REFERENCES
1. Agarwal, C.S. (1998). Study of drainage pattern through aerial data in Naugarh area of Varanasidistrict, U.P. J. Indian Soc. Rem. Sens., 24(4):
169-175.
2. Biswas S, Sudhakar S and Desai VR (1999). Prioritization of sub-watersheds based on Morphometric Analysis of Drainage Basin, District
Midnapore, West Bengal. J. Indian Soc. Remote Sensing 27(3):155–166.
3. Horton RE (1932). Drainage basin characteristics. Trans Am Geophys Union, vol 13, pp.350–361.
4. Horton, R.E. (1945). Erosional development of streams and their drainage basins: Hydrophysical approach to quantitative morphology. Geol.
Soc. Am. Bull. 56:275– 370.
5. Miller, V.C. (1953). “ A quantitative geomorphic study of drainage basin characteristics in the Clinch mountain area, Virginia and Tennessee,
Deptt. Of Geology, Columbia University, Contract N6 ONR 271-30, TechinicalReport3, pp. 1-30.
6. Nag, S.K. (1998), “Morphometric analysis using Remote Sensing techniques in the Chakra sub-basin, Purulia District, West Bengal”,
Photonirvachak: J. of Indian Society of Remote Sensing, 26 (1&2): 69-76.
7. Nooka Ratnam, K., Srivastava, Y.K., Venkateswara Rao, V., Amminedu, E. and Murthy, K.S.R. (2005). Check dam positioning by
prioritization of micro-watersheds using SYI model and morphometric analysis - Remote sensing and GIS perspective. J. Indian Soc. Rem. Sens., 33(1): 25-38.
8. Patel DP, Dholakia M (2010) Feasible structural and non-structural measures to minimize effect of flood in lower Tapi basin. Int J WSEAS
Trans Fluid Mech 3(5):104–121.
9. Patel DP, Dholakia M, Naresh N, Srivastava PK (2012) Water harvesting structure positioning by using geo-visualization concept and
prioritization of mini-watersheds through morpho-metric analysis in the lower Tapi basin. J Indian Soc Remote Sens 40(2):299–312. doi: 10.1007/s12524-011-0147-6.
10. Schumm, S.A. (1956). “The evolution of drainage systems and slopes in badlands at Perth Amboy, New Jersy, Bull. Geol. Soc. Amer,Vol. 67,
pp 597-646.
11. Strahler, A.N. (1957). “Quantitative analysis of watershed geomorphology.” Trans.Am. Geophys. Union. 38: 913-920.
12. Strahler, A.N. (1964). Quantitative geomorphology of basins and channel networks. Hand bookOf Applied Hydrology (Ed. Ven Te Chow),
Mcgraw Hill book company, New York, section4II.
4G3F5d 7 11 8 11 8 13 4 4 4 3 7.3 9
4G3F5f 8 5 10 5 14 1 5 3 4 14 6.9 7
4G3F5g 3 13 7 13 5 11 3 8 3 5 7.1 8
4G3F5h 2 7 4 7 1 15 1 13 1 1 5.2 2
4G3F5j 10 3 3 3 7 6 4 5 4 9 5.4 3
4G3F5k 5 6 5 6 4 10 3 10 2 6 5.7 5
4G3F5m 9 2 2 2 2 14 3 6 3 2 4.5 1
4G3F5n 13 4 1 4 6 5 5 2 5 10 5.5 4
4G3F5p 1 10 6 10 3 9 1 14 1 7 6.2 6