20th International Conference on Structural Mechanics in Reactor Technology (SMiRT 20) Espoo, Finland, August 9-14, 2009 SMiRT 20-Division II, Paper 2018
Effect of surface finish and loading conditions on the LCF behaviour of
austenitic stainless steel in PWR environment
Jean Alain Le Duff
a, André Lefrançois
a, Jean Philippe Vernot
b aMaterials, Technology & Chemistry Department, AREVA NP, Plants Sector, Tour AREVA, 92084 Paris La Défense, France, e-mail: [email protected], [email protected]
b
Product and Technology Division, Fluids & Structural Mechanics Department, AREVA NP, Porte Magenta, 71205 Le Creusot, France, e-mail: [email protected]
Keywords: Stainless Steel, PWR environment, Low Cycle Fatigue, surface finish and loading conditions effects
1
ABSTRACT
In February/March 2007, The NRC issued Regulatory Guide "RG1.207" and Chopra from Argonne National Laboratory issued NUREG/CR-6909 that is now applicable in the US for evaluations of PWR environmental effects in fatigue analyses of new reactor components.
In order to assess the conservativeness of the application of this NUREG report, low cycle fatigue (LCF) tests were performed by AREVA NP on austenitic stainless steel specimens in a PWR environment. The selected material exhibits in an air environment a fatigue behavior consistent with the ANL reference S-N "air" mean curve. Tests were performed in PWR environment for two various loading conditions: for fully reverse triangular signal (for comparison purpose with tests performed by other laboratories with same loading conditions) and complex signal, simulating strain variation for actual typical PWR thermal transients. Two surface finish conditions were tested: polished and ground.
The paper presents the comparison of environmental penalty factors (Fen) as observed experimentally with the ANL formulation (considering the strain integral method for complex loading), and the actual fatigue life of the specimen with the fatigue life predicted through the NUREG/CR-6909 application.
Low Cycle Fatigue test results obtained on austenitic stainless steel specimens in PWR environment with triangle waveforms at constant low strain rates gives Fen penalty factors close to those estimated using the ANL formulation (NUREG report 6909). On the contrary, it was observed that constant amplitude LCF test results obtained under complex signal reproducing an actual sequence of a cold and hot thermal shock exhibits significantly lower environmental effects when compared to the Fen penalty factor estimated on the basis of the ANL formulations.
It appears that the application of the NUREG/CR-6909 in conjunction with the Fen model proposed by ANL for austenitic stainless steel provides excessive margins whereas the current ASME or RCC-M approaches seem sufficient to cover significant environmental effect for components.
2
INTRODUCTION
Fatigue life reduction for austenitic stainless steels in elevated temperature water are expressed in terms of Fen penalty factors which are defined as the ratio of fatigue life in air at room temperature (Nair,RT) to that in water at the service temperature (Nwater). These Fen penalty factors are functions of strain rate, temperature and in some case dissolved oxygen concentration.
Objectives of the AREVA NP experimental program launched were to perform LCF tests on laboratory specimens in conditions of loading, environment, and surface finish as close as possible of those of components in operation.
The selected material was an austenitic stainless steel type 304L taken from a plate of about 100 mm thickness supplied by Industeel Le Creusot.
LCF tests were performed in air at 300°C and in PWR environment on polished and on ground specimens for low and high strain amplitudes respectively equal to ± 0.3% and ± 0.6%.
Triangle waveforms or complex signals reproducing strain history versus time as close as possible to actual transients were used for the LCF tests in a PWR environment. Complex signals reproduce an actual sequence of a cold shock followed by a hot thermal shock.
The two following analyses of LCF test results were performed:
- Comparison of environmental penalty factors (Fen = Nair,RT/Nwater ) as observed experimentally with the ANL formulation (considering the strain integral method for complex loading),
- Comparison of the actual fatigue life of the specimen with the fatigue life predicted through the RCC-M application and through the NUREG/CR-6909 application.
3
MATERIALS AND SPECIMENS
The 304L austenitic stainless steel was supplied in the form of a rolled plate. Its dimensions were 590 mm x 450 mm x 103 mm. This thick plate was water quenched and its chemical composition is given in Table 1.
Table 1: Chemical composition of the material
C Mn Si S P Ni Cr Mo Cu
0.025 1.687 0.41 0.0001 0.032 9.12 18.3 0.38 0.217
The conventional yield strength and the ultimate tensile strength of the material at 20°C are respectively 255 MPa and 573 MPa. Elongation (A% 5d) at failure is 64% and the reduction of area (Z %) is 84%.
Cylindrical fatigue test specimens of 9 mm diameters were cut off from the lower and upper parts of the 304L plate at a quarter thickness distance from the lower or upper surfaces, in the rolling direction.
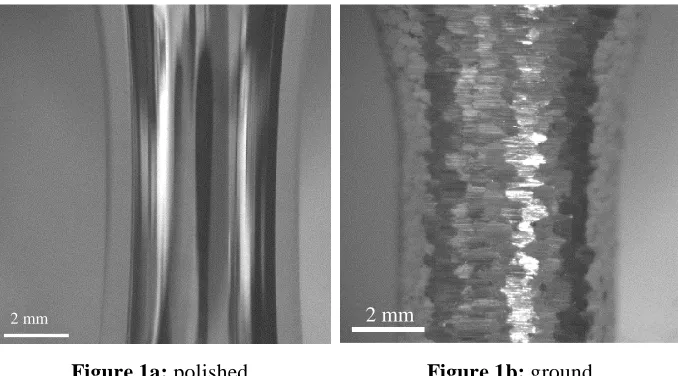
Then, they were machined and mechanically polished or ground. Aspects of polished and ground surfaces are presented Figure 1.
2 mm 2 mm
Figure 1a: polished Figure 1b: ground
rugosité de l'état meulé
-32 -22 -12 -2 8 18 28
0 0,5 1 1,5 2 2,5 3 3,5 4
longueur (mm)
Ground sample
Length (mm)
R
o
u
g
h
n
es
s
(
!
m
)
Figure 2: Roughness profile of a grind sample
It is important to note that the machining operation induces a superficial hardened layer which is not totally removed by the polishing process. The material removal due to polishing does not generally exceed 30 µm in depth. Therefore, a hardened layer of approximately 100 to 150 µm depth is kept at the surface of the polished specimens. The same hardened layer can be observed at the surface of ground specimens.
4
LCF REFERENCE TEST PROGRAM IN AIR AT 300°C
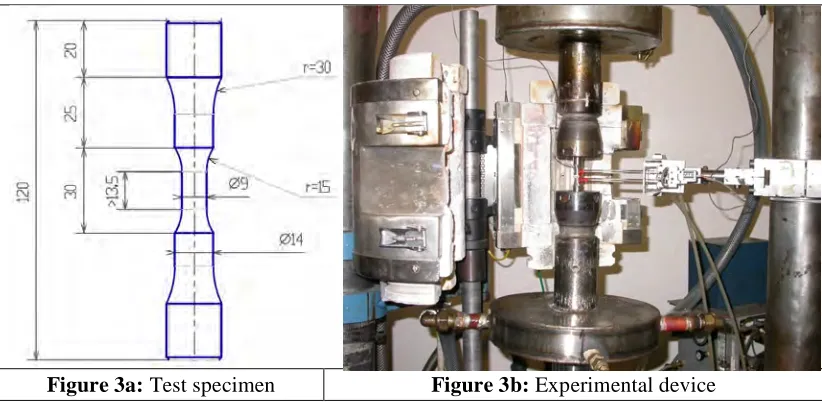
The specimen and experimental device used to perform LCF tests in air at 300°C are shown Figure 3.
Figure 3a: Test specimen Figure 3b: Experimental device
LCF tests were performed in air at 300°C with a strain rate of 0.4 %/s for strain amplitudes of ± 0.2%, ± 0.4% and ± 0.6% on smooth polished and ground specimens.
LCF tests in air are performed at 300°C under strain control by using an extensometer located outside the furnace and two ceramic rods located inside the furnace between the test specimen and the MTS extensometer. The distance between the two ceramic rods in contact with the cylindrical useful part of the specimen is equal to 9.7 mm.
4.1 LCF tests in air at 300°C on polished specimens
Table 2 gives LCF reference test results obtained in air at 300°C for the three levels of strain amplitudes of ± 0.2%, ± 0.4% and ± 0.6%.
Strain amplitude ∆ t/2 (%)
Stress Amplitude at Nr/2 (MPa)
N25 (Nb of cycles for
25% reduction of max)
Nr (number of cycles at fracture)
± 0.187 170 83 500 100 015
± 0.38 194 11 325 12 296
± 0.55 238 6000 6 798
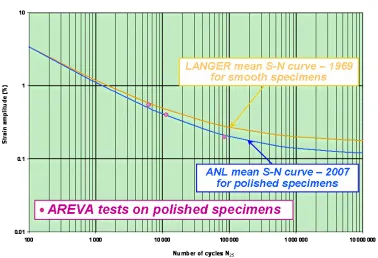
Figure 4 shows a comparison of previous LCF test results, obtained in air at 300°C on polished specimens, with the following best fit mean S-N curves proposed by Langer (cf. criteria of ASME Section III (1969) and by ANL (cf. NUREG/CR-6909, February 2007):
ln (N) = 6.954 – 2.0 ln ( a – 0.167) (LANGER, 1969) (1)
ln (N) = 6.891 – 1.92 ln ( a – 0.112) (NUREG/CR-6909) (2)
Figure 4: Test results in air at 300°C for polished specimens
Figure 4 shows that reference air tests performed by AREVA NP fit well with the new "reference Air curve" proposed by ANL for austenitic stainless steel.
The best fit mean S-N curves established by Langer in the Criteria of ASME (1969) and by Chopra (2007) can also be defined by the following expressions:
a = 32.365 N - 0.5 + 0.167 (Criteria of ASME, LANGER, 1969) (3)
a = 36.2 N - 0.52 + 0.112 (Chopra, NUREG/CR-6909) (4)
a is the applied strain amplitude (%)
Figure 5: Cyclic stress strain test results for polished specimens
The cyclic stress strain curve reported in Figure 5 was developed by leax (1999) from Bettis Atomic Power Laboratory by using about 300 data points obtained on 304 austenitic stainless steels at temperatures ranging from 22°C to 427°C. These data points were fitted to the following equation using the least squares method:
∆ /2 = A + B x a (5)
With A = 136.3 and B = 199.24 for a temperature of 300°C.
The cyclic stress-strain curve obtained is valid for stresses above the proportional limit. For stresses below the proportional limit, the stress amplitude is simply the modulus times the strain amplitude. The cyclic stress strain results obtained for ∆/ 2 close to ± 0.2%, ± 0.4% or ± 0.6% on polished specimens at mid-life fit well with the best fit mean curve proposed by Leax (1999) from Bettis Atomic Power Laboratory.
4.2 LCF tests in air at 300°C on ground specimens
Table 3 gives LCF reference test results obtained in air at 300°C on ground specimens for three levels of strain amplitudes close to ± 0.2%, ± 0.4% and ± 0.6%.
Strain Amplitude ∆ t/2 (%)
Stress Amplitude at Nr/2 (MPa)
N25 (Number of cycles for 25% reduction of
max)
Nr (number of cycles at fracture)
± 0.19 171 48 717 55 000
± 0.19 173 36 552 37 469
± 0.37 193.5 9 464 10 314
± 0.56 226.5 3 891 4 667
Table 3: Test results in air at 300°C on ground specimens
The Rt roughness values measured longitudinally on two opposite sides of each specimen
vary from 38 to ~ 45
µ
m.
Table 4 shows that, for higher strain amplitudes close to ± 0.4% and ± 0.6%, surface finish
effects can be covered by a factor of ~1.3 instead of a factor
of ~ 2 for a strain amplitude of ± 0.2%.Table 4: Effect of surface roughness on fatigue life
Strain Amplitude
∆ t/2 (%)
Roughness Rt
(µm)
Ratio of fatigue life N25
(N polished/N ground)
± 0.19 38.6 1.71
± 0.19 38.9 2.3
± 0.37 40.3 1.19
± 0.56 43.5 1.54
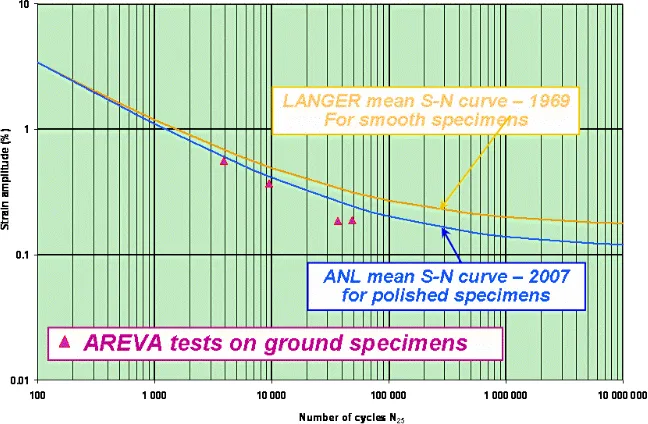
Figure 6 shows a comparison of the previous LCF test results, obtained in air at 300°C on ground specimens, with the best fit mean S-N curves proposed by Langer in the criteria of ASME Section III (1969) and by Chopra from ANL (cf. NUREG/CR-6909).
Figure 6: Test results in air at 300°C for ground specimens
Concerning the cyclic stress strain behaviour of the ground specimens, this cyclic behaviour is close to the cyclic stress strain behaviour of polished specimens.
Thus, there appears to be no significant effect of surface conditions on the LCF cyclic stress-strain behaviour of 304 L austenitic stainless steel. However, compared to the cyclic behaviour of polished specimens, an increase of the maximum cyclic stress is observed at the beginning of LCF tests for ground samples.
5 LCF TEST PROGRAM IN PWR ENVIRONMENT
The objectives of the PWR environment test program were to perform, in high temperature water, LCF tests on laboratory specimens in conditions of loading conditions, environment and surface finish as close as possible of those of PWR components in operation.
- Fully-reversed triangular signal (for comparison purposes with tests performed by other laboratories with same loading conditions),
- Complex signals simulating strain variations for actual typical PWR thermal transients.
Development of test equipment and procedures for performing strain-controlled LCF tests in PWR environment at high temperature water was achieved by the AREVA NP Technical Center of Le Creusot and is described by Le Duff et Al (2008).
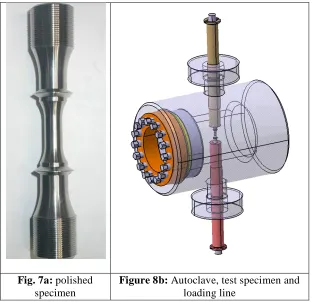
Figure 7 shows the laboratory specimen and a schematic view of the autoclave used to perform the LCF tests in a PWR environment. In order to avoid local damage on the calibrated zone of the LCF specimens, the extensometer used to perform the LCF tests under strain control in the autoclaves was attached on specimen shoulders.
Figure 7a shows the presence of the specimen shoulders used to attach the extensometer. This extensometer is located in the autoclave and is mounted on two arms attached on the specimen shoulders.
Fig. 7a: polished specimen
Figure 8b: Autoclave, test specimen and loading line
Figure 7b shows the localization of the LCF test specimen in the autoclave and the position of the loading lines used for application of strain amplitudes. Generation of triangular or complex signals reproducing strain histories versus time as close as possible to actual transients were performed under strain controlled fatigue tests in the autoclave.
Figure 8 gives an example of a calculated typical strain history of cold and hot thermal shocks (e.g., Safety Injection Safety (SIS) typical transient) with one part of the cold shock response deleted.
Figure 8: Typical SIS transient and strain history of a cold shock followed by a hot thermal shock
The transient given Figure 8 is representative of the most sensitive transient affecting the primary piping in terms of fatigue damage. For this type of complex loading signal, the Fen penalty factor, evaluated using ANL formulations proposed by Chopra (2007) and the strain-based integral model, is equal to 5.9.
This value can be considered to be bounding for most stainless steel components. To be sure of the accuracy of the strain amplitude and strain rates applied on the calibrated zone of the LCF specimen in the autoclave, preliminary LCF calibration tests were performed and are described by Le Duff et Al (2008).
A numerical modelling of the LCF behaviour of the specimen was also performed by Courtin et Al (2008) using a non-linear kinematics hardening model to validate experimental calibrations of strain amplitudes applied on the calibrated zone.
6
LCF TEST RESULTS IN PWR ENVIRONMENT
A first set of LCF tests were performed under strain control in a PWR environment on polished and ground cylindrical specimens under fully reverse loading with triangular waveforms at a strain amplitude of ± 0.6 % and a strain rate of 0.01 %/s.
The first objective of these tests performed on polished specimens was to compare, for very simple loading conditions, the predictions of the ANL model with experimental results.
Another objective was to evaluate, for the same simple loading conditions, the effect of surface finish and to perform LCF tests on ground LCF specimens in a PWR environment.
The last objective was to evaluate, for LCF tests performed under strain control with complex signals as close as possible of those of actual thermal transients, the relevance of the strain-based integral model proposed by Chopra et Al (2007) for evaluation of Fen penalty factors.
In summary, the following LCF tests were performed in a PWR environment:
- Polished specimens with triangular signal (' = 0.01 %/s),
- Polished specimens with a SIS complex signal of 840s,
- Ground specimens with triangular signal (' = 0.01 %/s),
- Ground specimens with a SIS complex signal of 840s.
Two LCF tests were performed for each LCF test condition for strain amplitudes of ± 0.3 % and 0.6 %.
In the case of LCF tests performed with complex signals, experimental Fen penalty factors of 2.5 and 4.7 were respectively obtained for polished and ground specimens. The penalty factor of 2.5 is much lower than the calculated Fen factor of 5.9 (more than 2) for polished specimens.
Surface finish effects associated with environmental conditions given by the ratio of Npolished/Nground seems to be more significant for a complex signal. However, these cumulated effects of environment and surface finish gave a much lower experimental penalty factor that the one calculated using the NUREG/CR-6909 approach proposed by Chopra et Al (2007).
In this case, the total Fen is equal to Fen NUREG (5.9) x 2 or 3.5 where 2 or 3.5 are the values recommended by Chopra et Al (2007) to take into account the surface finish effects.
For a ± 0.3% strain amplitude, LCF test results obtained in a PWR environment gave, excepted for one LCF test, experimental Fen penalty factors lower than the calculated Fen penalty factor of 5.1 for tests performed on polished and ground specimens loaded with triangular signals and a strain rate of 0.01 %/s.
In the case of LCF tests performed with complex signals, experimental Fen penalty factors are much lower than the total theoretical Fen penalty factors (respectively, 5.9 for polished specimens and 12 to 21 calculated for ground specimens).
For ground specimens and for a representative loading signal, the over-conservatism of the theoretical minimum cumulative effects (Fen x surface finish effect given by Chopra et Al in the NUREG/CR 6909) can approach a factor of 4 when compared to the experimental penalty factors.
7
DISCUSSION ON TEST RESULTS REGARDING DESIGN CURVES
A comparison of experimental results was performed with the ANL best fit mean curve in air proposed by Chopra et Al (2007), the current ASME C Design curve and the new ANL Design curve divided by a maximum penalty factor of 5.5.
This last penalty factor of 5.5 is equal to the mean value of 5.1 corresponding to a triangular signal with ' = 0.01%/s and 5.9 calculated for a complex signal representative of an actual transient strain history.
For a ± 0.6% strain amplitude, the comparison between current RCC-M evaluations and experimental results shows that margins are of 2.2 to 4.5, while the margins between the new design methodology proposed by Chopra et Al (2007) in the NUREG/CR-6909 report and experimental results vary, for complex and representative transients, particularly for ground and for polished components, from ~ 12 to approximately ~ 28.
For a ± 0.3% strain amplitude, the comparison between current RCC-M evaluations and experimental results shows that margins are close to 2, except for one LCF test performed on a ground specimen with a triangular loading signal.
The margins between the new design methodology proposed by Chopra et Al from ANL (NUREG/CR-6909) and experimental results vary, for complex or representative transients, from ~ 8 to approximately 22
8
CONCLUSION
Considering the representative tests performed in terms of loading conditions, surface finish and PWR environment, other reserve factors that should not exceed 3.2 are needed to cover components behaviour (2.5 for material variability and 1.3 for size effects).
Such values are quite similar to those provided by the current RCC-M evaluation (2 to 4.5 for polished surfaces and about 2 for ground surface conditions). In the case of ground components, it is underlined in the NUREG/CR-6909 report, that a size effect factor of 1.1 (conservative factor) can be considered.
An alternative method to NUREG/CR-6909 could be to perform conventional analyses and to compare, for the most sensitive zones of reactor components, the environmental effects to those that are considered "covered" by the design curves.
Acknowledgements. The present test program was performed in the AREVA NP Technical Center of Le Creusot by MM. D. MARTIN, D. BOSSU and D. DOUA. The authors express their appreciation for their valuable contribution in this test program.
Symbols
Fen Environmental fatigue correction factor (Nair,RT/Nwater)
a Strain Amplitude (%)
REFERENCES
American Society of Mechanical Engineers, 1969. Criteria of the ASME Boiler and Pressure Vessel Code for Design by Analysis in Sections III and VIII, Division 2.
Courtin S., De Sansal C., Gilles Ph. and Le Duff J.A., May 20-22, 2008. Numerical simulation of pressurized water reactor environment low cycle fatigue tests", 12th International Conference Spring Meeting, PARIS
Chopra O. and Shack W. J., February 2007. Effect of LWR Environments on the Fatigue Life of Reactor Materials. Final Report. NUREG/CR-6909 – ANL-06/08, Argonne National Laboratory
Leax T. R., 1999. Statistical models of mean stress and water environment for stainless steels. ASME PVP-Vol. 386, P. 229-239
Le Duff J. A., Lefrançois A. and Vernot J. Ph., July 27-31, 2008. Effects of Surface Finish and Loading Conditions on the Low Cycle Fatigue Behavior of Austenitic Stainless Steel in PWR environment. PVP2008-61894, Chicago, Illinois, USA