PROCTOR, CYNTHIA LAMBERT. Effect of fertilizer nitrogen rate and time of application on growth and performance of six herbaceous perennials and soil solution nitrogen
concentration in a simulated landscape. (Under the direction of Stuart L. Warren)
Herbaceous perennials are planted worldwide in public gardens, and commercial and home landscapes. Little research based information exists on response of herbaceous perennials to fertilizer nitrogen (FN) rate and timing and the potential for loss of applied N via leaching. Therefore, we constructed simulated landscapes and installed canna lily (Canna L.
'President'), coreopsis (Coreopsis verticillata L. 'Moonbeam' ), purple coneflower (Echinacea purpurea L. 'Magnus'), iris (Iris siberica L. 'Caesar’s Brother'), switchgrass (Panicum
Plant response to treatments varied in 2002 and 2003. Our results indicated that despite statistical significance differences, many differences were small and FN treatments had little impact on the growth and ornamental qualities of these species. However, applying no N may not advisable, as some perennials species did benefit from an FN application during a specific time. Soil N concentrations remained above 10 mg•L-1 for 110 days, 62 days, 52 days, and 192 days when applied during January/February, April/May, June/July, 2002 and September/October in 2001 respectively. In 2003, soil N concentrations from FN rates of 7 g•m-2 N (1.5 lbs•1000 ft-2) and 14 g•m-2 N (3.0 lbs•1000 ft-2) applied in January/February, June/July, April/May and September/October remained below 10 mg•L-1 until the end of the study (Oct. 14, 2003). Nitrogen concentrations increased to 19 mg•L-1, 38 mg•L-1, and 21 mg•L-1, after 28 g•m-2 N (6.0 lbs•1000 ft-2) was applied in January/February, April/May, and June/July, respectively. To cover the needs of a wide variety of perennial species that
usually exists in one landscape as well as minimize N concentrations in the soil solutions, we recommend a low to moderate rate of FN (5 g•m-2 to 15 g•m-2 ) be applied in split
Effect of fertilizer nitrogen rate and time of application on growth and performance of
six herbaceous perennials and soil solution nitrogen concentration in a simulated
landscape
by
CYNTHIA LAMBERT PROCTOR
A thesis submitted to the Graduate Faculty of North Carolina State University
in partial fulfillment of the requirements for the Degree of Master of Science
HORTICULTURAL SCIENCE
Raleigh 2005
APPROVED BY:
_____________________________________ ___________________________________ Robert L. Mikkelsen Dennis J. Werner
___________________________ Stuart L. Warren
Biography
Cynthia Faye Lambert was born in St. Louis, MO to Martha Faye and J.D. Wooster Lambert Jr. on October 29, 1966. Cindy stayed in St. Louis with her mother after her parents divorced in 1972. She attended local schools in St. Louis and became interested in sports, especially volleyball and basketball in high school. After high school graduation she moved to Charlotte, NC to attend University of North Carolina in Charlotte and to spend more time with her father and his family. Cindy has a total of 9 brothers and sisters, three half brothers, two half sister, two step brothers, and two stepsisters.
Cindy received an undergraduate degree in Business Administration with a
concentration in Finance in 1991. Her love for plants began when she started working part time for a small landscape firm, Brenda Cathey Landscape Design, doing simple job tasks like pine needling and annual installations while still in school. Cindy loved returning to job sites where she previously had helped install landscapes, prune plant material, or plant little annual flowers. It wasn’t long until she was promoted to foreman of several crews. After graduation, she was asked to become a partner in charge of establishing new commercial and residential clientele, and improving current operations. Unlike other landscape companies, Brenda Cathey Landscape Design did not maintain any turf but focused on pruning, renovation, plant installation, and high customer service.
skills. She realized however, she loved training and coaching the staff in doing their job description. However, she wasn’t sure how to match horticulture and training.
In 1998, Cindy decided to attend NC State to go back to school to explore more about what the horticulture industry had to offer personally and professionally. During her
undergraduate degree, Cindy involved herself as much as possible in the Horticulture Club and ALCA type activities. In addition, she traveled to three department chaperoned European garden tours to England, Wales, Scotland, and France, and one domestic garden tour that visit explore gardens in Virginia, Pennsylvania, and Delaware. In an attempt to investigate teaching, Cindy served as an assistant to a Garden Center Management class and two Plant Identification classes. Furthermore, she did a small research project to sense what graduate school might be like.
Acknowledgements
I would like to thank my committee members, Drs. Stuart Warren, Dennis Werner, and Rob Mikkelsen for serving on my committee and for all their advice and instruction throughout my MS Program. I enjoyed working with each and every one of you. I would like to especially thank Stuart Warren for his incredible patience and guidance throughout the pursuit of this degree. I have gained many professional skills from you; research, teaching, and time management, although I doubt that we ever stop learning how to master time management. You truly are a great leader and an asset to the horticulture industry.
To fellow graduate students, I loved getting to know all of you and treasure our friendships. To my dear friend Denny Crowe; thank-you for pushing me to achieve greater things in life, personally and professionally. I will always treasure our friendship and I look forward to breaking more ornaments in the future.
Much appreciation for all the help I received from our research group. I particularly value the camaraderie among us, especially in trying to figure out our research and class woes. A very special thanks to William Reece for all of his help throughout this experiment. I enjoyed our conversations, and all the laughs we had during this experiment. I would also like to thank Peggy Longmire for the technical assistance in the Soil Science department. I could have never used the equipment in the lab without your help and it would have never been as much fun without you.
Table of Contents
Page
List of Tables...vii
List of Figures...viii
General Introduction...1
Literature Cited...12
Chapter 1. Effect of fertilizer nitrogen rate and time of application on growth and performance of six herbaceous perennials in a simulated landscape...19
Abstract...20
Significance to the Nursery Industry...23
Introduction...24
Material and Methods...27
Results and Discussion...32
Literature Cited...51
Chapter 2. Influence of fertilizer nitrogen rate and time of application on soil solution nitrogen concentration in a simulated landscape...92
Abstract...93
Significance to the Nursery Industry...94
Introduction...95
Material and Methods...98
Results and Discussion...102
List of Tables
Page Chapter 1
Table 1. Effects of FN applied at various times on height of Canna ‘Mr.
President’, 2002………...58 Table 2. Effect of FN timing on visual evaluations of Coreopsis
verticillata ‘Moonbeam’, 2003………. ...59
Table 3. Effect on FN timing on growth index (GI) of Coreopsis verticillata
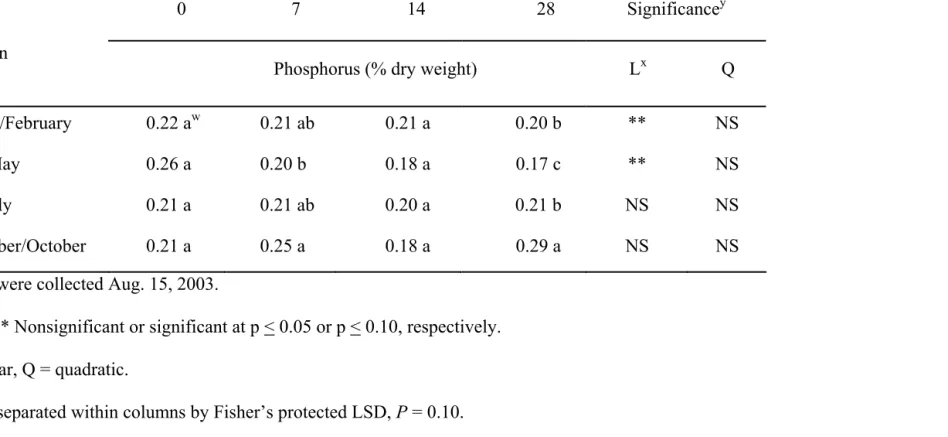
‘Moonbeam’, 2003………...60 Table 4. Effect of FN rate applied at various times on foliar phosphorus
concentrations of Coreopsis verticillata ‘Moonbeam’, 2003...61 Table 5. Effect of FN timing on visual evaluation for
Iris siberica ‘Caesar’s Brother’,2002...62 Table 6. Effect of FN timing on flower color of Sedum ‘Herbstfreude’,
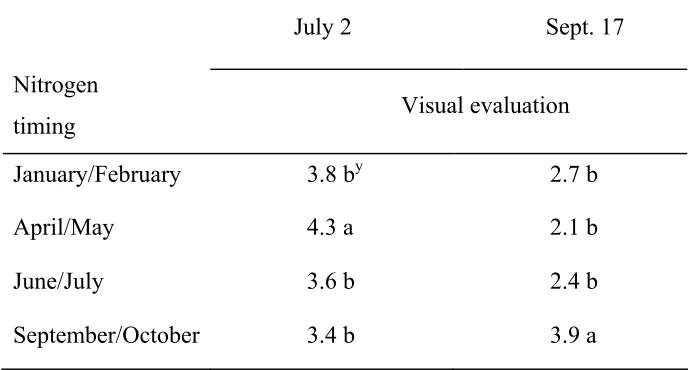
2003...63 Table 7. Effect of FN timing on visual evaluations on July 2 and Sept. 17 of
Sedum ‘Herbstfreude’, 2003...64 Table 8. Effect of FN timing on growth index (GI) of Sedum ‘Herbstfreude’
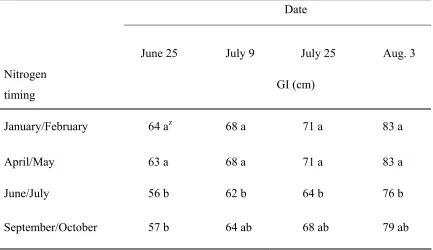
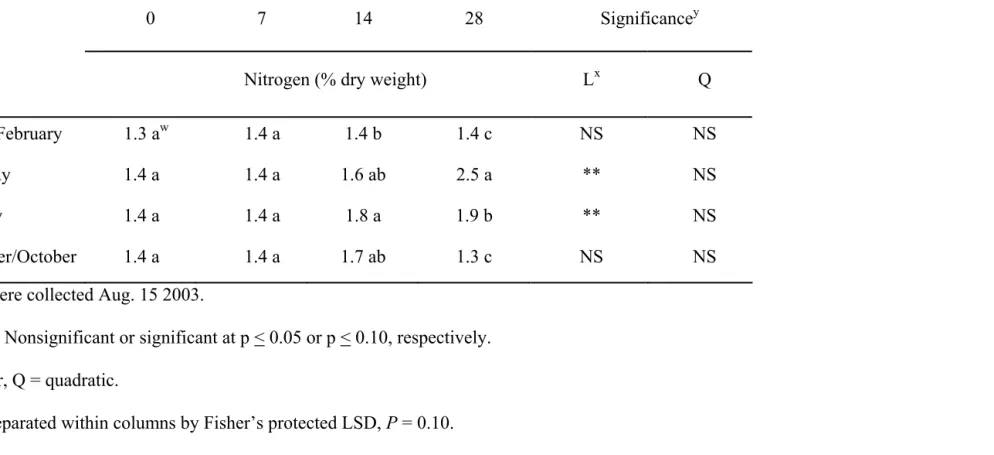
at various dates, 2003...65 Table 9. Effect of FN rates applied at various times on foliar N
concentration of Sedum ‘Herbstfreude’, 2003...66 Table 10.Effect of FN timing on foliar nutrient concentrations of Sedum
‘Herbstfreude’, 2003...67 Chapter 2
Table 1. Effect of FN timing on total N (NH4-N + NO3-N) concentration
found in soil solution at days after fertilization (DAF) 38 cm...108 Table 2. Effect of N timing on total N (NH4-N + NO3-N) found in
List of Figures
Page Chapter 1
Figure 1. Placement of perennials planted in a 2.4 x 3.4 m (8 x 11 ft.) plot to simulate a landscape (A) Canna ‘Mr. President’, (B) Panicum
virgatum ‘Shenandoah’, (C) Coreopsis verticillata ‘Moonbeam’, (D) Salvia x sylvestris ’East Friesland’, (E) Iris siberica ‘Caesar’s Brother’,(F) Sedum ‘Herbstfreude’, (G) Echinacea purpurea
‘Magnus’. Plants were installed Oct. 2000... …...68 Figure 2. Effect of FN rate applied in April/May on Canna ‘Mr. President’
flower number, June 1, 2002. Each symbol is based on 4 observations and vertical =± SE...69 Figure 3. Effect of FN rate on (A) nitrogen (N) and (B) manganese (Mn)
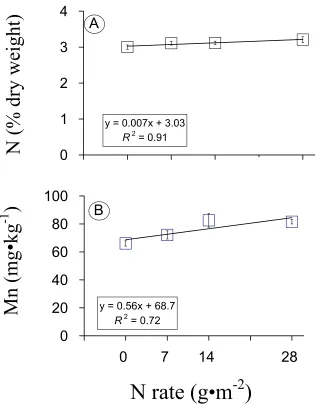
concentrations in leaves collected Aug. 15, 2003, from Canna ‘ Mr. President’. Each symbol is based on 16 observations and vertical bars = ±SE...70 Figure 4. Effect of FN rate applied in (A) January/February and (B) June/July
on potassium (K) concentrations. Effect of FN rate applied in (C) June/July and (D) September/October on magnesium (Mg) concentrations. Nutrient concentrations are from Canna ‘Mr. President’leaves collected Aug. 15, 2003.Each symbol is
based on four observations and vertical bars = ±SE...71 Figure 5. Effect of FN rate applied (A) January/February, (B) June/July
and (C) September/October on phosphorus concentrations in leaves from Canna ‘Mr. President’ collected Aug. 15, 2003. Each symbol is based on four observations and vertical bars = ±SE...72 Figure 6. Effect of FN rate on flower number of Coreopsis verticillata
'Moonbeam' on June 24 and July 1, 2003. Each symbol is based on 16 observations and vertical bars = ±SE...73 Figure 7. Effect of FN rate on visual evaluations of Coreopsis verticillata
'Moonbeam' on (A) June 1, June 14, and (B) July 2, 2003. Each
symbol is based on 16 observations and vertical bars = ±SE...74 Figure 8. Effect of FN on GI (growth index) of Coreopsisverticillata
'Moonbeam' on (A) May 19 and June 1, (B) June 25 and July 9, (C) July 24 and Aug. 3, 2003. Each symbol is based on 16 observations and vertical bars = ±SE...75 Figure 9. Effect of FN rate on top dry weight of Coreopsisverticillata
List of Figures cont.
Figure 10. Effect of FN rate on foliar manganese (Mn) concentrations in leaves collected Aug. 15, 2003, from Coreopsis verticillata 'Moonbeam'. Each symbol is based on 16 observations and vertical bars =
±SE...77 Figure 11. Effect of FN rate applied in September/October on number of
flowers of Iris siberica ‘Caesar’s Brother’, (A) Apr. 26 and (B) Apr. 27, 2002. Each symbol is based on four observations and
vertical bars = ±SE...78 Figure 12. Effect of FN rate on top dry weight (g) of Iris siberica ‘Caesar’s
Brother’, 2003. Each symbol is based on 16 observations and
vertical bars = ±SE...79 Figure 13. Effect of FN rate on (A) phosphorus (P), (B) potassium (K), (C)
sulfur (S), and (D) boron (B) concentrations in leaves collected Aug. 15, 2003, from Iris siberica ‘Caesar’s Brother’. Each symbol is based on 16 observations and vertical bars = ±SE...80 Figure 14. Effect of FN rate applied in January/February on height of
Panicum virgatum ‘Shenandoah’ on (A) June 25 and (B) July 25, 2003. Each symbol is based on 16 observations and vertical
bars = ±SE...81 Figure 15. Effect of FN on (A) iron (Fe) and zinc (Zn) concentrations in leaves
collected Aug. 15, 2003 from Panicum virgatum 'Shenandoah'. Each symbol is based on 16 observations and vertical bars = ±SE...82 Figure 16. Effect of FN rate applied in (A) April/May, (B) June/July, and (C)
September/October on manganese concentrations (Mn) in leaves collected Aug. 15, 2003 from Panicum virgatum ‘Shenandoah’. Each symbol is based on 16 observations and vertical bars = ±SE...83 Figure 17. Effect of FN rate on (A) magnesium (Mg), (B) potassium (K),
(C) manganese (Mn), and D) boron (B) concentrations in leaves collected Aug. 15, 2003, from Sedum ‘Herbstfreude’. Each symbol is based on 16 observations and vertical bars =±SE...84
Chapter 2
Figure 1. Placement of perennials planted in a 2.4 x 3.4 m (8 x 11 ft.) plot to simulate a landscape (A) Canna ‘Mr. President’, (B) Panicum virgatum ‘Shenandoah’, (C) Coreopsis verticillata ‘Moonbeam’,
(D) Salvia x sylvestris ’East Friesland’, (E) Iris siberica ‘Caesar’s Brother’, (F) Sedum ‘Herbstfreude’, (G) Echinacea purpurea
List of Figures cont.
Figure 2. Soil solution total-N (NH4-N + NO3-N) concentrations found 38 cm (15 inch) below the soil surface, 2002-2003 when 7, 14, and 28 g N•m-2 (0, 1.5, 3, and 6 lbs•1000 ft-2) was applied (A) January/February (B) April/May (C) June/July or (D)
September/October. The soil N concentrations in the 0 g•m-2 N treatment were subtracted from the 7, 14, and 28 g•m-2 N rates.
Treatments were initiated on Sept. 15, 2001 (not shown) ...112 Figure 3. Monthly precipitation (mm) recorded in 2002 and 2003...113 Figure 4. Effect of FN rate on soil solution total-N (NH4-N + NO3-N)
concentration found A) 0-15, B) 31-40, C) 61-80 D) 92-101, E) 123-140 and F) 171-182 days after fertilization 38 cm (15 inch) below the soil surface, 2002. Each symbol is based on 16
observations and vertical bars = ±S.E...114 Figure 5. Effect of FN rate on soil solution total-N (NH4-N + NO3-N)
General Introduction
The overall objective of these studies was to establish the fertilizer nitrogen (FN)
requirements of herbaceous perennials in a landscape setting and determine its effects on
nitrogen losses. This objective was addressed in two main areas:
I. Nitrogen requirement of perennials
II. The effects of fertilizer nitrogen on nitrogen leaching in the landscape
I. Nitrogen requirement of perennials
Nitrogen (N) is the fertilizer element required in the greatest quantity by most plants
to maximize yields, maintain health, and promote growth. Current fertilizer
recommendations for herbaceous perennials vary dramatically regarding nitrogen rate and
timing (Brown, 1996; Evans, 2000; Kessler, 2002; Relf and Ball, 2002; Thomas, 1999). One
of the myths surrounding herbaceous perennials is that they do not require fertility
management. The uncertainty is not surprising since existing research is conflicting. For
example, a study comparing several herbaceous perennial species reported that Achillea and
Gypsophila plants did not respond to FN when grown in a Windsor sandy loam with high P
and K levels while Heuchera sanguinea 'Splendens' used in the same study did require high
rates of FN [35.3 g•m-2 N (7.2 lbs•1000 ft-2)] to maximize top dry weights (Duarte, 1986).
Field-grown purple coneflower (Echinacea purpurea L.) grown as an annual crop needed FN
rates up to 147 g•m-2 (30 lbs•1000 ft-2) to maximize height and top dry weight (Shalaby et al.,
1997). In addition, 41 g•m-2 N (8.5 lbs•1000 ft-2) were needed to maximize biomass of
field-grown switchgrass (Panicum virgatum L.) (Muir et al., 2001). Container production studies
results bear little resemblance to the landscape (Cabrera, 2003; Dubois et al., 2000; Perry and
Adam, 1990).
Varying responses to FN rates occur in perennial species such as woody ornamentals
and fruit bearing plants. Recent studies with red raspberry (Rubus idaeus L. ‘Meeker’)
(Rempel et al., 2004), fraser fir [Abies fraseri (Pursh) Poir] (Hinesley and Snelling, 2000),
and river red gum (Eucalyptus camaldulensis) (Cockerham, 2004) have shown these species
to have a low FN requirement whereas, southern magnolia (Magnolia grandiflora L.)
required 4.4 g•m-2 N (~ 1.0 lbs N•1000 ft2 )] applied monthly from February to October to
maximize height over a 4-year period (Gilman et al., 2000).
. Other perennial studies have demonstrated that response to FN varied with time of
application. Lovatt (2001) examined the response of ‘Hass’ avocado (Persea americana
Mill. ‘Hass’) after increasing the FN rate at two significant phenological timings over four
years. The FN rate of 5.6 g•m-2 (1.2 lbs •1000 ft-2) applied in mid-November (flower bud
initiation) and 5.6 g•m-2 (1.2 lbs •1000 ft-2) applied in mid-April (flower anthesis and
vegetative shoot flush) significantly increased fruit weight and number of large sized fruit
compared to 2.8 g•m-2 (0.6 lbs •1000 ft-2) applied in January, February, April, June, July, and
November. However, FN timing did not influence tree performance of mature (~ 4 years)
peach [Prubus persica (L.) Batsch ‘O’ Henry’] trees. No significant differences existed when
fruit growth, yield, or vegetative growth were compared between fall or spring applications
of 20 g•m-2 (4 lbs •1000 ft-2) of FN (Niederholzer et al., 2001). Incorrect timings of FN
applications may increase seed development and vegetative growth thereby reducing
applications of FN to strawberry (Fragaria x ananassa) increased foliage size as well as
runner production while decreasing the expected harvest index. Furthermore, excess FN may
encourage tender plant growth that may be more susceptible to plant diseases and lodging.
Fall FN application may prevent perennials from “hardening off” before cold weather occurs
(Brady and Weil, 1999).
Several herbaceous perennial studies monitored N uptake patterns during growth.
Hood et al. (1993) reported uptake of nutrients by snapdragon (Antirrhinum majus L.) grown
hydroponically was highest from visible bud to anthesis and suggested that supplemental
fertilizer during this stage of growth would be beneficial. Similarly, rapid uptake of N by
chrysanthemum (Dendranthema x grandiflorum L.) grown hydroponicallyfrom cuttings was
greatest 40 to 50 days after root formation up to flower bud formation (King et al., 1995). In
contrast, Kaximirova (1994) reported that nutrient uptake by carnation was greatest during
full flower and seed development, however, N uptake was high throughout growth,
suggesting available N throughout the plant’s life cycle was necessary for maximum growth
and flowering. Most herbaceous perennial gardens include various species that will flower
throughout the year thus, these gardens may vary in their N absorption. Mengal and Kirby
(1981) report that most plants require more N during the vegetative stage whereas, in the
generative phase N uptake is low and the retranslocation of organic N is high. Similarly
Huett (1996) stated that efficient N uptake occurs during periods of active growth and
depends on active photosynthesis.
Differences in N uptake patterns and N reserves also appear in woody perennial
for N and can be useful in timing N fertilization for greatest N-use (Weinbaum et al., 1992).
In grapevines, FN absorption was most rapid at flower initiation compared to budbreak and
N demand of stems and leaves were met by current season adsorption when N was applied
between bloom and veraison (Hanson and Howell, 1995; Williams, 1991). In addition, after
fruit harvest to leaf fall, trunks and roots of grapevines accumulated N reserves that
supported early growth during the following year (Conradie, 1991). Similarly, summer N
fertilization of apple trees (Malus x domestica Borkh.) sustained the following year’s spring
vegetative growth (Toselli et al., 2000). Acuna-Maldonado et al. (2003) reported that pecan
(Carya illinoinensis Wangenh. C. Koch) N absorption was greatest between budbreak and
the end of shoot expansion. They also reported, however, that substantial N was absorbed
between leaf fall and budbreak. Rempel et al. (2004) stated that 24% to 37% of the N in new
growth of red raspberry came from FN. Thus, the remaining N (63% to 76%) was derived
from soil mineralization and plant reserves. Other N uptake and N storage studies found that
most N in new growth was from remobilization of N stored in other plant parts (Ledgard and
Smith, 1992; Sanchez et al., 1991; Toselli et al., 2000). Unlike woody perennials, the root
system is the only portion of herbaceous plants that remains during the dormant season to
store N reserves for vegetative growth the next spring. Therefore, if herbaceous perennials
require N reserves for spring growth, N is most likely stored in the root systems until
retranslocation during vegetative growth.
In addition to growth, FN rate and time of application can affect ornamental quality.
A turfgrass mixture of perennial ryegrass (Lolium perenne L.), Kentucky bluegrass (Poa
(Festuca rubra var commutate Gaud) grown in Turkey had more uniform color and sustained
turf quality throughout the growing season (April to September) when 5 g•m-2 (1 lb•1000 ft-2)
N was applied in April and May compared to 15 g•m-2 (3.3 lbs•1000 ft-2) applied in April and
September (Oral and Acikgoz, 2001). Rate of growth and top growth, however, were more
uniform when 5 g•m-2 N (1.0 lb•1000 ft-2) or 10 g•m-2 (2.0 lb•1000 ft-2) of FN were applied in
April, June, and August.
Obviously fertility management across all perennials is a complex task and protocols
differ depending on the species and whether the plant is grown to produce yields or preserve
ornamental qualities. However, inconsistent FN recommendations may result in over
application of N for fear of developing a nutrient deficient or poor performing plant and
therefore may lead to excess N in groundwater. Furthermore, excess FN may lead to a high
shoot:root ratio (Bowman, 2003). More top growth may increase a plants demand for water.
Examining N requirements of perennials alone is not enough to develop a fertility
management plan. Current fertility management recommendations need to balance plant
performance against reducing potential N losses.
II. The effects of fertilizer nitrogen on leaching in the landscape
Excessive N loading to watersheds promotes changes in harmful algal blooms,
hypoxia, anoxia, and fish kills. Nitrate leaching comes from several non-point sources such
as agricultural and urban runoff, septic fields, atmospheric deposited N, and municipal and
industrial discharges. Nitrate leaching is the largest source of degradation to surface water
quality in the U.S. and as a result, the United States Environmental Protection Agency has
throughout the U.S. (U.S. Environmental Protection Agency, 2000). Although the underlying
sources of elevated N in watersheds remains unclear, one possibility includes FN runoff and
leaching from residential and commercial landscapes, where FN is used routinely to promote
strong, healthy landscapes. Loss of FN through leaching commonly constitutes the main
channel of loss from field soils (Allison, 1966). With the growing public interest regarding
groundwater contamination by N and the MCL of 10 mg•L-1 NO3-N, the landscape industry
needs to reevaluate fertility management practices.
Current agricultural studies have developed thorough fertility management programs
that center on planting times, growth stages, and N uptake patterns while minimizing N
leaching (Owens et al., 2000; Toth and Fox, 98; Upendra et al., 1999). Similarly, researchers
have examined the effects of FN applied at various rates and timings on a variety of turf
species by measuring top growth, vigor, color intensities, and rooting architecture while
comparing FN concentrations found at various depths in the soil profile (Bowman, 2003;
Bowman and Paul, 1991; Lee et al., 2003; Petrovic, 1990; Roy et al., 2000). These studies
discovered that most turfgrass species are efficient in N uptake because of dense root systems
and frequent removal of grass clippings that contain N.
Existing FN studies on landscape ornamentals and trees have correlated FN rates with
several growth parameters, however, little research has observed the leaching effects of these
FN inputs (Appleton and Kauffman, 1999; Good and Weir, 2004; Rose and Smith 2001;
Rosen et al., 2004). Current FN recommendations are based on early research when
consideration. Therefore, it is currently unclear how some landscape management practices
may affect the environment.
It is not surprising that little research exists for landscape ornamentals since many
ornamental landscapes usually have a combination of woody and herbaceous perennials,
evergreens, and annual plantings. To complicate matters further, it is not likely that all plants
were installed at the same time and therefore may have various FN requirements. This was
suggested by Erickson et al., (2001) who found soil N concentrations differences after
applying various FN rates at various timings to a mixed species landscape and a St.
Augustine turf [(Stenotaphrum secundatum (Walt.) Kuntze]. Soil N concentration under St.
Augustine never exceeded 0.4 mg L-1 after six 5 g•m-2 N (1 lb•1000 ft-2) was applied in
separate applications in February, April, June, August, October, and December. In contrast,
the mixed landscape with 12 ornamental species contained soil N concentrations ranging
from < 0.2 to 15.2 mg L-1 in percolate sampled daily after three separate N application of 5
g•m-2 (1 lb•1000 ft-2) applied in April, August, and December. However, these N
concentrations may be misleading since plants from this study were installed in Dec. 1998
and fertilization began the following February. Newly installed landscape plants may have
different fertility requirements than established plantings.
In recent years, fruit crop researchers have developed new fertility programs based on
the rate and timing of FN application relative to the nutritional demands of the plant to
reduce N leaching. Retamales and Hanson (1989) discovered that mature (22 years) highbush
blueberries (Vaccinium corymbosum L.‘Bluecrop’) required 18 g•m-2 (3.6 lb•1000 ft-2) less
fertilized in the spring and fall so N would be readily available for uptake (Rose, 1999).
However, Niederholzer et al., (2001) found that more than three-fourths of the N ultimately
absorbed by fall-fertilized trees persisted in the soil over winter and was absorbed during the
subsequent spring and summer. In contrast, pecan (Carya illinoinensis Wangenh. C. Koch.)
tree studies have found that N adsorption takes place during dormancy (November to April)
as well as spring before shoot and leaf development (Acuna-Maldonado et al., 2003).
The degree of nitrate leaching can be influenced by irrigation practices and/or
rainfall amounts. Application of FN near the fall season in some parts of the country has
shown to leach due to heavy fall and winter precipitation (Petrovic, 1990; Roy et al., 2000;
Snyder et al., 1984). Drier summers could limit a plant’s use of FN since the absorption of
nitrate is highly dependent on soil moisture levels (Roy et al., 2000). If high FN rates exceed
crop needs, excess N may remain in the soil profile during dry conditions. Heavy rainfall
may initiate a wetting front containing high concentrations of nitrate. If these concentrations
reach the water table as a single pulse, groundwater could test well over the MCL (Roy et al.,
2000).
Unlike field-grown perennial crops, ornamentals in an urban landscape have another
source of N unique to landscapes, mulch. Organic mulches that are frequently used are
pine-bark, hardwood, cypress, and pine needles. There use in ornamental landscapes is to suppress
weeds, retain soil moisture, and moderate soil temperatures. Even though organic mulches
may offer plant available nutrients they are not commonly applied to fertilize plants.
Nutrients that exist in mulch are generally not readily soluble for plant uptake and are less
Organic mulches greater than 30:1, C:N decrease N mineralization, making microbes
scavenge for available N thus reducing soil N availability for plant growth. In contrasts, N
mineralizes if C:N ratio are low, enough soil N exists to support microbial and plant growth.
(Barbarick, 1999).
A recent study conducted by Lloyd et al. (2002) illustrated that composted yard waste
applied as mulch can serve as an organic fertilizer. Lloyd (2001) examined the effects of
three mulches [composted yard waste (a mixture of wood chips, leaves, and grass clippings,
C:N ratio = 20), ground wood pallets (C:N ratio = 100), and no mulch (bare soil)] on growth
of river birch (Betula nigra ‘Cully’ Heritage) and rhododendron (Rhododendron ‘Pioneer
Silvery Pink’). All three mulch treatments received no FN (0 N) or 14 g•m-2 N(3 lbs•1000 ft
-2) applied in split applications (at budbreak and early October) yearly from 1998 to 2000.
Fertilizer N increased growth and foliar N concentrations of river birch and rhododendron
when mulched with ground wood pallets or no mulch (bare soil) compared to plants
receiving no FN. However, growth and foliar N concentrations of rhododendron and river
birch were similar when grown with composted yard waste with or without FN. Lloyd
(2001) also reported soil N concentrations were similar in the composted yard waste
treatment receiving no FN compared to the soil N concentration in the ground wood pallets
and no mulch (bare soil) treatment receiving FN indicating that composted yard waste can
serve as a high-quality organic fertilizer. Nitrogen measured in the soil solution under the
composted yard mulch receiving no FN averaged 30 mg•L-1 N compared to 10 mg•L-1 N with
(Duryea et al., 1999) therefore, mulch should not be used as the sole N source for landscape
plants unless C:N testing was performed by landscapers and homeowners.
Soil organic matter may alter the effects of FN due to microbe activity. Switchgrass
(Panicum virgatum L. ‘Cave-n-Rock’) biomass increased only 12% in a soil that contained
2.7 g•kg-1 of native soil N within the 0-15 cm of soil profile after 8.4 g•m-2 N(1.7 lbs•1000 ft
-2) was applied. In this same study, FN significantly increased switchgrass biomass (74%)
planted in other soils that contained < 1.3 g•kg-1 of native soil N (Stout and Jung, 1995).
Mass balance studies have documented that some FN was incorporated into the
microorganisms or organic residues of the soil (Rempel et al., 2004; Retamales and Hanson,
1989). Soil organic matter has many benefits for plants by positively influencing soil
structure, bulk density, water infiltration rates, and water and air movement within the soil
(Tisdale, 1993). Another study showed that application of FN to sweet corn (Zea mays L.)
can be reduced by half [146 vs. 73 g•m-2 (15 vs. 30 lbs•1000 ft-2) if 2.5 cm (1 in) of leaf
compost is incorporated into the soil (Maynard, 2002). However, compost was incorporated
annually in this study. Incorporating soil organic matter is an option during installation of
landscapes but not practical for established plantings. Nonetheless, careful consideration
should be exercised when using organic matter as fertilizer since N from this source can still
be subject to leaching under certain environmental conditions (Stout et al., 1997).
Landscape professionals should better understand the impact of landscape
fertilization practices on growth and performance of landscape plants and how these practices
impact N leaching. Currently, research has not adequately examined urban soil nitrogen
Lloyd, 2004). Adapting FN recommendation from other systems is convenient but of little
value for managing N in the landscape environment. Furthermore, in light of concerns of
over applying FN, N demands to increase growth may differ from demands to maintain
healthy, vigorous, aesthetic plants. For this, research is needed that examines how FN rate
and time of application affects plant growth and N losses for ornamentals in the landscape.
Literature Cited
Acuna-Maldonado, L.E., M.W. Smith, N.O. Maness, B. Cheary, and B. Carroll. 2003.
Influence of nitrogen application time on nitrogen absorption, partitioning, and yield
of pecan. J. Amer. Soc. Hort. Sci. 128:155-162.
Allison, F.E. 1966. The fate of nitrogen applied to soils. Adv. Agron. 18:219-258.
Appleton, B. and K. Kauffman 1999. Fertilizing landscape trees and shrubs. Virginia Coop.
Ext. Serv. Publ. 430-018.
Barbarick, K.A. 1999. Organic materials as nitrogen fertilizers. Colorado State Univ. Coop.
Ext. No. 546.
Bowman, D.C. 2003. Daily vs. periodic nitrogen addition affects growth and tissue nitrogen
in perennial ryegrass turf. Crop Sci. 43(2):631-638.
Bowman, D.C.and J.L. Paul. 1991. Absorption of three slow-release nitrogen fertilizers by
perennial ryegrass turf. Fert. Res. 29(3):309-316.
Brady, N.C. and R.R. Weil. 1999. The Nature and Properties of Soils. 12th ed. Prentice Hall,
Upper Saddle River, N.J.
Brown, S.P., L. Hodyss, and D. Marshall. 1996. Flowering perennials in Florida. Florida Sta.
Univ. Bul. ENH-68.
Cabrera, R.I. 2003. Less is more. Amer. Nurseryman. 197:40-45.
Cockerham, S.T. 2004. Irrigation and planting density affect river red gum growth.
Conradie, W.J. 1991. Distribution and translocation of nitrogen absorbed during early
summer by two year old grapevines grown in sand culture. Amer. J. Enol. Viticult.
42(3):145-148.
Cookson, W.R., J.S. Rowarth, and K.C. Cameron. 2000. The response of a perennial ryegrass
(Lolium perenne L.) seed crop to nitrogen fertilizer application in the absence of
moisture stress. Grass For. Sci. 55: 314-325.
Duarte, M. 1986. Herbaceous perennial production systems for Achillea, Gypsophila, and
Heuchera, M.S. Thesis, Univ. of Vermont, Burlington.
Dubois, J.J.B., S.L. Warren, and F.A. Blazich. 2000. Nitrogen nutrition of containerized
Anemone x hybrida. J. Environ. Hort. 18(3):145-148.
Duryea, M.L., J. English, and L.A. Hermansen. 1999. A comparison of landscape mulches:
chemical, allelopathic, and decomposition properties. J. Abor. 25(2):88-96.
Environmental Protection Agency. 2000. National management measures to control
non-point source pollution from agriculture.
[http://www.epa.gov/owow/nps/agmm/index.html] (last accessed 04/20/04).
Erickson, J.E., J.L. Cisar, J.C. Volin, and G.H. Snyder. 2001. Comparing nitrogen runoff and
leaching between newly established St. Augustine turf and alternative residential
landscape. Crop Sci. 41:1889-1895.
Evans, E. 2000. Perennials: Maintaining. North Carolina State Univ. Coop. Ext. Serv.
[http://www.ces.ncsu.edu/depts/hort/consumer/factsheet/perennials/text_maintaining.
Good, G. and R. Weir. 2004. Suggested practices for planting and maintaining trees and
shrubs. Cornell Coop. Ext. Publ. Bul. 24.
Hanson, E.J.and G.S. Howell. 1995. Nitrogen accumulation and fertilizer use efficiency by
grapevines in short-season growing areas. HortScience. 30:504-507.
Hood, T.M., H.A. Mills, and P.A. Thomas. 1993. Developmental stage affects nutrient
uptake by four snapdragon cultivars. HortScience. 28:1008-1010.
Gariglio, N.F., R.A. Pilatti, and B.L. Baldi. 2000. Using nitrogen balance to calculate
fertilization in strawberries. HortTechnology. 10(1):147-150.
Gilman, E.F., T.H. Yeager, and D. Kent. 2000. Fertilizer rate and type impacts magnolia and
oak growth in sandy landscape soils. J. Abor. 26(3):177-181.
Hinesley, L.E.and L.K. Snelling. 2000. Nitrogen increases fresh weight and retail value of
fraser fir christmas trees. HortScience. 35(5):860-862.
Huett, D.O. 1996. Prospects for manipulating the vegetative-reproductive balance in
horticultural crops through nitrogen nutrition: a review. Austral. J. Agr. Res.
47:47-66.
Kaximirova, R.N. 1994. Chemical plant analysis for determining the fertilizer requirements
of carnations. Austral. J. Agr. Res. 34(5):691-697.
Kessler, J.R., J.D. Williams, and B. Clendenen. 2002. Herbaceous perennials in Alabama
AN-566.
King, J.J., L.A. Peterson, and D.P. Stimart. 1995. Ammonium and nitrate uptake throughout
Ledgard, S.F. and G.S. Smith. 1992. Fate of 15N-labelled nitrogen fertilizer applied to
kiwifruit (Actinidia deliciosa) vines. Plant Soil. 147:59-68.
Lee, D.J., D.C. Bowman, D.K. Cassel, C.H. Peacock, and J. Thomas W. Rufty. 2003. Soil
inorganic nitrogen under fertilized bermudagrass turf. Crop Sci. 43:247-257.
Lloyd, J.E. 2001. Trophic cascades in ornamental landscapes mediated by soil organic
matter: Effects of mulch and fertilization on microbial activity, nutrient cycling, plant
carbon allocation, and insect herbivores. PhD Diss., Ohio State Univ., Columbus.
Lovatt, C.J. 2001. Properly timed soil-applied nitrogen fertilizer increases yield and fruit size
of 'Hass' avocado. J. Amer. Soc. Hort. Sci. 126(5):555-559.
Maynard, A.A. 2002. Leaf compost reduces fertilizer use for corn. BioCycle. 43(3):56-59.
Mengel, K.and E. Kirby. 1981. Principles of plant nutrition. 3rd ed., Intl. Potash Inst.
Worblaugen-Bern,Switzerland.
Muir, J.P., M.A. Sanderson, W.R. Ocumpaugh, R.M. Jones, and R.L. Reed. 2001. Biomass
production of 'Alamo' switchgrass in response to nitrogen, phosphorus, and row
spacing. Agron. J. 93:896-901.
Niederholzer, F.J.A., T.M. DeJong, J.L. Saenz, T.T. Muraoka, and S.A. Weinbaum. 2001.
Effectiveness of fall versus spring soil fertilization of field-grown peach trees. J.
Amer. Soc. Hort. Sci. 126:644-648.
Oral, N.and E. Acikgoz. 2001. Effects of nitrogen application timing on growth and quality
of a turfgrass mixture. J. Plant Nutr. 24:101-109.
Owens, L.B., R.W. Malone, M.J. Shopitalo, W.M. Edwards, and J.V. Bonta. 2000. Lysimeter
Perry, L.P.and S.A. Adam, Jr. 1990. Nitrogen nutrition of container grown Hemerocallis x
'Stella de Oro'. J. Environ. Hort. 8(1):19-21.
Petrovic, A.M. 1990. The fate of nitrogenous fertilizers applied to turfgrass. J. Environ. Qual.
19:1-14.
Relf, K.and E. Ball. 2002. Perennials: culture, maintenance and propagation. Virginia Coop.
Ext. Bul. 426-203.
Rempel, H.G., B.C. Strik, and T.L. Righetti. 2004. Uptake, partitioning, and storage of
fertilizer nitrogen in red raspberry as affected by rate and timing of application. J.
Amer. Soc. Hort. Sci. 129:439-448.
Retamales, J.B.and E.J. Hanson. 1989. Fate of 15N-labeled urea applied to mature highbush
blueberries. J. Amer. Soc. Hort. Sci. 114(6):920-923.
Rose, M.A. 1999. Nutrient use patterns in woody perennials: implications for increasing
fertilizer efficiency in field-grown and landscape ornamentals. HortTechnology.
9(4):613-617.
Rose, M.A. and E. M. Smith. 2001. Fertilizing landscape plants. Ohio State Univ. Coop. Ext.
Serv. Bul. HYG-1002-96.
Rosen, C. J., P.M. Bierman, and R.D. Eliason. 2004. Soil test interpretation and fertilizer
management for lawns, turf, gardens, and landscape plants. Univ. Minnesota.Ext.
Serv. Publ. BU-1731.
Roy, J.W., G.W. Parkin, and C. Wagner-Riddle. 2000. Timing of nitrate leaching from
Sanchez, E.E., T.L. Righetti, D. Sugar, and P.B. Lombard. 1991. Recycling of nitrogen in
field-grown 'Comice' pears. J. Hort. Sci. 66:479-486.
Scharenbroch, B.C.and J.E. Lloyd. 2004. A literature review of nitrogen availability indices
for use in urban landscapes. J. Abor. 30(4):214-229.
Shalaby, A.S., S.E. El-Gengaihi, E.A. Agina, A.S. El-Khayat, and S.F. Hendawy. 1997.
Growth and yield of Echinacea purpurea L. as influenced by planting density and
fertilization. J. Herbs, Spices, Med. Plants. 5:69-76.
Snyder, G.H., B.J. Augustin, and J.M. Davidson. 1984. Moisture sensor-controlled irrigation
for reducing N leaching in bermudagrass turf. Agron. J. 76:964-969.
Stout, W.L., S.L. Fales, L.D. Muller, R.R. Schnabel, W.E. Priddy, and G.F. Elwinger. 1997.
Nitrate leaching from cattle urine and feces in northeast U.S. Soil Sci. Am. J.
61:1787-1794.
Stout, W.L.and G.A. Jung. 1995. Biomass and nitrogen accumulation in switchgrass: Effects
of soil and environment. Agron. J. 87:663-669.
Thomas, P.A. 1999. Flowering perennials for Georgia gardens. Univ. Georgia Coop. Ext.
Serv. Bul. 944.
Tisdale, S.L. 1993. Soil fertility and fertilizers. 5th ed. Macmillan, New York, N.Y.
Toselli, M., J.A. Flore, C. Zavalloni, and B. Marangoni. 2000. Nitrogen partitioning in apple
trees as affected by application time. HortTechnology 10:136-141.
Toth, J.D.and R.H. Fox. 98. Nitrate losses from a corn-alfalfa rotation: Lysimeter
Upendra, S.M., B.P. Singh, S. Rahman, and V.R. Reddy. 1999. Soil nitrate-nitrogen under
tomato following tillage, cover cropping, and nitrogen fertilization. J. Environ. Qual.
28:1834-1844.
Weinbaum, S.A., S.A. Merwin, and T.T. Muraoka. 1978. Seasonal variation in nitrate uptake
efficiency and distribution of absorbed nitrogen in non-bearing prune trees. J. Amer.
Soc. Hort. Soc. 103:516-519.
Williams, L.E. and R.J. Smith. 1991. The effect of rootstock on the partitioning of dry
weight, nitrogen, and potassium, and root distribution of cabernet sauvignon
Chapter 1
Effect of fertilizer nitrogen rate and timing on growth and performance of six herbaceous perennials in a simulated landscape
(In the format appropriate for submission to the
Effect of fertilizer nitrogen rate and time of application on growth and performance of six herbaceous perennials in a simulated landscape1
Cynthia L. Proctor2, Stuart L. Warren3, Robert L. Mikkelsen4, and Dennis J. Werner3
Department of Horticulture Science
North Carolina State University
Raleigh, NC 27695-7609
Abstract
Herbaceous perennials are planted worldwide in public gardens, and commercial and home
landscapes. Little research has been conducted, however, examining the fertility needs of
herbaceous perennials in landscapes. This experiment included four rates of FN: 0, 7, 14,
and 28 g•m-2 (0, 1.5, 3.0, and 6.0 lbs•1000 ft-2) and four timings of FN application. Each FN
rate was divided equally into two applications and applied at the following times: 1) winter
(Jan. 15 and Feb.15), 2) spring (Apr. 15 and May 15), 3) summer (June 15 and July 15), or 4)
fall (Sept. 15 and Oct. 15). Canna L. ‘President’ (canna lily), Coreopsis verticillata L.
'Moonbeam' (thread leaf coreopsis), Echinacea purpurea L. ‘Magnus’ (purple coneflower),
Iris siberica L. ‘Caesar’s Brother’ (Siberian iris), Panicum virgatum L. ‘Shenandoah’
(switchgrass), and Sedum L. ‘Herbstfreude’ ('Autumn Joy' sedum) were planted in October,
2000 in a simulated landscape. Treatments were initiated in September, 2001. In 2002,
rate when FN was applied in April/May whereas Canna L. ‘President’ was unaffected by FN
when applied at the remaining times. All growth and measured ornamental characteristics of
Canna L. ‘President’ were unaffected by FN rate and timing in 2003. Foliar N concentration
≥ 3.0% was adequate for growth of Canna lily. Coreopsis verticillata 'Moonbeam' was
unaffected by FN rate and timing in 2002, whereas in 2003 number of flowers, visual
evaluations, growth index (GI), and top dry weight all increased linearly with increasing rate
of FN. Growth index was greater when FN was applied in January/February and April/May
compared to June/July. Foliar N concentration ≥ 1.9% was adequate for growth of
Coreopsis. For optimum performance of Coreopsis we recommend 7 g•m-2 to 14 g•m-2 N
(1.5 lbs•1000 ft-2 and 3 lbs•1000 ft-2) applied in late winter to early spring. In 2002, total
number of flowers per Iris siberica ‘Caesar’s Brother’ increased linearly with increasing FN
rate applied in September/October. Number of Iris flowers were unaffected by FN rate
applied in January/February and April/May. FN applied in September/October increased
visual evaluation of iris on Apr. 24 compared to all other timings. In 2003, regardless of FN
timing, top dry weight increased quadratically with increasing rates of FN with maximum top
dry weight at 15.5 g•m-2 N (3.1 lb•1000 ft-2). Foliar N concentration ≥ 1.22% was adequate
for growth of Iris siberica ‘Caesar’s Brother’. Thus for optimum performance of Iris we
recommend 7 g•m-2 to 14 g•m-2 N (1.5 lbs•1000 ft-2 and 3 lbs•1000 ft-2) applied from late
summer to early fall. All measured parameters except height of Panicum virgatum
‘Shenandoah’ was unaffected by FN rate and timing in 2002 and 2003. On June 25 and July
25, height of Panicum increased quadratically with increasing FN rates with maximum plant
was applied in January/February. FN applied at the other timings did not affect plant height.
Foliar N concentration of ≥ 0.92% dry wt was adequate for plant growth. A low rate of FN
[< 14 g•m-2 (3.0 lb•1000 ft-2)] applied anytime during the year was adequate to maximize
performance of Panicum virgatum ‘Shenandoah'. In 2002, all measured parameters of
Sedum L. ‘Herbstfreude’ were unaffected by FN rate and timing. On July 2, 2003 visual
evaluations were significantly greater when FN was applied in April/May compared to all
other timings. On Aug. 4, 2003 FN applied in September/October (the previous season)
advanced cyme coloration of Sedum L. ‘Herbstfreude’ compared to all other timings. By
Aug. 15, FN applied in September/October continued to advance cyme coloration compared
to FN applied in January/February and April/May. By Sept. 17, visual evaluations were
significantly greater when FN was applied in September/October compared to all other N
timings. From June 26 to July 24, GI was significantly greater when FN was applied in
April/May compared to June/July and September/October. By Aug. 4, 20 days after
June/July fertilization, GI was similar among all FN timings that received FN in 2003
(January/February, April/May, and June/July). Cyme coloration, visual evaluation and GI
were unaffected by rate of FN suggesting that Sedum '‘Herbstfreude’ would benefit from a
low rate of FN applied in both fall and spring. Foliar N concentrations increased linearly
with increasing FN rate when FN was applied in April/May and June/July. Foliar N
concentration ≥ 1.4% was adequate for plant growth. To cover the needs of a wide variety of
perennial species that usually exists in one landscape as well as minimize N concentrations in
the soil solutions, we recommend a low to moderate rate of FN [5 g•m-2 to 15 g•m-2 (1
Index words: Canna L. ‘President’, Coreopsis verticillata L. 'Moonbeam', Iris siberica L.
‘Caesar’s Brother’, Panicum virgatum L. ‘Shenandoah’, Sedum L. ‘Herbstfreude’
Significance to the Nursery Industry
Herbaceous perennials are planted worldwide in public gardens, and commercial and
home landscapes. Little research has been conducted, however, examining the fertility needs
of herbaceous perennials in landscapes. It is uncertain how FN rate and timing affects
growth, performance, and foliar mineral nutrient concentrations of herbaceous perennials in
the landscape. Data herein suggests that FN applied to herbaceous perennials had little effect
on growth and ornamental qualities. However, applying no N may not advisable, as some
perennials species did benefit from an FN application during a specific time. In addition,
choice of mulch may affect mineralization which may impact the availability of N in the
landscape. Applying FN at a low to moderate rate of FN [5 g•m-2 to 15 g•m-2 (1 lb•1000 ft-2 to
3 lb•1000 ft-2)] equally divided and applied in split applications in spring and early fall will
maintain adequate plant performance.
1Received for publication__________________and in revised from____________________.
This research was supported in part by a grant from the Perennial Plant Association, 3383
Schirtzinger Rd., Hilliard, Ohio 43026. Special thanks to William Reece for technical
Assistance and William Swallow for statistical guidance. From a thesis submitted by C.L.P.
in partial fulfillment of the requirements for the M.S. degree.
2Graduate Teaching Assistant
3Professor
Introduction
Herbaceous perennials are planted worldwide in public gardens, and commercial and
home landscapes. Trade journals have used herbaceous perennials repeatedly as their cover
story in recent years (Ashmun, 2003; Cohen, 2000; Lauderdale, 2003). In 1999, perennials
accounted for 27% of all U.S. plant sales, with $642 million wholesale value among 7,391
producers (Hamrick, 2000).
Much information exists for tradesmen and homeowners concerning herbaceous
perennials and most recommendations on topics such as pruning and planting techniques are
similar (Armitage, 1997; Still, 1994). Recommendations regarding FN rate and timing,
however, vary dramatically (Holmes et al., 2001; Phillips and Burrell, 1999). For herbaceous
perennials in the southeastern United States FN rate recommendations range from 0 to 25
g•m-2 N (0 to 5 lbs•1000 ft-2) while recommendations for FN timing vary from split
applications (i.e., early spring and mid-summer), once at budbreak or simply apply “in the
growing season” (Brown, 1996; Evans, 2000; Kessler, 2002; Relf and Ball, 2002; Thomas,
1999). The lack of continuity regarding recommended FN rate and timing may be due to the
little research examining the fertility needs of herbaceous perennials in landscapes.
Currently, it is assumed that herbaceous perennials are N-limited in the landscape.
Therefore growth and performance (flower number, aesthetic quality) would suffer without
FN application. This is supported by results from Duarte and Perry (1988) who reported it
required 35.3 g•m-2 N (7.2 lbs•1000 ft-2) to maximize top dry weight of field-grown
Heuchera sanguinea 'Splendens' growing in a Windsor sandy loam with high P and K levels
N (8.5 lbs•1000 ft-2) when applied annually in the spring (Muir et al., 2001). In addition, a
field study in Egypt with purple coneflower (Echinacea purpurea L.), grown as an annual
crop found that plant height and top dry weight increased with increasing FN rates up to 147
g•m-2 (30 lbs•1000 ft-2) (Shalaby et al., 1997). In contrast, Achillea and Gypsophila plants
did not respond to FN when grown in a Windsor sandy loam with high P and K levels
(Duarte and Perry, 1988). Cabrera (2003) also reported that herbaceous perennials appeared
to have a very low FN requirement. Other field-grown perennial crops have also been shown
to have very low FN requirements: red raspberry (Rubus idaeus L. ‘Meeker’) (Rempel et al.,
2004), strawberry (Fragaria x ananassa Duch) (Strik, 2004), and river red gum (Eucalyptus
camaldulensis) (Cockerham, 2004).
In addition to rate of FN, applying FN at the appropriate time for maximum uptake is
important since low recovery of FN by landscape plants (low efficiency) may necessitate the
use of higher FN rates to supply plants with sufficient N and contribute nitrate to surface or
groundwater. The authors are unaware of any research examining the effect of FN timing on
the growth response of herbaceous perennials in landscapes. Since most plants need more N
during the vegetative stage whereas in the generative phase the N uptakes are low and the
retranslocation of organic N is high (Mengel and Kirby, 1981), N absorption of perennial
plants may vary during the year. Miner et al. (1997) reported greatest yield of 'Chandler'
strawberry with a split application of FN in spring and fall. Hood et al. (1993) reported
uptake of nutrients by snapdragon (Antirrhinum majus L.) grown hydroponically was highest
from visible bud to anthesis, and suggested that supplemental fertilizer during this stage of
x grandiflorum L.) grown hydroponicallyfrom cuttings was greatest 40 to 50 days after root
formation up to flower bud formation (King et al., 1995). Generally, woody perennial plants
do not begin absorbing N efficiently until after rapid top growth begins (Weinbaum et al.,
1978). Acuna-Maldonado et al. (2003) reported that pecan (Carya illinoinensis Wangenh. C.
Koch) N absorption was greatest between budbreak and the end of shoot expansion. They
also reported, however, that substantial N was absorbed between leaf fall and budbreak.
Working with grapevines (Vitas sp.), Hanson and Howell (1995) and Williams and Smith
(1991) reported that N absorption was most rapid between flower and veraison. In addition,
after fruit harvest to leaf fall, trunks and roots of grapevines accumulated N reserves that
supported early growth during the following year (Conradie, 1991).
In addition to growth, FN rate and timing can affect ornamental quality. A turfgrass
mixture of perennial ryegrass (Lolium perenne L.), Kentucky bluegrass (Poa pratensis L.),
creeping red fescue (Festuca rubra var. rubra L.), and chewing fescue (Festuca rubra var
commutate Gaud) grown in Turkey had more uniform color and sustained turf quality
throughout the growing season (April to September) when 5 g•m-2 (1 lb•1000 ft-2) N was
applied in April and May compared to 15 g•m-2 (3.3 lbs•1000 ft-2) applied in April and
September (Oral and Acikgoz, 2001). Rate of growth and top growth, however, were more
uniform when 5 g•m-2 N (1.0 lb•1000 ft-2) or 10 g•m-2 (2.0 lb•1000 ft-2) of FN were applied
in April, June, and August. Cookson et al. (2000) working in New Zealand reported
vegetative growth and seed yields of perennial ryegrass were increased by applying 12.5
g•m-2 (8 lbs•1000 ft-2) in the spring compared to applying 12.5 g•m-2 (2.5 lb•1000 ft-2) of N in
late winter and spring and a fall N application of 37 g•m-2 (8 lbs•1000 ft-2).
Over-application of FN is costly to the homeowner/landscaper and may have negative
effects on the environment and plant performance (Tisdale, 1993). Therefore, characterizing
FN needs for herbaceous perennials within the landscape, to match FN application to plant N
needs, is important for both improved plant performance and decreased environmental risk.
To optimize plant growth and performance while minimizing N losses more information
concerning FN rate and timing is required. Thus, the objective of this study was to determine
the effect of FN rate and timing on growth, performance, and foliar mineral nutrient
concentrations of seven selected herbaceous perennials.
Materials and Methods
The experiment was conducted at the Horticulture Field Laboratory, North Carolina
State University, Raleigh, from Oct. 2000 to Oct. 2003. Prior to planting, the Cecil clay soil
(clayey, kaolinitic, thermic Typic Hapludult) was amended by incorporating 2.5 cm (1 in) of
milled pine bark [< 1.3 cm (< 0.5 in)] and pH, phosphorus (P), and potassium (K) were
adjusted to levels recommended by the North Carolina Dept. of Agric. (NCDA) (Raleigh).
To create individual landscapes, raised beds were constructed and individual plots 2.4 x 3.4
m (8 x 11 ft) were laid out and a plastic barrier was installed to a depth of 61 cm (24 in)
between plots to maintain treatment integrity. In addition, there was a 1.5 m (5 ft) sod
(Festuca arundinacea 'K-31', K-31 tall fescue) buffer between each block. The following
perennials from 2.8 L (#1) containers were planted in Oct. 2000: two Coreopsis verticillata
coneflower), one Iris siberica L. ‘Caesar’s Brother’ (Siberian iris), two Panicum virgatum L.
‘Shenandoah’ (switchgrass), and one Sedum L. ‘Herbstfreude’ ('Autumn Joy' sedum) and one
Salvia x sylvestris L. ’East Friesland’ (hybrid sage) in each plot. Three rhizomes of Canna
L. ‘President’ (canna lily), were planted in each plot at the same time (Fig. 1). In August
2001, canna rhizomes were thinned to one in each plot. All plots received 5 cm (2 in) of
mulch (composted yard waste) after planting. If rainfall did not supply 2.5 cm (1 in) of water
weekly, supplemental irrigation was applied via drip emitters, (Xeri-bug, Rain Bird,
Glendora CA ) at a rate of 1.9 L•hour-1 (0.5 gal•hour-1). Additional soil testing was
performed by the NCDA for each plot in Mar. 2002 and 2003 and the pH, P, and K levels
were adjusted accordingly. Weeds were controlled by hand or by directed applications of
glyphosate weekly during the growing season and monthly during the dormant season.
The experiment was a 4 x 4 factorial in a randomized complete block design with
four replications. Treatments included four rates of FN: 0, 7, 14, and 28 g•m-2 (0, 1.5, 3.0,
and 6.0 lbs•1000 ft-2) and four timings of application. Each FN rate was divided equally into
two applications and applied at the following times: 1) winter (Jan. 15 and Feb.15), 2) spring
(Apr. 15 and May 15), 3) summer (June 15 and July 15), or 4) fall (Sept. 15 and Oct. 15).
All FN was applied as granular ammonium nitrate (NH4NO3) with handheld shakers
beginning Sept. 15, 2001 and the last FN application was applied July 15, 2003. Prior to this
study, no FN had been applied to this site since 1997.
In 2001, no plant data was collected. In 2002, data collected for each species
evaluations, GI, and top dry weight. Flowers of each species were monitored as described
below:
Canna ‘Mr. President’: A flower was counted when the staminodes were open
showing color. A flower was no longer counted once it lost its aesthetic appearance.
Coreopsis verticillata 'Moonbeam': A flower was counted when all rays were
completely unfurled and the disk exposed. When five flowers were present on the entire
plant, the plant was considered to be in flower. Flowers were no longer counted when each
plant had < 5 flowers. A flower was no longer counted when it lost its aesthetic appearance.
To estimate total number of flowers, three 10 cm2 (1.6 in2) openings were placed diagonally
20 cm (8 in) apart on a 0.5 m x 1.2 m (1.5 ft x 4 ft) foam board with the corner of the foam
board placed at the northeast corner of each plant. Total number of flowers in each opening
was added together and divided by three, providing us with number of flowers per 10 cm2.
To determine total number of flowers per plant, the following formula was used:
× = 100 cm plant total cm 10 flowers of number number flower Total 2
2 [1]
Total plant cm2 was determined by maximum plant width (cm) x perpendicular width (cm).
Echinacea purpurea ‘Magnus’: Data collection for Echinacea will not be included in
this manuscript.
Iris siberica ‘Caesar’s Brother’: A flower was counted when falls (outer 3 petals)
were partially reflexed, exposing its purple coloration. Flower number was recorded daily in
lieu of every 3 days due to the short life of Iris flowers. A flower was no longer counted
once it lost its aesthetic appearance. Total number of flowers was determined by counting
Panicum virgatum ‘Shenandoah’: Length of flowering was recorded in lieu of flower
number. When > 50% of the flowers on each plant turned a coppery color (visual evaluation)
the plant was recorded as in flower. The plant was no longer in flower when > 50% of the
coppery color (visual observation) on each plant turned brown.
Sedum ‘Herbstfreude’: Length of flowering was recorded in lieu of flower number.
When > 20% of the cymes displayed a pink coloration (visual observation) the plant was
recorded as in flower. All plants remained in flower until harvest.
Salvia x sylvestris ‘East Friesland’: No data was collected due to its marginal
performance in all treatments.
Plants were evaluated visually for landscape performance based on health of foliage,
percent flower coverage, and overall vigor (density and uniformity). Based on a visual
assessment of those characteristics, a single numeric rating from 1 to 5 (5 being optimum)
was recorded for each species. Plant visual evaluations for each species began when
flowering commenced and every two weeks thereafter until flowering ended. Thereafter,
visual evaluations were taken every month until Sept. 15.
GI was measured Oct. 1 and calculated as follows:
+ 2 lar width perpendicu + h plant widt maximum flower) (included height plant =
GI [2]
Tops (leaves, stems, and flowers) of every plant were harvested Oct. 15 and dried at 65C
(150F) for 7 days and weighed, except for Canna ‘Mr. President’ where fresh weight of the
tops was recorded. Expired flowers remained on all perennials until harvest.
Based on the 2002 results, data collection for 2003 included the following: number of
counted daily. Growth index was measured starting May 20, 2003 for all plants every 14
days, until GI remained unchanged for two subsequent measurements (Canna ‘Mr. President’
May 20 to Aug. 3, Coreopsis verticillata 'Moonbeam' May 20 to Aug. 3, Iris siberica
‘Caesar’s Brother’ May 20 to July 22, Panicum virgatum ‘Shenandoah’ May 20 to July 22,
and Sedum ‘Herbstfreude’ May 20 to Aug. 3).
On Aug. 15, 2003, recently matured leaves were collected from all plants to
determine mineral nutrient concentration before sinensis except for Coreopsis. Due to the
small nature of its leaves, Coreopsis samples included stems and leaves. Leaves were dried
at 65 C (150 F) for 7 days and weighed. After drying, leaves were ground in a Cyclotec
grinder (Analytical instruments, LLC, Golden Valley, MN) to pass a 40 mesh (0.635 mm)
screen. All samples were analyzed for N, P, K, Ca, Mg, S, B, Cu, Fe, Mn, Na, and Zn by
NCDA. On Oct. 7 all tops (stems, leaves, and flowers) of each species were harvested and
dried at 65C (150F) for 7 days and weighed except for Canna ‘Mr. President', where fresh
weight was recorded. Weights of leaves harvested on Aug. 15 were combined with dry
weights of tops to determine total top dry weights. After the final harvest (Oct. 7, 2003) soil
was excavated parallel to the root system of each plant to determine approximate rooting
depth of each species.
All data were subjected to analysis of variance procedures (ANOVA) (P≤ 0.05) and
regression analysis (P≤ 0.05) where appropriate. Treatments means were separated by
Fisher’s protected least significant difference (LSD), P= 0.10, where appropriate. Alpha was
set to 0.10 due to the variable nature of field experiments, and to avoid making Type II
interaction (P≤ 0.05) the data is presented appropriately. When the FN rate x FN timing was
nonsignificant, however, FN rate is presented averaged over FN timing and FN timing is
presented averaged over FN rate.
Results and Discussion
Canna ‘Mr. President’. 2002: Canna was in flower from May 8 to Sept. 19.
Number of flowers increased linearly on May 26, May 29, June 1, and June 4 with increasing
FN rates when FN was applied in April/May (only June 1 data presented) (Fig. 2). Number
of flowers (mean = 3.6 ±0.08 SE) was unaffected by FN rate when applied in
January/February, June/July, or September/October (data not presented). Since the number
of flowers did not increase after FN applications in winter, summer or fall these results
suggest that FN uptake may be maximized during active spring growth. Many perennial
plants exhibit a high rate of N uptake during active growth (Hanson and Howell, 1995). In
addition, height of Canna at the end of the 2002 growing season was significantly taller when
N was applied in April/May compared to all other timings regardless of the FN rate (Table
1).
After June 4, number of flowers were unaffected by FN rate regardless of N timing
with the number of flowers/plant/week per Canna averaging five from June 15 to Sept. 18
(data not presented). Top fresh weight [mean = 10.5 kg ±0.48 SE (23.0 lbs)] and visual
evaluations (mean = 3.2 ±0.04 SE), however, were unaffected by FN rate and timing (data
not presented). Total N concentrations found 38 cm (15 in) below the soil surface were 82
mg•L-1 (May 23) and 59 mg•L-1 (June 10), after split N application of 28 g•m-2 (6 lbs•1000 ft
rate of FN from May 26 to June 4 when applied in April/May, the lack of response of fresh
weight and visual evaluations to FN combined with potential N leaching losses at the high
rates of FN, landscapers/homeowners will need to balance maximizing plant performance
and environmental consequences of high rates of FN application.
2003: Canna was in flower from June 2 to Sept. 15. Peak number of flowers occurred July 1,
twenty-six days later than 2002. The 2002-2003 winter was colder [(18 days < -4C (25F)]
compared to 2001-2002 winter [9 days < -4C (25F)] and Canna species are listed as zone 7
to 10 for cold hardiness (Armitage, 1997). Thus, the duration of temperatures below 0C
(25F) could have delayed plant emergence and flowering potential for Canna. Top fresh
weight, however, increased 16% in 2003 compared to 2002 (data not presented).
Number of flowers/plant/week (mean = 4 ±0.03 SE), top fresh weight [mean = 12.5
kg ±0.48 SE (27.6 lbs)], visual evaluations (mean = 3.2 ±0.05 SE), height [78 cm ±3.0 SE
(2.6 ft)], and GI [118 ±5 SE] were unaffected by FN rate and timing (data not presented).
This was surprising based on the 2002 response and since N typically elicits a growth
response in plants (Mengel and Kirby, 1981). Other perennial crops, however, have also not
responded to FN. River red gum (Eucalyptus camaldulensis) was fertilized with 0, 23.5
kg•ha-1 (21 lbs•a-1), and 47 kg•ha-1 N (42 lbs•a-1) annually for six years (Cockerham, 2004).
Tree height, diameter, and top fresh weight were unaffected by FN. Mature summer-bearing
red raspberry (Rubus idaeus L. ‘Meeker’) plants were grown for two years with FN applied:
singularly at 0, 4, or 8 g•m-2 N (0.8 or 1.6 lbs•1000 ft-2) applied at budbreak, or split 4 g•m-2
N (0.8 lbs•1000 ft-2) applied at budbreak and 4 g•m-2 N (0.8 lbs•1000 ft-2) applied eight