Article 1
The application of ATR-FTIR spectroscopy and the reversible DNA conformation as a
2
sensor to test the effectiveness of Platinum(II) anticancer drugs
3
4
Khansa Al-Jorani1, Anja Rüther1, Miguela Martin, Rukshani Haputhanthri1, Glen B.
5
Deacon2, Hsiu Lin Li3, Bayden R. Wood1*
6
1 Centre for Biospectroscopy and School of Chemistry, Monash University, Clayton, 7
Victoria, 3800, Australia. 8
2 School of Chemistry, Monash University, Clayton, Victoria, 3800, Australia 9
3 School of Chemistry, UNSW Sydney NSW 2052 Australia 10
* Correspondence: [email protected]; Tel.: +61-399-055-721 11
12
Abstract: Platinum(II) complexes have been found to be effective against cancer cells. 13
Cisplatin curbs cell replication by interacting with the deoxyribonucleic acid (DNA), 14
eventually leading to cell death and reducing cell proliferation. In order to investigate the 15
ability of platinum complexes to affect cancer cells, two examples from the class of 16
polyflurophenylorganoamidoplatinum(II) complexes were synthesised and tested on 17
isolated DNA. The two compounds trans-[N,N’-bis(1,2,3,5,6-pentafluorophenyl)ethane-18
1,2-diaminato(1-)](2,3,4,5,6-pentafluorobenzoato)(pyridine)platinum(II) (PFB), and trans-19
[N,N’-bis(1,2,3,5,6-pentafluorophenyl)ethane-1,2-diaminato(1-)](2,4,6-20
trimethylbenzoato)(pyridine)platinum(II) (TMB) were compared with cisplatin through 21
their reaction with DNA. Attenuated Total Reflection Fourier Transform Infrared (ATR-22
FTIR) spectroscopy was applied to analyse the interaction of the Pt(II) complexes with DNA 23
in the hydrated, dehydrated and rehydrated state. These were compared with control DNA 24
in acetone/water (PFB, TMB) and isotonic saline (cisplatin) under the same conditions. 25
Principle Component Analysis (PCA) was applied to compare the ATR-FTIR spectra of the 26
untreated control DNA with spectra of PFB and TMB treated DNA samples. Disruptions in 27
the conformation of DNA treated with the Pt(II) complexes upon rehydration were mainly
28
observed by monitoring the position of the IR-bandaround 1711 cm-1 assigned to the DNA
29
base-stacking vibration. Furthermore, other intensity changes in the phosphodiester bands 30
of DNA at ~1234 cm-1 and 1225 cm-1 and shifts in the dianionic phosphodiester vibration
31
at 966 cm-1 were observed. The isolated double stranded DNA (dsDNA) or single stranded 32
DNA (ssDNA) showed different structural changes when incubated with the studied 33
compounds. PCA confirmed PFB had the most dramatic effect by denaturing both dsDNA 34
and ssDNA. Both compounds, along with cisplatin, induced changes in DNA bands at 1711, 35
1088, 1051 and 966 cm-1 indicative of DNA conformation changes. The ability to monitor 36
conformational change with infrared spectroscopy paves the way for a sensor to screen for 37
new anticancer therapeutic agents. 38
39
Keywords: Platinum; DNA; IR 40
41
42
43
44
1. Introduction
45
The Pt(II) complexes, carboplatin, cisplatin and oxaliplatin have been approved
46
worldwide for the treatment of cancerous tumours[1-4]. Cisplatin was approved as an 47
anticancer drug by the U.S Food and Drug Administration in 1978[5]. Soon after it became 48
a wide spectrum anticancer agent because of its activity against non-small lung cancer, head, 49
breast and neck cancers [6,7], in addition to its specific use in testicular and ovarian cancer 50
[4]. The interaction of cisplatin with deoxyribonucleic acid (DNA) inside the nucleus causes 51
cell death and apoptosis. Previous studies have found that the interaction occurs between 52
cisplatin and the DNA bases, especially guanine-N(7) but also adenine-N(3) [8]. The 53
interaction of cisplatin with DNA has been studied extensively using X-ray crystallography 54
and NMR spectroscopy in addition to Liquid Chromatography Mass Spectroscopy (LCMS) 55
[5,9,10]. Resonant inelastic X-ray scattering (RIXES) spectroscopy has mapped the 56
hydration of cisplatin and its binding to adjacent guanine bases of DNA [11]. The cisplatin-57
resistance of some cancer types and dose-limiting side effects such as nephrotoxicity, 58
peripheral neuropathy, vomiting, renal and visual impairment, restrict its application [12]. 59
These effects have led to a search for novel Pt(II) complexes with increased stability that 60
destroy cancer cells with less side effects [13]. The side effects are postulated to result from 61
non-selective reactions of cisplatin with other biomolecules such as proteins and 62
phospholipids as well as interactions of the drug with healthy tissues leading to dose limiting 63
nephrotoxicity [13,14]. 64
Because the main target of the platinum complexes is DNA, understanding the effect of 65
these drugs on DNA conformation is essential [8,15]. After hydrolysis of the chloride leaving 66
group the complex is in a form in which it can interact with DNA [11,16-18]. It was found 67
that cisplatin binds to double stranded (ds) DNA through coordination by the guanine base 68
at the N7 position, leading to changes in the DNA structure [11,16,19]. Studies performed on 69
DNA using X-ray crystallography showed that the interaction of cisplatin with DNA causes 70
the DNA helix to unwind and distort [11,19]. The interaction between the DNA and the drug 71
can be studied with infrared (IR) spectroscopy because the method is very sensitive towards 72
DNA conformational changes. Thus, the technique provides a useful tool to explore the 73
effects of drugs on the conformation of this fundamentally important biological molecule 74
[20]. 75
“Rule breakers” which do not conform to the usual structure/activity rules for 76
platinum(II) complexes [21-23] represent an approach to overcome the current deficiencies 77
of clinical drugs. One such class are platinum(II) organoamides [Pt(NRCH2)2(py)2]
78
(R=polyfluorophenyl; py= pyridine), of which [Pt{N(p-HC6F4)CH2}2(py)2] (Pt103) is the
79
lead compound. It is active in vitro against both cisplatin active and resistant cells and against 80
some in vivo tumours [12,24] and has been shown to have greater cellular uptake and a large 81
number of DNA inter-strand cross links compared with cisplatin [25]. Recently, RIXES 82
spectroscopy demonstrated that Pt103 initially reacts preferentially with adenine bases of 83
DNA [26], thus offering an explanation for the difference in biological properties from 84
cisplatin. Pt103 is unusual as an anticancer active molecule with four nitrogen donor atoms 85
and is a “rule breaker” because of no N-H bonds on the nitrogen donor atoms. 86
We have recently shown by FTIR methods [27] [28] that Pt103 interacts with DNA in 87
aqueous acetone prior to hydrolysis. Such an interaction presumably involves H-bonding. 88
In an attempt to provide more opportunity for H-bonding with DNA, we reacted Pt103 89
with pentafluorobenzoic acid and 2,4,6-trimenthylbenzoic acid giving the two compounds 90
namely trans-[N,N’-bis(1,2,3,5,6-pentafluorophenyl)ethane-1,2-diaminato(1-)](2,3,4,5,6-91
pentafluorobenzoato)(pyridine)platinum(II) 92
(PFB) and trans-[N,N’-bis(1,2,3,5,6-pentafluorophenyl)ethane-1,2-diaminato(1-)](2,4,6-93
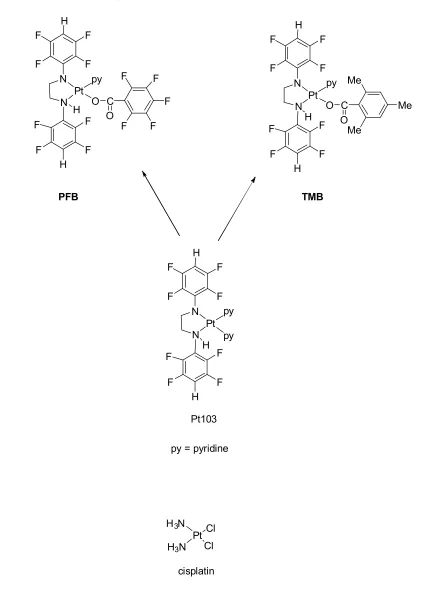
trimethylbenzoato)(pyridine)platinum(II) (TMB). (Figure 1). PFB and TMB, contain N-H 94
bonding with DNA. We now report an investigation of the interaction of PFB and TMB with 96
DNA by ATR-FTIR spectroscopy 97
98
F
F F
F
Pt py
F
F F
F H
H
N
N O C
O
F F
F
F F
F
F F
F
Pt
F
F F
F H H
N
N O C
O Me
Me
Me py
TMB
py = pyridine H
H
Pt Cl H3N
H3N Cl
cisplatin F
F F
F
Pt
F
F F
F H
H
N
N
py
H py
Pt103 PFB
99 100
Figure 1: Chemical structures of PFB, TMB and cisplatin. 101
102
In examining how these Pt(II) complexes affect the DNA conformation we performed a
103
series of ATR-FTIR studies monitoring hydrated, dehydrated and rehydrated DNA-drug 104
Watson and Crick originally detected the polymorphism of the DNA 60 years ago. Later, 106
Franklin and Gosling indicated that the DNA forms two different conformations, namely the 107
hydrated B-DNA form and the dehydrated A-DNA form[29]. 108
109
110 111
Figure 2: DNA interaction with PtII and conformation change
112 113
The DNA conformation is also sensitive towards pH, temperature, counter ion and base 114
pair sequences [30], which were kept constant in this study. In the absence of drugs that 115
interact with DNA, the DNA conformation reversibly goes from B-DNA in the hydrated state 116
to A-DNA in the dehydrated state and back to B-DNA upon rehydration. It was hypothesised 117
that the effect of Pt(II) compounds could be investigated by studying the dynamical
118
conformation change from the A-DNA form to the B-DNA form in the presence and absence 119
of Pt(II) novel complexes upon rehydration. Hydration and electrostatic interactions are 120
considered major factors leading to the transition. Disruption of these electrostatic 121
interactions can be monitored by recording FTIR spectra of DNA before and after 122
rehydration. 123
124
The drugs were mixed with calf thymus dsDNA and ATR-FTIR spectra were measured 125
to investigate changes in FTIR bands that are concomitant with changes in the DNA 126
conformation. Repeated measurements of FTIR spectra were performed to obtain a series of 127
spectra of the dehydrated samples, starting with the hydrated sample, which was deposited 128
in an aqueous state onto the ATR crystal and left until the water stretching mode at ~3650 129
cm-1 disappeared. Then each sample was exposed to the gradual addition of water, which 130
initiated the process of rehydration and was monitored by ATR-FTIR spectroscopy. 131
132
2. Materials and Methods
133
2.1 Biological compounds 134
Double stranded calf thymus DNA (mol. Wt. 8-15 kb; 42% GC content) (Sigma St louis, 135
MO, USA), single stranded calf thymus DNA (Sigma St louis, MO, USA), acetone (Merck 136
KGaA, Darmastadt, Germany), Tris-HCl buffer (2-amino-2-hydroxymethyl-propane-1,3-137
diol hydrochloride) (Merck KGaA, Darmstadt, Germany), hydrochloric acid (HCl) 32% 138
(Ajax Fine Chemicals Pty Ltd, NSW, Australia). The Pt103 was prepared by the reported 139
method.[31] 140
2.2 Platinum compounds synthesis 144
145
The platinum complexes PFB and TMB were synthesized as shown in Figure 1. 146
147 148
2.2.1 Synthesis of PFB 149
[N,N’-Bis(2,3,5,6-tetrafluorophenyl)ethane-1,2diaminato(1-150
)](pentafluorobenzoato)(pyridine)platinum(II)] (PFB) 151
[N,N’-Bis(2,3,5,6-tetrafluorophenylethane-1,2-diaminato)](2-dipyridineplatinum(II) 152
(Pt103) (0.20 g, 0.28 mmol) was treated with) pentafluorobenzoic acid (0.060 g, 0.28 153
mmol ) in diethyl ether (160 mL) and was stirred and irradiated by light (halogen lamp 500 154
W) for 240 min. The crude product was isolated by evaporation to dryness and dissolved in 155
a minimum amount of acetone and passed through a 15 cm neutral alumina column with ethyl 156
acetate: light petroleum: acetone 1:1.5:0.1 as eluent. The yellow band indicative of the 157
product was collected and the solution evaporated to dryness. Diethyl ether ~2 ml and 158
petroleum ether ~5 ml were added and cooled. The compound produced bright yellow 159
crystals. Yield 0.090 g, 38%, m.p. 174 0C (dec). (Found: C, 37.5; H, 1.3; N, 5.1.
160
C26H12F13N3O2Pt requires C, 37.2; H, 1.4; N, 5.0 %). 1HNMR.:2.92-3.19, br m, 3H, CH2NH
161
and CH2N; 4.07, m, 1H ,CH2NH ;6.36, m, 1H, p-HC6F4N; 7.36, t, 2H, H3, 5 (py); 7.54, m,
162
1H, p-HC6F4NH; 7.91, t, 1H, H4(py); 8.35, br, 1H, NH; 8.63, d with 195Pt satellites, 3JH,H 5
163
Hz 3JH,Pt 39 Hz, 2H, H2,6(py).19FNMR.: -140.8, m, 2F, F3,5(p-HC6F4NH); -144.85, m, 2F,
164
F2,6(O2CC6F5);-145.1, m, 2F, F3,5(p-HC6F4N); -146.9, brm, 2F, F2,6(p-HC6F4NH);- 153.3,
165
m, 2F, F2,6(p-HC6F4N); -158.4, t, 3JF,F 20 Hz, 1F, F4(O2CC6F5), -164.5, m,
166
2F,F3,5(O2CC6F5). UV/Visible spectrum λ max (ε): 390 nm (2.2x10³). IR spectrum: 3104m,
167
3075sh, 2962w, 2868w, 2647w, 2324w, 2113w, 1982w, 1920w, 1659vs, 1631vs, 1583w, 168
1528s,1493s, 1473s, 1452s, 1427w, 1414w, 1405w, 1361vs, 1336m, 1285w, 1260s, 1216w, 169
1180m, 1158m, 1133m, 1101m, 1082s, 1047w, 1019s, 990vs,935m, 897m, 869m, 843w, 170
819w, 799w, 786vs,758m, 716s, 694w, 667w, 641w cm-1. Mass spectrum: m/z 840 [33, M+]; 171
762 [1, (MH-py)+]; 629 [25, (M-C
6F5CO2)+].
172 173
2.2.2 Synthesis of TMB 174
[N,N’-Bis(2,3,5,6-tetrafluorophenyl)ethane-1,2diaminato(1-)](pyridine)(2,4,6-175
trimethylbenzoato)platinum(II) (TMB), Pt 103 (0.20 g, 0.28 mmol) and 2,4,6-176
trimethylbenzoic acid (0.050 g, 0.28 mmol) were stirred together in diethyl ether (160 mL) 177
and irradiated by light (halogen lamp 500W) for 240 min. Evaporation, dissolution in acetone 178
and chromatography as for PFB above. Diethyl ether and petroleum ether were added to the 179
residue and cooled. The compound gave bright yellow crystals. Yield 0.080 g, 36%, m.p. 165 180
⁰C (dec). (Found: C, 44.0; H, 3.1; N, 5.5. C29H23F8N3O2Pt requires C,43.9;H,2.9;N,5.3%).
181
1H NMR: 1.57, s, 6H, o-CH3; 1.66, s, 3H, p-CH3; 2.96-3.25, brm, 3H, CH2N, and CH2NH;
182
4.14, m, 1H, CH2NH; 6.24, m, 1H, p-HC6F4N; 6.55, s, 2H, H3,5(Ph); 7.33, t, 3JH,H 7Hz,
183
2H, H3,5(py); 7.65, m, 1H, p- HC6F4NH; 7.88, t, 3JH, H 8Hz, 1H, H4(py); 8.64, d with 195Pt
184
satellites, 3JH,H 5 Hz, 3JH,Pt 38 Hz, 3H, H2,6(py) and NH. 19FNMR.: -140.7, m, 2F, F3,5;
(p-185
HC6F4NH); -145.3, m, 2F, F3,5 (p-HC6F4N); -146.1, m, 2F, F2,6 (p-HC6F4NH); -154.1, m,
2F, F2,6 (p-HC6F4N). UV/Visible spectrum λ max (ε): 376nm (2.2x10³). IR spectrum:
187
3454w, 3080mw, 3048w, 3032w, 3010w, 2982w, 2943w, 2862w, 2323w, 2167w, 2113w, 188
1981w, 1916w, 1739vw, 1632w, 1608vs, 1581w, 1523vs, 1492s, 1467mw, 1453s, 1443s, 189
1351vs, 1288mw, 1266m, 1245w, 1213w, 1177m, 1157m, 1123s, 1076m, 1044s, 1019w, 190
936vw, 895vs, 869m, 856w, 841w, 831m, 791m, 767m, 743w, 716mw, 696s, 674w, 663w, 191
629mw cm-1. Mass spectra: m/z 792 [33, M+]; 714 [25, (MH-py+)], 629 192
[20, M-C6H2Me3CO2+], 179 [ (80, p-HC6F4NHCH3)+].
193 194
2.3Preparation of DNA solutions 195
Double stranded calf thymus DNA (1 mg/mL) and single stranded calf thymus DNA 196
(0.75 mg/ml) solutions were obtained from Sigma Chemical Company and prepared in 10 197
mM Tris-HCl buffer at pH 7.4 and stored at 8 0C. The stock solutions of 6 mM and 3 mM of 198
both PFB and TMB were prepared in water/acetone (10% v/v) mixture and stored at room 199
temperature in the dark. The colour of the fresh solution was bright yellow. These solutions 200
remained stable for a few months. UV-Vis spectra and cyclic voltagrams were acquired to 201
confirm the stability of these drug solutions. 202
203
2.4Preparation of Drug solution 204
The two compounds PFB and TMB were prepared as stock solutions of 6.00 mM in 205
water: acetone (10% v/v). 206
Stock solution calf thymus dsDNA or ssDNA (100 μL) were added to 100 μL of the 207
stock solution of the Pt drug solution at room temperature and mixed for 2 min (Vortexer, 208
Ratek Instruments Pty Ltd, Knox City, Victoria, Australia). It was wrapped tightly using 209
parafilm to prevent liquid evaporation and incubated for 48 h at 37 0C in the dark. 3 μL
210
aliquots of the clear solution were collected and deposited onto the ATR crystal. All 211
experiments were carried out in triplicates. The average observed pH of the final mixtures of 212
DNA treated with Pt drug solution or DNA control was 7.2 (± 0.04). The pH value was 213
measured with a pH meter (Hanna Instruments Pty. Ltd., Woonsocket, Rhode Island, USA). 214
215
2.5Instrumentation 216
UV-Vis spectra were acquired using a Carry 100 UV-Vis spectrometer with the Varian 217
Carry WinUV software (Santa Clara, CA, USA) for both double strand and single strand 218
DNA. Both solutions showed a UV band at 260 nm.[32] 219
ATR-FTIR spectra of DNA were acquired using a Silicon BioATR Cell II accessory 220
(Harrick Scientific, Pleasantville, NY) coupled to a Bruker IFS Equinox55 FTIR system 221
(Bruker Optics Pvt. Ltd, Billerica, MA, USA). The silicone ATR crystal has an inert sample 222
interface (Teflon and stainless steel) and ca 6 μm effective pathlength between1500 to 2000 223
cm-1. ATR-FTIR spectra of solid drugs were recorded using a Golden Gate single bounce 224
diamond micro-ATR coupled to a Bruker IFS Equinox FTIR system (Bruker Optics Pvt. Ltd, 225
Billerica, MA, USA). The diamond ATR crystal has ca 2 μm effective pathlength at 1000 226
cm-1 and was used to record ATR-FTIR spectra for platinum compounds in the solid state. 227
The data were processed using the Bruker OPUS software, version 6.0 (Bruker Optics Pvt. 228
Ltd). 229
230 231
2.6UV-Vis spectra of DNA 232
The stock solution of dsDNA calf thymus was prepared at the concentration of 1 mg/mL 233
The UV-Vis absorbance was measured for diluted DNA solution (50× dilution). The 234
Vis spectrometer at 260 nm. The purpose of this step is to extract the nucleotide concentration 236
by calculating the PO2− concentration as they are equivalent to each other.
237 238
2.7FTIR-ATR spectroscopy 239
The spectra of the solid drugs were recorded using the Golden Gate single bounce 240
diamond micro-ATR system coupled to a Bruker IFS Equinox FTIR system (Bruker). The 241
diamond ATR crystal has an effective pathlength of ca 2 μm at 1000 cm−1. After cleaning 242
the surface of the ATR crystal with distilled water and isopropanol the samples of DNA-drug 243
solutions were recorded using the silicon ATR crystal (45 °C top plate) of the BioATRCell 244
II, which has an inert sample interface (Teflon and stainless steel) and ca 6 μm effective 245
pathlength between1500–2000 cm−1.
246
Three replicates were recorded for each drug-DNA sample and control. The samples 247
included the DNA solution with Tris buffer solution, a DNA solution with a solvent 248
(acetone:water mixture 10:1) and DNA samples mixed with drug solutions. 3 μL of each 249
aqueous sample was placed onto the silicon ATR crystal of the BioATR cell covering the 250
entire crystal to ensure the coverage of the 4.4 mm diameter of the crystal surface and to 251
provide an active sampling area by forming a uniform film. In the spectral region from 4000 252
to 600 cm-1, 50 sample interferograms were acquired at a resolution of 4 cm-1 with a zero
253
filling of 2. The spectrum of blank silicon was acquired as the background before each sample 254
spectrum. Before transferring the samples to the ATR crystal, they were left on the bench for 255
a few minutes to establish room temperature. The spectra of each sample were acquired 256
continuously over a one hour period every 60 seconds. The samples included the DNA 257
solution mixed with saline or water/acetone as the controls and the DNA solutions treated 258
with PFB, TMB and cisplatin, respectively. The drug was dissolved in an acetone water 259
mixture (10:1) and incubated for 48 hours at the physiological temperature of 37 ⁰C to mimic 260
the body temperature. 3 μL of each sample was deposited on the ATR biocell and air-dried 261
until consistent spectra were achieved. The process was repeated to obtain a series of 262
dehydrated samples. 263
The spectra showing acetone contamination observed in the first two or three spectra for 264
each sample were excluded from the ensuing analysis. 265
The rehydration procedure utilised a humidifier to apply a stream of mist over each 266
dehydrated sample. The rehydration process was monitored for each sample with 60 scans at 267
8 cm-1 resolution until the DNA control and DNA:drug samples were fully hydrated. 268
269
2.8Data pre-processing 270
All spectra were pre-processed using the PLS toolbox in MATLAB (MathWorks, 271
Natick, MA). Second derivatives were calculated using the Savitsky–Golay algorithm with 272
9 smoothing points. 273
274
275
276
2.9Data analysis 277
Second derivative spectra were calculated and compared following treatment with 278
different drugs during dehydration and rehydration. 279
Principle Components Analysis (PCA) was performed on spectra of hydrated samples 280
treated with the different drugs for ssDNA and dsDNA using MATLAB (Math Works, 281
Natick, MA). The analysis was performed in the 1400-900 cm-1 region on the second 282
derivative using Savitsky-Golay algorithm, polynomial order of 2, and 15 smoothing points 283
then normalized using SNV and mean cantered. 284
3. Results
286
Complexes PFB and TMB were prepared by photo-induced substitution of pyridine by a 287
carboxylate ion with concomitant protonation of one amide nitrogen (Scheme1). Both gave 288
satisfactory microanalyses and appropriate mass spectra including parent ions with the 289
expected isotope patterns. Both 1H and 19FNMR spectra provided evidence of two different
290
2,3,5,6-tetrafluorophenyl groups. The NH resonance for PFB was clearly overlapped by H2,6 291
(py) for 2. As the protonated nitrogen atom is chiral (H, CH2, p-HC6F4, Pt substituents), the
292
adjacent CH2 group is prochiral and gives two resonances separated by 1ppm. The 3JH,Pt
293
constants of the pyridine ligand (39 Hz) are larger than that of Pt103 (34 Hz)[31] and in the 294
range of the [Pt{N(C6F4X4)CH2}2(py)2 (X = F, Cl, Br, I, Me) complexes (33-35 Hz) where
295
pyridine is trans to a tetrafluorophenylamide nitrogen, but are similar to those of 296
[Pt(py)2(H2NCH2)2](O2CC6F5)2 (39 Hz)[31], and [Pt{N(p-XC6F4)(CH2)2NMe2}(py)(Y)] (y
297
= halide; X = H, F, Cl, Br, Me) (39 Hz)[33] where pyridine is trans to an amine nitrogen. 298
Accordingly, the pyridine ligand in PFB and TMB is trans to the amine (NH) nitrogen as in 299
Figure 1. 300
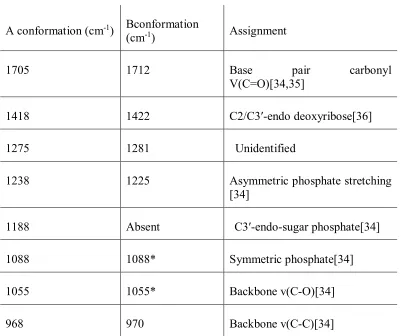
Table 1. Peak positions for DNA conformational bands 301
The drugs were tested in vitro and shown to be effective against leukaemia cell lines (L1210, 302
L1210/DDP[37]. 303
304
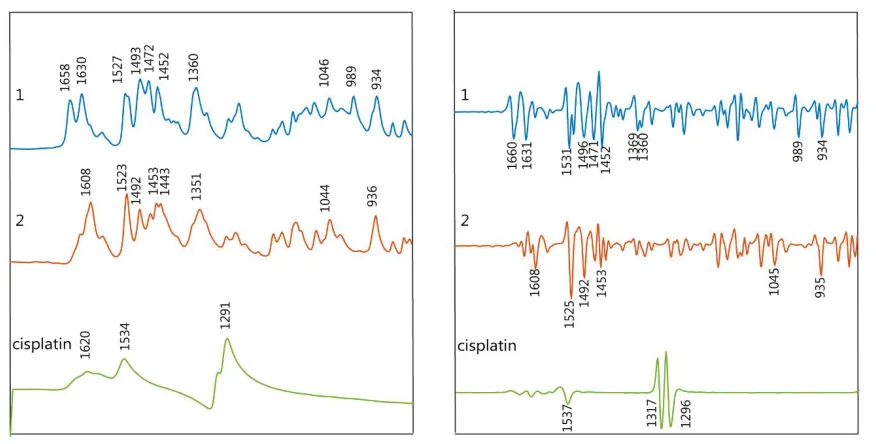
FTIR spectra of the synthesized drugs PFB and TMB were recorded in the spectral region 305
from 1800 to 900 cm-1 (Figure 2).
306
A conformation (cm-1) Bconformation
(cm-1) Assignment
1705 1712 Base pair carbonyl
V(C=O)[34,35]
1418 1422 C2/C3ʹ-endo deoxyribose[36]
1275 1281 Unidentified
1238 1225 Asymmetric phosphate stretching
[34]
1188 Absent C3ʹ-endo-sugar phosphate[34]
1088 1088* Symmetric phosphate[34]
1055 1055* Backbone v(C-O)[34]
307
308
The νas(COO-) shows an intense band between 1658-1617 cm-1 while the νs(COO-) appears
309
between 1363-1341 cm-1. The ν(C-F) shows two bands at ~934 and 990 cm-1, the latter 310
resulting from vibrations characteristic of the pentafluorobenzoate group. The other bands at 311
approximately 1495, 1047 and 1500 cm-1 are characteristic of the pentafluorobenzoate 312
group vibrations. 313
ATR-FTIR spectra were recorded of all DNA-drug samples in the spectral region from 1800-314
850 cm-1 where the DNA phosphodiester bands are located. Figure 2 shows the second
315
derivative spectra during dehydration (left) and rehydration (right) from DNA treated with 316
acetone/water or saline as the controls along with compounds PFB, TMB and cisplatin. In a 317
previous study the dehydration and rehydration effects on the DNA conformation were 318
especially noticeable after subtraction of water bands[38]. Here, each set of spectra from 319
dehydrated and rehydrated mixtures for both the control and the treated DNA were pre-320
processed separately. The raw infrared spectra of DNA control samples and the second 321
derivative spectra recorded during dehydration are shown in Figure 4. The raw spectra (top), 322
show noticeable changes in the 1088 and 1051 cm-1 bands. According to the literature this 323
indicates a DNA conformation change from B-DNA to A-DNA. This change is related to a 324
decrease in water content, which returns to the B conformation with the addition of water to 325
the sample. Therefore the change is not considered as definitive evidence of damage to DNA. 326
In Figure 4 the DNA in saline serves as the control. The second derivative spectra show 327
changes in DNA during dehydration, which are more obvious than in the raw spectra because 328
the bands are sharper and the inflection points resolved into distinct bands. 329
To monitor the effect of hydration on DNA conformation following incubation with the 330
drugs, all samples were measured in the hydrated state, during drying and after rehydration. 331
Figure 4 shows second derivative spectra of control DNA and drug-treated DNA in the 332
hydrated, dehydrated and rehydrated state. Cisplatin also seves as a control because its 333
mechanism of interaction with DNA is well established [39]. First, dsDNA was treated with 334
cisplatin, dried on the ATR crystal and rehydrated with water. The same process of 335
dehydration and rehydration was performed on another sample of DNA mixed only with 336
saline. The cisplatin-induced effects on DNA after rehydration are highlighted in the spectra 337
shown in Figure 4. The most affected bands were at 1716, 1225, 1088, 1051, and 968 cm-1.
338
The bands in the rehydrated cisplatin-treated DNA show similar changes that occurred during 339
the dehydration process. This indicates the damage in the DNA was influenced by the 340
interaction with cisplatin. 341
342
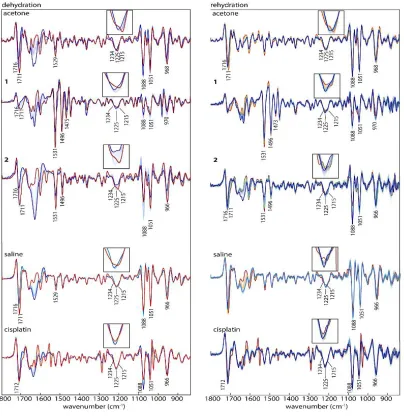
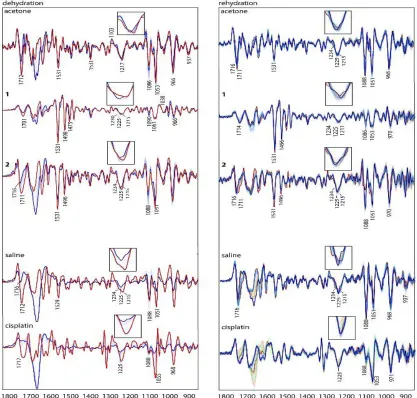
Figure 4: IR Average spectra (second derivative) of dsDNA treated with acetone (control 1) 343
PFB, TMB, saline (control 2) and cisplatin in the course of dehydration (left) colour-coded 344
from blue (hydrated) to red (dehydrated) and in the course of rehydration (right) colour-coded 345
from red (dehydrated) to blue (hydrated). 346
In the controls, a noticeable change in the spectra of the two bands around 1088 and 1051 347
cm-1 is observed during dehydration: they decreased in intensity in relative to the 1051 cm-1 348
band. While the band at 1088 cm-1 is more intense in the hydrated state, the band at 1051 cm -349
1 is more intense in the dehydrated state. According to the literature this indicates that the
350
DNA conformation has changed from B-DNA to A-DNA[35]. This change is only related to 351
the deficiency in water content and is a temporary change that returns back to the B-352
conformation upon rehydration. Therefore in this case the DNA conformation is not affected. 353
The band at 1225 cm-1 shifts and splits during dehydration and appears as two bands at 1234 354
and 1215 cm-1 in the dehydrated A-DNA. The band at 968 cm-1 increases in intensity and 355
shifts towards 966 cm-1, whilethe band at 1716 cm-1 shifts towards 1711 cm-1. Whereas the
acetone treated A-DNA returns to the B-form uppon rehydration as evinced by the fact that 357
1088 cm-1 and 1051 cm-1 show similar changes to the actone:DNA mixture during
358
dehydration and rehydration. 359
360
Drugs PFB and TMB show a mixture of B-DNA and A-DNA in the hydrated state as evinced 361
by the split of the band at 1225 cm-1. This band is assigned to the PO2- asymmetric-stretching
362
vibration and indicates that the mode of interaction for these drugs is similar. In the 363
dehydrated state for the same drugs the 1225 cm-1 had a split into two bands 1215 and 1234
364
cm-1, which indicates the partial transformation into the A-DNA conformation[40]. . The 365
PO2- band at 1225 cm-1 in the control spectra in the hydrated state indicates the exclusive
366
presence of B-DNA, while in the dehydrated the A-DNA conformation dominates the 367
spectral profile, indicated by the blue shift to 1234 cm-1. The band 1051 cm-1 shows a decrease
368
in intensity and a red shift towards 1060 cm-1 for all the drugs compared to the control DNA 369
where there is no effect on this band. 370
Another feature in characteristic DNA conformation change is the band at 968 cm-1. In the
371
hydrated state of the control B-DNA this band is at 968 cm-1, while it is slightly red-shifted 372
towards 966 cm-1 in the dehydrated state. In the dehydrated state of compounds , TMB and 373
cisplatin there is a decrease in intensity and a red shift towards 966 cm-1 while it decrease in
374
intensity for PFB . In rehydration, the band keep the same situation as in the dehydration state 375
for compounds PFB, TMB and cisplatin.
376
The base pairing mode of dsDNA at 1716 cm-1 in the control DNA maintains the intensity
377
and the position in both, the hydrated and the dehydrated state, while it shows a clear change 378
in the treated DNA with the drugs. For dsDNA treated with PFB and cisplatin a significant 379
decrease in intensity and a red-shift from 1716 to 1701–1711 cm-1 is visible in the hydrated 380
state. That change is also observed in the dehydrated state. This indicates a partial separation 381
of the A-DNA double helix into single strands with weaker base pairing interactions[27]. 382
An intensity change of the symmetric phosphate stretching at 1088 cm-1 is also associated 383
with a transformation from B-DNA to A-DNA. In the control DNA, there is no change in 384
this band in the hydrated state but a slight decrease in the band intensity at 1088 cm-1 in 385
respect to the band at 1051 cm-1 in the dehydrated state. The band decreased in intensity 386
significantly in the hydrated state in spectra of dsDNA treated with TMB, while only a slight 387
decrease in intensity is visible in spectra of dsDNA treated with PFB. 388
389
Interaction of drugs with single stranded DNA
390
To initiate cell proliferation, DNA is replicated. In the course of DNA-replication, dsDNA is 391
unwound into ssDNA. As tumour cells have an increased proliferation rate, more ssDNA is 392
present compared to healthy cells. Targeting ssDNA therefore increases the selectivity of an 393
anticancer drug towards tumour cells. Consequently, we are particularly interested in the 394
interaction of the studied drugs with ssDNA. Similar to the interaction studies with dsDNA, 395
ssDNA was treated with the drugs in the hydrated state and the drug-DNA interaction was 396
monitored with IR spectroscopy during dehydration and rehydration. The 2nd derivative IR
397
spectra of ssDNA treated with 1, 2 and cisplatin during dehydration and rehydration are 398
400
401
Figure 5: IR Average spectra (second derivative) of ssDNA treated with acetone (control 1) 402
1, 2, saline (control 2) and cisplatin in the course of dehydration (left) colour-coded from 403
blue (hydrated) to red (dehydrated) and in the course of rehydration (right) colour-coded from 404
red (dehydrated) to blue (hydrated). 405
406
Spectra of ssDNA treated with PFB and TMB show more intense A-DNA conformation 407
indicators compared to dsDNA and ssDNA treated with PFB. The asymmetric 408
phosphodiester band at 1225 cm-1 in the hydrated state is shifted towards 1234 cm-1 409
indicating that PFB has stronger interactions with ssDNA compared to dsDNA. Thus, PFB 410
might be more selective towards tumour cells compared to healthy cells. 411
The bands observed in both ssDNA and dsDNA spectra interacted with PFB and TMB
412
between 1450 and 1525 cm-1 are from the pentafluorogroup in the drugs as discussed above.
413
The water content played a role in keeping the B-like DNA conformation for ssDNA for 414
cisplatin, the changes in DNA conformation start to appear while the samples are still in the 416
hydrated state. 417
418
Principle Component Analysis
419
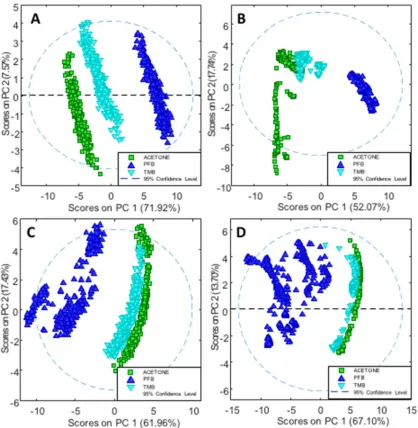
In order to further investigate the effects of PFB and TMB versus the controls, PCA was 420
applied on the second derivative in the spectral region 1400-900 cm-1. For each drug there 421
were three trials and multiple technical replicates for each trail. Cisplatin was not included in 422
the PCA because it was solvated in saline while compounds PFB and TMB were in acetone 423
thus were inappropriate to include in the same model. Figure 6A shows the PC1 versus PC2 424
scores plot depicting ssDNA treated with PFB and TMB and the non-treated DNA (control 425
in acetone/water) in the dehydrated state, while Figure 6B shows the corresponding scores 426
plot for the rehydrated ssDNA. Figure 6C shows the analogous scores plot for the dehydrated 427
dsDNA, while Figure 6D shows the scores plot for the rehydrated dsDNA with and without 428
drug treatment. In all cases, for ssDNA and dsDNA both in the hydrated and dehydrated state, 429
the TMB clusters closely to the DNA/acetone/water control whereas PFB is considerably 430
separated along PC1. The spread observed along PC2 is from different levels of hydration 431
433
Figure 6.A PC1 versus PC2 scores plot depicting ssDNA treated with the PFB and TMB
434
and the non-treated DNA (control in acetone/water) in the dehydrated state. B PC1 versus 435
PC2 scores plot for the rehydrated ssDNA with and without drug treatment. C PC1 versus 436
PC2 scores plot for dehydrated dsDNA with and without drug treatment. D PC1 versus PC2 437
Scores Plot for rehydrated dsDNA with and without the drug treatment. 438
439
Figure 7A shows the loadings plot for the rehydrated ssDNA, while Figure 7B shows the 440
loadings plot for the dehydrated ssDNA. The positive score values are correlated with the 441
negative loadings values because the PCA was performed on the second derivitive spectra. 442
The band at 1084 cm-1 is assigned to the (PO ) from the DNA phosphodiester backbone 443
and appears as a very strong loading associated with the control ssDNA and is absent in the 444
negative loadings associated with the drug incubated ssDNA spectra. The 974 cm-1 band also 445
appears as a strong PC1 loading in the ssDNA control and is assigned to the dianionic 446
phosphodiester vibration of DNA. This loading is not observed in the drug treated controls 447
and demonstrates that both compounds PFB and TMB significantly disrupt the DNA 448
dehydrated dsDNA. In this case the negative loadings are associated with the controls and 450
once again show a strong (PO ) loading at 1084 cm-1 and also a strong band at 974 cm-1, 451
which is absent in the drug incubated dsDNA. The results confirm that the drugs are 452
substantially disrupting the phosphodiester backbone in the dsDNA in a similar way to the 453
ssDNA as peviously shown for Pt103 and cisplatin in cells [27]. In summary the transition 454
from B-DNA to A-DNA is reversible when rehydrating the untreated control DNA, but it is 455
irreversible after treating DNA with the drugs especially PFB, which has a more dramatic 456
effect on DNA thanTMB. When comparing the vibrational modes of nucleobases with the 457
vibrational modes of the backbone, they have lower intensity and it is not possible to track 458
the changes in vibrations of nucleobases or determine if there is any type of binding to the 459
drugs via the DNA bases at this stage. 460
461
ssDNA REH
PC1 (71.92%)
ssDNA DEH
PC1 (52.07%)
dsDNA REH
PC1 (61.96%)
dsDNA DEH
PC1 (67.10%)
1000 1100
1200 1300
1400
Wavenumbers (cm-1)
1
3
6
9
1
1
4
7
1
1
0
1
1
0
8
4
1
0
6
0
99
3
9
7
4
9
3
9
1
2
7
0
1
2
5
0
1
2
2
8
1
0
4
7
A
B
C
Figure 7.A PC1 loadings plot depicting ssDNA treated with PFB and TMB and the non-462
treated DNA (control in acetone/water) in the dehydrated state. The positive loadings are 463
associated with the controls and the negative loadings are associated with the drug inoculated 464
cells. B PC1 loadings plot for the rehydrated ssDNA with and without drug treatment. The 465
positive loadings are associated with the negative scores. The positive loadings are associated 466
with the controls and the negative loadings are associated with the drug inoculated cells. C
467
PC1 loadings plot for dehydrated dsDNA with and without drugs. The positive loadings are 468
associated with the drug inoculated cells and the negative loadings are associated with the 469
control cells. D PC1 versus PC2 loadingsplot for rehydrated dsDNA with and without the 470
drugs. The positive loadings are associated with the drug inoculated cells and the negative 471
loadings are associated with the control cells. 472
4. Conclusions
473
The study shows how infrared spectroscopy can be used to study the interaction between 474
some platinum drugs and DNA. In was found that dsDNA and ssDNA treated with PFB and 475
TMB transform from B-DNA to A-DNA during dehydration and do not return back to the 476
B-DNA conformation upon rehydration. Untreated control DNA in acetone/water, on the 477
other hand, transforms from B-DNA to A-DNA during dehydration but is able to return back 478
to its original conformation upon rehydration. The spectroscopic results indicate that the 479
platinum complexes have a similar effect to cisplatin. This indicates a similar mechanism of 480
interaction with DNA. The ability of infrared spectroscopy to study conformational dynamics 481
opens up a new pathway to explore DNA:drug interactions with the potential to screen for 482
new therapeutic agents. 483
484
Supplementary Materials: The following are available online at www.mdpi.com/xxx/s1, 485
Figure S1: FTIR-IR absorbance spectra of the control with buffer and acetone, DNA-drug 486
samples with cisplatin and PFB 487
Acknowledgements
488
We thank Mr. Finlay Shanks for instrumental support. 489
490
Funding: This study was funded by the Australian Research Council (ARC) (FT120100926).
491
Conflict of Interest: The authors declare no conflicts of interest.
492
Ethical approval: This article does not contain any studies with human participants or
493
animals performed by any of the authors.
494
Informed consent: Not applicable. 495
496
. 497 498
References
499
502 503
1. P Farrell, N. Platinum formulations as anticancer drugs clinical and pre-clinical 504
studies. Current Topics in Medicinal Chemistry 2011, 11, 2623-2631. 505
2. Klein, A.V.; Hambley, T.W. Platinum drug distribution in cancer cells and tumors. 506
Chemical reviews 2009, 109, 4911-4920. 507
3. Wong, E.; Giandomenico, C.M. Current status of platinum-based antitumor drugs. 508
Chemical reviews 1999, 99, 2451-2466. 509
4. Wheate, N.J.; Walker, S.; Craig, G.E.; Oun, R. The status of platinum anticancer 510
drugs in the clinic and in clinical trials. Dalton transactions 2010, 39, 8113-8127. 511
5. Jamieson, E.R.; Lippard, S.J. Structure, recognition, and processing of cisplatin− 512
DNA adducts. Chemical reviews 1999, 99, 2467-2498. 513
6. Jangir, D.K.; Tyagi, G.; Mehrotra, R.; Kundu, S. Carboplatin interaction with calf-514
thymus DNA: A ftir spectroscopic approach. Journal of Molecular Structure 2010, 515
969, 126-129. 516
7. Fanelli, M.; Formica, M.; Fusi, V.; Giorgi, L.; Micheloni, M.; Paoli, P. New trends in 517
platinum and palladium complexes as antineoplastic agents. Coordination Chemistry 518
Reviews 2016, 310, 41-79. 519
8. Gąsior-Głogowska, M.; Malek, K.; Zajac, G.; Baranska, M. A new insight into the 520
interaction of cisplatin with DNA: Roa spectroscopic studies on the therapeutic effect 521
of the drug. Analyst 2016, 141, 291-296. 522
9. Liu, Z.; Liu, R.; Zhou, Z.; Zu, Y.; Xu, F. Structural changes of linear DNA molecules 523
induced by cisplatin. Biochemical and biophysical research communications 2015, 524
457, 688-692. 525
10. Xu, Z.; Brodbelt, J.S. Differentiation and distributions of DNA/cisplatin crosslinks 526
by liquid chromatography-electrospray ionization-infrared multiphoton dissociation 527
mass spectrometry. Journal of the American Society for Mass Spectrometry 2014, 25, 528
71-79. 529
11. Lipiec, E.; Czapla, J.; Szlachetko, J.; Kayser, Y.; Kwiatek, W.; Wood, B.; Deacon, 530
G.B.; Sá, J. Novel in situ methodology to observe the interactions of 531
chemotherapeutical pt drugs with DNA under physiological conditions. Dalton 532
Transactions 2014, 43, 13839-13844. 533
12. Talarico, T.; Phillips, D.R.; Deacon, G.B.; Rainone, S.; Webster, L.K. Activity and 534
DNA binding of new organoamidoplatinum (ii) complexes. Investigational new 535
drugs 1999, 17, 1-15. 536
13. Wheate, N.J.; Collins, J.G. Multi-nuclear platinum complexes as anti-cancer drugs. 537
Coordination chemistry reviews 2003, 241, 133-145. 538
14. Bruijnincx, P.C.; Sadler, P.J. New trends for metal complexes with anticancer 539
activity. Current opinion in chemical biology 2008, 12, 197-206. 540
15. Sirajuddin, M.; Ali, S.; Badshah, A. Drug–DNA interactions and their study by uv– 541
visible, fluorescence spectroscopies and cyclic voltametry. Journal of 542
16. Komeda, S. Unique platinum–DNA interactions may lead to more effective platinum-544
based antitumor drugs. Metallomics 2011, 3, 650-655. 545
17. Klein, A.V.; Hambley, T.W. Platinum drug distribution in cancer cells and tumors. 546
Chemical reviews 2009, 109, 4911-4920. 547
18. Lovejoy, K.S.; Lippard, S.J. Non-traditional platinum compounds for improved 548
accumulation, oral bioavailability, and tumor targeting. Dalton Transactions 2009, 549
10651-10659. 550
19. Liu, Z.; Liu, R.; Zhou, Z.; Zu, Y.; Xu, F. Structural changes of linear DNA molecules 551
induced by cisplatin. Biochemical and biophysical research communications 2015, 552
457, 688-692. 553
20. Hajian, R.; Shams, N.; Mohagheghian, M. Study on the interaction between 554
doxorubicin and deoxyribonucleic acid with the use of methylene blue as a probe. 555
Journal of the Brazilian Chemical Society 2009, 20, 1399-1405. 556
21. Wheate, N.J.; Collins, J.G. Multi-nuclear platinum complexes as anti-cancer drugs. 557
Coordination chemistry reviews 2003, 241, 133-145. 558
22. G. Quiroga, A. Non-classical structures among current platinum complexes with 559
potential as antitumor drugs. Current Topics in Medicinal Chemistry 2011, 11, 2613. 560
23. Lovejoy, K.S.; Lippard, S.J. Non-traditional platinum compounds for improved 561
accumulation, oral bioavailability, and tumor targeting. Dalton Transactions 2009, 562
10651-10659. 563
24. Webster, L.K.; Deacon, G.B.; Buxton, D.P.; Hillcoat, B.L.; James, A.M.; Roos, I.A.; 564
Thomson, R.J.; Wakelin, L.P.; Williams, T.L. Cis-bis (pyridine) platinum (ii) 565
organoamides with unexpected growth inhibition properties and antitumor activity. 566
Journal of medicinal chemistry 1992, 35, 3349-3353. 567
25. Cullinane, C.M.; Gray, P.J.; Webster, L.K.; Deacon, G.B. Nuclear and mitochondrial 568
distribution of organoamidoplatinum (ii) lesions in cisplatin‐sensitive and‐resistant 569
adenocarcinoma cells. Anti-cancer drug design 2001, 16, 135-141. 570
26. Czapla-Masztafiak, J.; Nogueira, J.J.; Lipiec, E.; Kwiatek, W.M.; Wood, B.R.; 571
Deacon, G.B.; Kayser, Y.; Fernandes, D.L.; Pavliuk, M.V.; Szlachetko, J. Direct 572
determination of metal complexes’ interaction with DNA by atomic telemetry and 573
multiscale molecular dynamics. The journal of physical chemistry letters 2017, 8, 574
805-811. 575
27. Haputhanthri, R.; Ojha, R.; Izgorodina, E.I.; Guo, S.-X.; Deacon, G.B.; McNaughton, 576
D.; Wood, B.R. A spectroscopic investigation into the binding of novel platinum (iv) 577
and platium (ii) anticancer drugs with DNA. Vibrational Spectroscopy 2017, 92, 82-578
95. 579
28. Sherman, S.E.; Gibson, D.; Wang, A.; Lippard, S.J. X-ray structure of the major 580
adduct of the anticancer drug cisplatin with DNA: Cis-[pt (nh3) 2 (d (pgpg))]. Science 581
1985, 230, 412-417. 582
29. Franklin, R.E.; Gosling, R.G. Molecular configuration in sodium thymonucleate. 583
Nature 1953, 171, 740-741. 584
30. Wood, B.R. The importance of hydration and DNA conformation in interpreting 585
31. Buxton, D.; Deacon, G.; Gatehouse, B.; Grayson, I.; Thomson, R.; Black, D. 587
Organoamidometallics. I. Syntheses of [n, n′-bis (polyfluorophenyl) ethane-1, 2-588
diaminato (2-)] platinum (ii) complexes by decarboxylation. Australian journal of 589
chemistry 1986, 39, 2013-2036. 590
32. Kushev, D.; Gorneva, G.; Enchev, V.; Naydenova, E.; Popova, J.; Taxirov, S.; 591
Maneva, L.; Grancharov, K.; Spassovska, N. Synthesis, cytotoxicity, antibacterial and 592
antitumor activity of platinum (ii) complexes of 3-aminocyclohexanespiro-5-593
hydantoin. Journal of inorganic biochemistry 2002, 89, 203-211. 594
33. Buxton, D.; Deacon, G.; Gatehouse, B.; Grayson, I.; Black, D. 595
Organoamidometallics. Ii. Decarboxylation syntheses and structures of [n, n-596
dimethyl-n'-(polyfluorophenyl) ethane-1, 2-diaminato (1-)] platinum (ii) complexes. 597
Australian Journal of Chemistry 1988, 41, 943-956. 598
34. Cherng, J.Y. Investigation of DNA spectral conformational changes and polymer 599
buffering capacity in relation to transfection efficiency of DNA/polymer complexes. 600
Journal of Pharmacy & Pharmaceutical Sciences 2009, 12, 346-356. 601
35. Adam, S.; Bourtayre, P.; Liquier, J.; Taboury, J.; Taillandier, E. Poly [d (a‐t)‐cs+] 602
conformations studied by ir spectroscopy. Biopolymers 1987, 26, 251-260. 603
36. Bourtayre, P.; Pizzorni, L.; Liquier, J.; Taboury, J.; Taillandier, E.; Labarre, J. Z-form 604
induction in DNA by carcinogenic nickel compounds: An optical spectroscopy study. 605
IARC scientific publications 1984, 227-234. 606
37. Al-jorani K, R.A., Haputhanthri R, Deacon G B, Li H L, Cullinane C, Wood B R. 607
Atr-ftir spectroscopy shows changes in ovarian cancer cells after incubation with 608
novel organoamidoplatinum complexes. Analyst 2018. 609
38. Theophanides, T. Fourier transform infrared spectra of calf thymus DNA and its 610
reactions with the anticancer drug cisplatin. Applied Spectroscopy 1981, 35, 461-465. 611
39. Carpenter, D. Reputation and power: Organizational image and pharmaceutical 612
regulation at the fda. Princeton University Press: 2014. 613
40. Whelan, D.R.; Bambery, K.R.; Heraud, P.; Tobin, M.J.; Diem, M.; McNaughton, D.; 614
Wood, B.R. Monitoring the reversible b to a-like transition of DNA in eukaryotic 615
cells using fourier transform infrared spectroscopy. Nucleic acids research 2011, 39, 616
5439-5448. 617