Properties of Anomalous and Type II Cepheids in the Small and
Large Magellanic Clouds
Monika I.Jurkovic1,2,and Martin A. T.Groenewegen3,
1Astronomical Observatory of Belgrade (AOB), Volgina 7, 11 060 Belgrade, Serbia
2Konkoly Observatory, Research Centre for Astronomy and Earth Sciences, Hungarian Academy of
Sci-ences, H-1121 Budapest, Konkoly Thege Miklós út 15-17, Hungary
3Koninklijke Sterrenwacht van België (KSB), Ringlaan 3, B-1180 Brussels, Belgium
Abstract.The Small Magellanic Cloud (SMC) and Large Magellanic Cloud (LMC) give us the possibility to study individual variable star types in a new way. Literature data provide us with photometric information about objects from the ultraviolet to the infra-red. Here we would like to show the results of our study of 335 Anomalous and Type II Cepheids in the SMC and LMC detected by OGLE. Using the code More of DUSTY (MoD), a modified version of the DUSTY radiative transfer code, and the assumption that our objects are at a known distance, luminosity and effective temperature were deter-mined. From these data the Hertzsprung-Russell diagram of these objects was compared with the theoretical models. The radius and masses of the examined stars was estimated, too. In the end, we have given the period-luminosity relations for the Anomalous and Type II Cepheids.
1 Introduction
The goal of this work was to these stars using the physical effective temperatures (Teff) and lumi-nosities (L), instead of the previously used color-magnitude diagrams (CMD). This gives a direct comparison with the results of the evolutionary models. In the course of our research we have in-cluded the examination of infrared (IR) excess, and the role of binarity, as well. Our detailed results will be published in two recent papers ([3, 4]). We have extended our sample to the semi regular variables, also identified as long period variables (LPVs) in OGLE-III (see [5]).
Type II Cepheids (T2Cs) are low mass (∼0.5−0.6M) pulsating stars, and we follow the classifi-cation into subgroups given in the OGLE-III catalog: BL Her (BLH): 1−4 days; W Virginis (including peculiar W Virginis, (p)WVir: 4−20 days; RV Tauris (RVT): 20−70 days. They are useful distance indicators withLandTeffbetween the RR Lyrae, Anomalous Cepheids (ACs), and Classical Cepheids (e.g., see [15]).
The ACs are also pulsating stars with pulsating periods ranging from 0.3 to 2.4 days, which over-laps in part with the RR Lyrae and BL Her types. Their average mass is∼1.2M([1]). They pulsate in the fundamental mode and first overtone, and these subgroups form different period-luminosity (PL) relations, nevertheless they seem not to reach into the Classical Cepheids region.
Table 1.The distribution of the T2Cs and ACs in the OGLE-III catalog of the SMC and LMC.
BL Her (p)W Vir RV Tau AC
SMC 17 17 9 6
LMC 64 97 42 83
2 The sample
The 335 stars were taken from the OGLE-III catalog ([11–13]). For the distribution among the diff er-ent types, see Table 1.
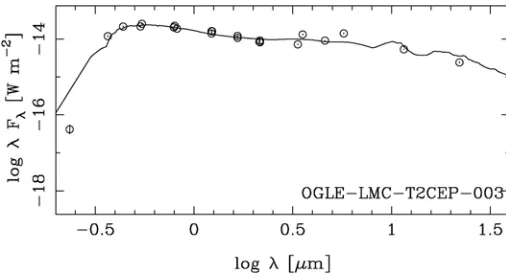
The spectral energy distributions (SEDs) for the 335 stars, as presented in [3], was constructed us-ing the optical, infrared and near-infrared data from the catalogs available at VizieR1, which included: OGLE, EROS, MACHO, MCPS, DENIS, 2MASS, 2MASS 6X, IRSF, LMC Synoptic Survey, VMC Survey, WISE, Akari, IRAC.
Figure 1.The SED for the OGLE-LMC-T2CEP-001, showing a normal distribution.
Figure 2.The SED for the OGLE-LMC-T2CEP-003 with a visible IR excess.
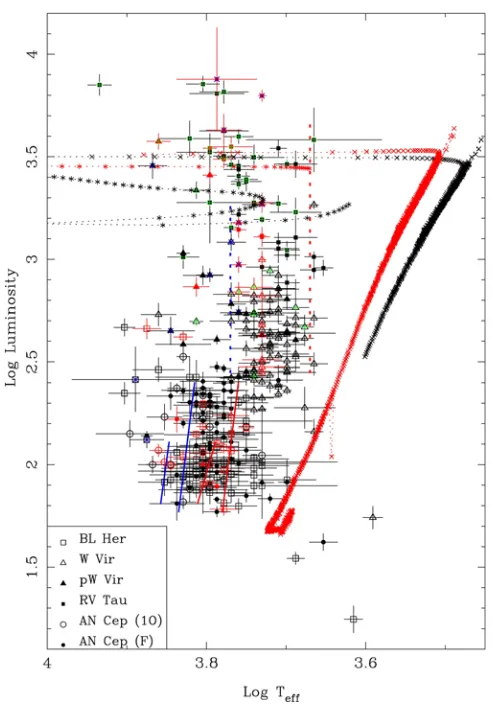
Figure 3. The HRD constructed from the modelled SEDsTeff and luminosity. Stars in the SMC are plotted in
red. Stars with an IR excess are marked by a green plus-sign. Stars which show eclipsing or ellipsoidal variations according to OGLE are marked by a blue cross. The tracks plotted with×are the lowest initial mass tracks of [14] for the LMC (0.945M) and SMC (0.89M, in red). The final masses are 0.555 and 0.558M, respectively.
The tracks plotted with an asterisk symbol are the lowest initial mass tracks of [10] for a metallicity ofZ=0.01 (1.0M, current mass 0.534M) andZ =0.001 (0.9M, current mass 0.536M, in red). In both tracks every
tick mark represents 500 years of evolution. The blue and red edges of the fundamental (FU) mode instability strip of BLH (between logL∼1.81−2.1, for a mass of 0.65M) and FU ACs (between logL ∼1.77−2.4)
are indicated by the solid line (see text). The vertical dotted lines indicate the location of most of the variables at higher luminosity (see text). Taken from [3], with the permission of the authors.
Figure 4.Dependence of the derived dust optical depth against logL. Stars in the SMC are plotted in red. Stars with an IRS spectrum are marked by a green plus-sign. Stars with a detectable IR excess are labelled by their identifier. Taken from [3], with the permission of the authors.
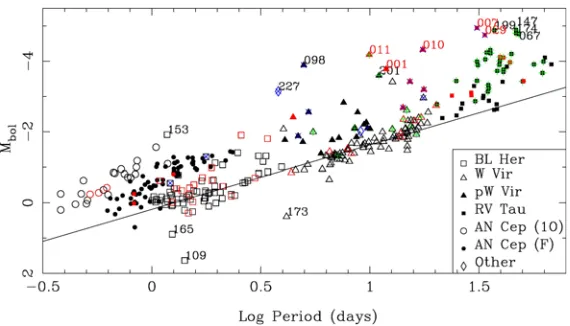
Figure 5.The bolometric magnitude vs. logP PLrelation tor the T2Cs and ACs in the SMC and LMC. Taken from [4] with the permission of the authors.
3 HRD
Figure 3 is the physical Hertzsprung-Russell diagram (HRD) of the T2Cs and ACs in the SMC and LMC. For the detailed description of the symbols, see the caption and [3].
4 The IR excess
Among the examined stars we have found that∼60% of RVT, and∼10% of the WVir (including the peculiar WVir), show IR excess; see Figure 4. The distributions among subtypes looks like this: • ACEP: 0/76;
• (p)WVir: 8/90 for WVir and 3/24 for pWVir; • RVT: 30/52.
It was not surprising to find IR excess among the RVT stars, because they are thought to be pAGB objects. What was surprising is the detection of IR excess among the WVir stars below luminosities predicted by single star evolutionary tracks. This IR excess was independently found by [7–9] to be dusty post-RGB stars and possibly related to binary evolution.
5 The PL relation
Using the gathered data we were able to construct the bolometric magnitude vs. logP PLrelation for the T2Cs and ACs in the sample; see Figure 5 and [4].
6 Conclusion
We have determined the luminosities and effective temperatures of the sample of 335 T2Cs and ACs in the SMC and LMC. This investigation provided us with data to create the HRD that could be directly compared to the evolutionary model results.
We have derived thePLrelation for all the stars in the sample.
We have found infrared excess in 10% of the W Vir stars and 60% of the RV Tau stars. The findings by [9] of the existence of (pulsating) stars that have a lower luminosity value than the luminosity predicted if they would have been evolving as a single star, and that they show IR excess connected to binarity, are also confirmed by us.
For further details, please, look into our articles [3] and [4].
Acknowledgments: M.I.J. acknowledges financial support from the Ministry of Education, Science and Techno-logical Development of the Republic of Serbia through the project 176004, and the Hungarian National Research, Development and Innovation Office through NKFIH K-115709.
References
[1] Fiorentino, G., & Monelli, M., A&A,540, A102 (2012) [2] Groenewegen, M. A. T., A&A,543, A36 (2012)
[3] Groenewegen, M. A. T., & Jurkovic, M. I., A&A, in press (arXiv:1705.00886) (2017a) [4] Groenewegen, M. A. T., & Jurkovic, M. I., A&A, in press (arXiv:1705.04487) (2017b) [5] Groenewegen, M. A. T., & Jurkovic, M. I., inthese proceedings
[6] Ivezi´c, Ž., Nenkova, M., & Elitzur, M.,DUSTY user manual, (arXiv:astro-ph/9910475) (1999) [7] Kamath, D., Wood, P. R., & Van Winckel, H., MNRAS,439, 2211 (2014)
[8] Kamath, D., Wood, P. R., & Van Winckel, H., MNRAS,454, 1468 (2015) [9] Kamath, D., Wood, P. R., Van Winckel, H., & Nie, J. D., A&A,586, L5 (2016) [10] Miller Bertolami, M. M., A&A,588, A25 (2016)
[11] Soszy´nski, I., Udalski, A., Szyma´nski, M. K., et al., AcA,58, 293 (2008) [12] Soszy´nski, I., Poleski, R., Udalski, A., et al., AcA,60, 17 (2010)
[13] Soszy´nski, I., Udalski, A., Szyma´nski, M. K., Kubiak, M., Pietrzyñski, G., Wyrzykowski, Ł., Ulaczyk, K., & Poleski, R., et al., AcA,60, 91 (2010)