Study of Surface Roughness by Stylus
Profilometer and Binary Laser Speckle B/D
Counting Techniques
*R.Balamurugan1, S.Muruganand2
Assistant Professor, Dept. of Physics, Kumaraguru College of Technology, Coimbatore, Tamilnadu, India1
Assistant Professor, Dept.of Electronics & Instrumentation, Bharathiar University, Coimbatore, Tamilnadu, India2
ABSTRACT: In this paper, surface roughness measurements by non contact method of Binary Speckle Pattern (BSP) and contact method of stylus profilometer have been presented. When an optically rough surface is illuminated with a highly coherent source of Laser, the granular bright and dark pattern known as speckle is observed. Intensity of the Speckle image depends on the surface roughness and carries information about it. The speckle images obtained by He-Ne laser with CCD camera were binarized and examined. To evaluate the surface roughness, pixel ratios of bright and dark regions (B/D counting) of various speckle images of different surface roughness are used. The results are compared with the surface roughness parameter Ra obtained from stylus profilometer.
KEY WORDS:Stylus profilometer, Binary speckle B/D counting, surface roughness.
I.INTRODUCTION
In many industrial applications such as production and processing of metals, semiconductors (wafers), ceramics, paper and plastics etc., the roughness measurement are an essential part of the quality inspection. Surface roughness may be measured by electrical or optical means. The most widely used method for surface roughness measurement in manufacturing is the mechanical profilometer. In this method, the stylus of the device is drawn across the surface of the part to assess the surface roughness. It measures the average height deviations from a reference line independent of correlation length of the surface. The resolution of this instrument depends mainly on the diameter of the measuring needle tip [1]. Therefore, this system is not suitable for applications, where the scratch generated by the stylus movement is not acceptable. Another problem with the stylus measurement technique is the relation between the size of the stylus radius and the crevices of the surface. If the crevice is narrow such that the stylus cannot penetrate all the way to the bottom, the measurement will not be accurate. Considering these drawbacks [2], the need for non contact techniques for measurement of surface roughness becomes apparent. The most obvious parameter is the average departure of surface height from its mean value, usually called the average roughness or the center line average (CLA) roughness.
The root mean square (RMS) height of the surface is given by: σ=<h > s ….(1)
If σ is much less than λ and the surface has a Gaussian height distribution, the intensity of the specular beam is given
by:
I = I exp ....(2)
Where, θ is the angle of the incident ray. Io is the total reflectance of the rough surface. Io is found by measuring the
total light intensity scattered into all directions, including the specular light. Isp is the specular beam intensity. As
surface roughness increases, the pattern of the scattered radiation tends to become more diffuse. Common optical methods for contouring include use of holographic interferometry, Moiré, fringe projection and other methods [3]. The ease with which a diffuse surface can be measured has been significantly increased by the development of the moiré and fringe projection methods. Two-dimensional (2-D) moiré fringe patterns are useful to extract qualitative information but it is sometimes tedious and time-consuming to evaluate quantitative data from the fringe patterns. Use of fringe projection to determine surface roughness was first presented by Rowe and Welford [4]. Windecker developed a fringe projection method for surface roughness measurement and optometry of engineering and biological objects [5]. Zhang used the fringe projection method by using the spatiotemporal phase unwrapping for the surface profiling [6]. Laser speckle interferometry has been used as a sensitive tool for measuring surface roughness [7]. Different techniques have been developed based on studying the scattering properties of light [8].The usefulness of these techniques can be greatly enhanced by the development of algorithms that correlate surface roughness with the light pattern reflected from the surface. This pattern appears to be randomly distributed and is generally explained by its statistical distribution in the image [9]. The speckle pattern, produced by surface roughness has prompted many investigators to use this phenomenon to measure surface roughness [10]. Recently, different correlation methods are used to evaluate the speckle patterns and correlate these patterns to surface roughness [11]. The measurement of roughness on machined surfaces is of great importance for manufacturing industries as the roughness of a surface has a considerable influence on its quality and function of products [12].
II. STYLUS PROFILOMETER METHOD
The stylus may be attached to a piezoelectric crystal or to a small magnet that moves inside a coil, inducing a voltage that is proportional to the magnitude of the substrate variations. The stylus must have a resolution of 25.4 nm (1 µin) to read accurately in the most common ranges. As the stylus is drawn over the irregularities of a surface by the traverse unit, the stylus is displaced, causing the ferrite rod to move between the coils. The coils form part of an inductance bridge circuit which is balanced when the stylus is in a neutral position. Stylus profile internal parts are shown in Fig.2.
Fig.2. Stylus probe of mechanical profilometer
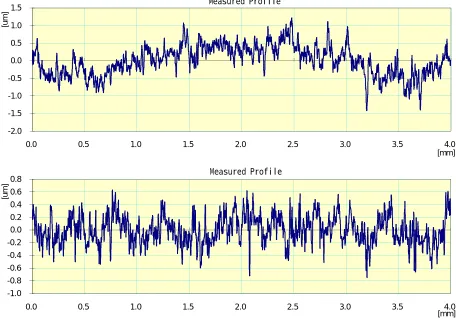
The carrier signal is amplified and de-modulated to yield a signal representing a surface profile which may be output to a chart recorder or used to evaluate some parametric assessment of surface roughness given on a meter or visible display unit. Only two profile measurement images of stylus profilometer have been shown in Fig. 3(a) &3(b).
Fig. 3(a) &3(b) Stylus profile measurements
These devices are very sensitive, and the diamond stylus could scratch the surface particularly when the materials are soft. A common drawback of this approach is the small area using which the roughness is evaluated at any time and also the transducer is very sensitive and the stylus tip is fragile. Therefore, the instrument must be handled carefully in a fairly, clean environment. Another problem with the stylus measurement technique is the size of the stylus radius and the crevices of the surface. If the crevices are narrow such that the stylus cannot penetrate all the way to the bottom, the measurement will not be accurate and cannot be a true representation of the surface.
III. LASER SPECKLE METHOD
Different rough surfaces of aluminium are used as rough objects. A mechanical profilometer called stylus apparatus is used to measure the average surface roughness. The experimental setup used for recording of speckle images corresponding to different roughness’s of aluminium surfaces. A collimated laser beam emitted from a He–Ne laser of
power 10 mw and λ= 633 nm is used for illumination of optical system. The light is incident upon the rough object
covering a certain cross-sectional area of diameter D.The scattered light is recorded using a CCD camera placed at a large distance Z from the rough surface as compared with distance D. So, a low numerical aperture NA = D/2Z = 0.01 is maintained constant during the recording of all studied surfaces.
B/D count method
The recorded images were converted in binary images. The number of bright (B) and dark (D) pixels and the ratio B/D are related with the effects of the surface roughness on the speckle pattern.
-2.0 -1.5 -1.0 -0.5 0.0 0.5 1.0 1.5
0.0 0.5 1.0 1.5 2.0 2.5 3.0 3.5 4.0
[u
m
]
[mm]
Measured Profile
-1.0 -0.8 -0.6 -0.4 -0.2 0.0 0.2 0.4 0.6 0.8
0.0 0.5 1.0 1.5 2.0 2.5 3.0 3.5 4.0
[u
m
]
[mm]
With the digital image of speckle patterns the calculation of B/D ratio is performed using an image processing algorithm implemented in MATLAB. Images in grayscale should be converted in a binary image. For each pixel of this image a pixel value has been assigned within the grayscale. The binarization procedure is performed using a threshold value, the so-called mean threshold. If the pixel value is greater than the mean threshold it will be converted into a pixel with value 0 to compose the binary image, the so-called bright (B) pixel. If the pixel value is lower than the mean threshold it will be converted into a pixel with value 1 to compose the binary/image, so-called dark (D) pixel. The number of bright (B) and dark (D) pixels is computed and the ratio B/D is calculated.
IV. RESULT AND ANALYSIS
Speckle images are converted into binary (0,1) images, in which zero is taken to represent the background and one is used to represent the spatial information of speckle grains. The intensity below 50% is considered as background. The numerical image of aluminium speckle represented with roughness Ra value 0.10µm using a matrix of 14 × 10 for the selected area of image. The ratio taking AS to represent the patches of the speckle image for the selected area and AT to represent the total part of the selected image, the ratio AS /AT is computed. Effective area of the speckle patches AS = 18 and the total area AT = 140. We obtain the result for the effective signal is AS /AT =18/140 =0.12 corresponding to Ra is 0.10µm. Similarly, we calculate the AS /AT =62/140 =0.44 corresponding to Ra is 0.17µm, AS /AT =87/140=0.62 corresponding to Ra is 0.23µm, AS /AT =122/140 =0.87 corresponding to Ra is 0.26µm and so on. Average area of dark regions decreases exponentially with increasing Ra values. Determination of the surface roughness from binary speckle pattern images can be carried out in two techniques. (i) Total area of bright and dark pixels or their ratios used in anticipation of the surface roughness parameter value reaches to the value of wavelength of laser used or mean values of area of bright. (ii) Dark regions up to three times the value of the wavelength of He–Ne laser are used.
It is important to note that the threshold value plays a crucial role for the B/D technique. Depending on the threshold, more or less bright pixels can be recognized and the value of ratio B/D can vary. Here 0.5 taken as threshold value. Speckle patterns of some samples are shown in Fig.4 (a) & 4(b) and the result are satisfied within the limit of error.
Fig.5. B/D Counting Vs Roughness
It is clear from the Fig.5. that the Roughness value increases with increasing B/D counting ratio up to certain values depends on the wavelength of the source and surface properties of the specimen. It was found that there is a good relationship between bright and dark regions and their ratios obtained from this method to evaluate the surface roughness Ra [13], particularly in the range of λ<Ra>2λ where λ is He–Ne laser wavelength.
IV.CONCLUSION
The proposed method has great potential to be used for in-process measurement and automation due to the simplicity of the required optical system. It is worth to mention that our experiment was performed using a laser source with controlled intensity. The B/D ratio results are in good agreement with the stylus profilometer measured values. It is found that the ratio between bright and dark regions of the binarized speckle patterns exponentially increases when the surface roughness increases.
REFERENCES
[1] O’Donnell KA. Effects of finite stylus width in surface contact Profilometry. Appl Opt 1993; 32:4922. [2] Whitehouse DJ. Handbook of surface and nano metrology London: Institute of Physics Publishing; 2003. [3] Yatagai T, Idesawa M. “Automatic fringe analysis for Moire´ topography”, Opt Laser Eng 1982;3:73–83.
[4] Rowe SH, Welford WT. “Surface topography of non-optical surface by projected interference fringes”, Nature (London) 1967;216:786–7. [5] Windecker R, Tiziani HJ. “Topometry of technical and biological objects by fringe projection”. Appl Opt .1995, 34:3644–50.
[6] Zhang H, Wu F, Lalor MJ, Buton DR. “Spatiotemporal phase unwrapping and its application in fringe projection fiber optics phase shifting profilometry”, Opt Eng 2000; 39:1958–64.
[7] Tiziani, H. J., “Optical Methods for Precision Measurements”, Optical and Quantum Electronics, Vol. 21, 1989, pp. 256–259.
[8] Ramesh, S. and Ramamoorthy, B., “Measurement of Surface Finish Using an Optical Diffraction Technique,” Wear, Vol. 195, 1996, 148– 151.
[9] Dainty, J. C., Ed. Laser Speckle and Related Phenomena, Springer-Verlag, NY, 1984.
[10] Briers, J. D., “Surface Roughness Evaluation,” Sirohi, R. S., Ed., Speckle Metrology, Dekker Inc., NewYork, 1979, pp. 11–49.
[11] Toh, S. L., Shang, H. M., and Tay, C. J., “Surface-roughness Study Using Laser Speckle Method,” Journal of Optics and Lasers in Engineering, Vol. 29, 1998, pp. 217–225.
[12] B. Dhanasekar, N.K. Mohan, B. Bhaduri, B. Ramamoorthya, “Evaluation of surface roughness based on monochromatic speckle correlation using image processing”, Precision Engineering 32, 2008, 196-206.
[13] R. Balamurugan & S. Muruganand, “Displacement Measurement and Study of Surface Roughness using Laser Speckle Technique”, Journal of the Institute of Industrial Applications Engineers Vol.3, No.2, 2015, pp.96–99.
0 1 2 3 4 5 6 7 8
0 0.05 0.1 0.15 0.2 0.25 0.3
B
/D
C
o
u
n
t