Centre for Advanced Spatial Analysis University College London
1-19 Torrington Place Gower Street
London WC1E 6BT Tel: +44 (0) 171 391 1782 Fax: +44 (0) 171 813 2843 Email: [email protected] http://www.casa.ucl.ac.uk
http://www.casa.ucl.ac.uk/virtual_regeneration.pdf
Date: October 1998 ISSN: 1467-1298
ABSTRACT
Regenerating our increasingly polluted, worn-out urban infrastructure is becoming the singly most important challenge facing our cities. Simon Doyle and Michael Batty explain how spatial information technologies and online laboratories can enable many diverse interests to participate in creating informed planning policies that best address these issues.
Western cities, like their populations, are ageing. Their renewal in ways that alleviate the pollution
and conflict over the use of public resources that increasing wealth is bringing will be the critical
planning problem of the new millennium. In Britain, this debate is currently nowhere more
polarized than around the issue of where we should accommodate over 4 million new households
which will be created over the next 20 years due to the demand for new lifestyles in the wake of the
break-up of the nuclear family. Whether or not these should be housed on greenfield or brownfield
sites, on the edge of cities or within existing towns, is the focal issue.
These kinds of problem cannot be tackled by expert professionals using single disciplinary sciences.
They are intrinsically systemic, require methods which integrate engineering with economics and
the sciences of the natural environment, and are set within a social and organisational milieu which
embraces many different, often conflicting ethical and political perspectives. The taskforce led by
Lord Rogers which is inquiring into the problems of bringing brownfield sites back into residential
use has to grapple not only with whether it is scientifically and even economically feasible to
decontaminate such sites but whether such sites are likely to be available for housing. This involves
questions of ownership and the market for land, whether or not such sites are near to existing (and
future) centres of employment, transportation and retailing, and whether or not such in-city
development is able to preserve and enhance the green space so necessary for urban living.
Hitherto, these problems have been tackled using the Town and Country Planning system. But as
cities have become more complex and diverse, it has been increasingly difficult to integrate the
requisite science with the requisite politics necessary to produce effective and workable plans. New
technologies however seem to hold the key to effective action. In the last 10 years, spatial or
geographic information systems (GIS) have emerged which are able to integrate many different
types of socio-economic, physical and bio-ecological data in ways that make these comparable,
even commensurable. Representing such data digitally is making such integration possible,
providing a more systemic understanding of urban problems. Advances in visualising data using
various types of multimedia such as 3-d fly-through, and textual/photo-realistic enhancement, are
forcing such systems towards virtual reality (VR), thus adding new ways of incorporating
2
At the same time, such software systems are fast moving to the net and it is this ability to interact
with such systems remotely that holds the key to new ways of developing appropriate solutions.
The idea of virtual laboratories which bring experts at remote locations together to share data and
expertise and to develop new levels of collaborative science, is not new but extending the idea to
involve a very wide public with widely different levels of interest and skill concerning urban
problems which can only be resolved consensually, is. This is only now becoming possible due to
the massive proliferation of the internet and clever ways of treating problems that intrinsically
involve participation and cannot be addressed without it.
Urban environmental problems require many different types of data concerning the way economic
activities in cities compete for land, thus generating both benign and polluting impacts whose
effects vary widely on different groups within the population. Hitherto, these effects have either
been ignored or at best handled somewhat badly by the existing urban planning system which has
been rarely provided with enough intelligence concerning the way different environmental systems
interact. Widening the scope of such concern has not been easy using traditional public participation
but the idea that such issues might be put into the much domain of the internet is being seized upon
as a means of widening access to many interested parties. many web sites now exist which aim to
involve, albeit passively, a wider public in such issues.
In London, we are going well beyond this kind of dissemination which at best raises awareness. We
are devising a system based on information through which any user can make sense of the urban
environment while beginning some rudimentary data analysis. We are structuring the system so that
users can interact with it on different levels, dependent upon their interest and expertise. Its
organisation is modular, built from a loose confederation of other systems linked across the net. It is
hierarchical in that different groups have different levels of access. It is interactive in that users can
upload and down load data but more importantly engage in dialogue with one another through
bulletin board-like conversations. The system proffers potential users a range of tools to engage in
further analysis of data but also to visualise data in different modes - as maps, as 3-d models and so
on. At the same time, it offers users the power to pose and react to policy questions and to even
begin the construction of policies that address the critical problems raised. The pilot model from
which the illustrations here are drawn operates at all scales from the metropolitan-wide area of
Greater London itself down to specific sites at the level of building parcels and plots.
At the heart of the system lies a spatial database which is accessed using a GIS, configured in such a
way that it is able to deliver information to users across the internet in response to remote queries of
the data. In fact, as the system is modular, it extends into a series of GISs which draw on different
seamless fashion. It is supported by sets of functions, some custom-built but many of which are part
of the standard GIS toolbox. These enable users to map and visualise different data sets, perform
queries of the data and extract specific features while extending this capability to simple forecasts
of trends and assessments of impacts.
The system is accessible through any standard internet browser which makes use of the world wide
web. The 2-dimensional map lies at the core of the system but the ability to view data in 3d or as
photographic images, video clips or abstracted animations is standard through any path the user
might take in viewing data as we can show for many different areas of London such as central
Westminster.
We can illustrate best how the system is useful for urban regeneration using some of the case
studies currently part of the framework. At the metropolitan level, data from the 1991 Census of
Population, from Ordnance Survey and other data providers in the quasi-public domain are part of
the system. We also have extensive data on local pollution, from the London Research Centre’s
Greater London Atmospheric Emissions database, and we have linked the system online to the
National Air Quality Information Archive web pages which contain data on pollutants recorded at
68 sites across London. This data is available hourly for 5 major pollutants and 4 particulates. It is
possible for any user to download this data and to use standard GIS and CAD tools to display it in 2-d and/or 3-d. The concentration of nitrous oxides (N0x) can be visualised as a contour map or as a 3-d surface. Visualising data in this way brings many advantages. At one level, it is a reality check
in that errors in data can be spotted while the more important policy use is in setting up a visual
base of data which informs discussion. There are important scientific problems in representing data
at different scales but in the London context, the high concentrations in Hackney, Brent and
Croydon require explanations which involve synthesising local knowledge of these places with the
4
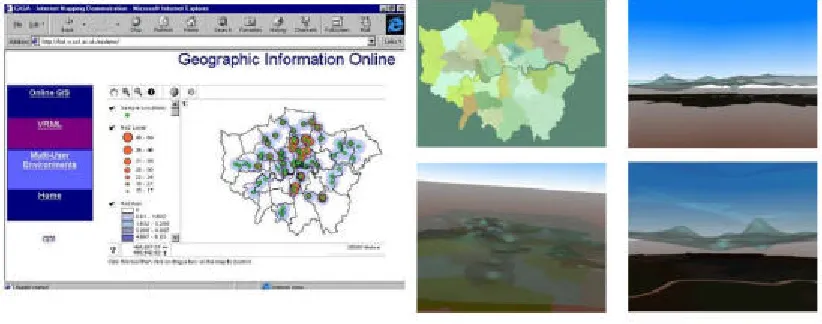
Fig 1: How a User Interacts with the System Remotely
The map of Parliament Square on the left is the output from the internet GIS displayed on the ‘client’ which gives the user options for viewing different ‘layers’ of data. When an option is selected, this request is sent to the central data base at a remote location on the ‘host’, is processed and back comes the map. If the user activates a ‘hotlink’ on the map, then another frame of information is opened up. On the right of the map, this is displayed as a 3-d block model of central Westminster and the user can then ‘navigate’ around it using the controls beneath.
Fig 2: Visualising Air Pollution Surfaces across Greater London
These kinds of metropolitan-wide analysis of pollution only become useful when they are
contrasted against other data with a view to exploring the way different sectors impact and interact
on one another. One of the great advantages of using GIS as the engine to store and drive the query
and display of spatial data is that the idea of treating different data by different map layers enables
immediate comparisons to be made. GISs are very highly tuned to make such comparisons, and
there are many standard functions which can be used to combine, transform, aggregate, exaggerate
various data layers, thus providing new patterns which can generate new insights about the
problems of the urban environment. A useful example which clearly demonstrates this as well as
showing how important it is to provide links between demography, health, pollution and transport
involves the delivery of health case in the Riverside Health Trust area (which covers the boroughs
of Westminster, Kensington, Hammersmith and part of Ealing). The Trust routinely records the
trips made from local district nurse stations to patients requiring home-based care; one of their
objectives was to minimise these trips in the first instance because of concerns for both the pollution
being added by car trips as well as the monetary expenditure on fuel and vehicles, and the time
spent travelling. Various options were being considered ranging from car pooling by nurses to the
wholesale relocation of nurses’ stations as well as providing different levels of care to patients in
the home. What the system enabled us to do was to show how different types of information are
correlated with such trips, such as showing how other emissions data relates to the trip pattern,
showing how the density of nurses visits to patients could be correlated with health data from the
1991 census, but most importantly it provided a method for showing how the pattern of trips might
be radically reorganised by linking the nearest nurses to the nearest patients.
The almost chaotic pattern of trips in that area of London is contrasted against the pattern that is
feasible by reallocating nurses to patients to minimise distance (and hence pollution generated and
money expended). Standard functions in GIS are models that enable such spatial reallocation and in
this case, by reallocating trips, around £1m can be saved from the travel budget for the health
authority simply by changing who visits who, with commensurate reductions in pollution and this is
before any other changes in location are considered. This example shows how the system is able to
handle data of different types at different scales, metropolitan-wide data providing a frame for local
data.
Our last example brings the discussion down to the local scale of brownfield sites. In Kings Cross,
developers are excavating a site for the new Channel Tunnel Raillink. The noise and dust from the
excavations are considerable, and although this is typical of any large scale development on
contaminated disused land, it demonstrates the kinds of problems that will be normal if a large scale
redevelopment programme to reclaim inner city sites of this kind for housing is begun. In these
excavations, Camden are monitoring pollution levels for this reclamation and we visualise these by
6
from the sites but it also shows how pollution clusters are formed. From these contours, different
levels of acceptability might be implied and using the internet GIS, users can query what buildings
and land uses are contained within and without certain levels. For example, by defining a certain
standard, the buildings within the affected area which infringes the standard can be identified and
the user can compute the affected population and other characteristics of the impact from related
data. Imagine this process being operated on a wide area with multiple types of data and multiple
viewpoints concerning acceptability being considered and this gives some idea of the potential of
this approach to exploring and resolving urban environmental problems.
Fig 3: Patterns of Health Care Delivery in Inner London
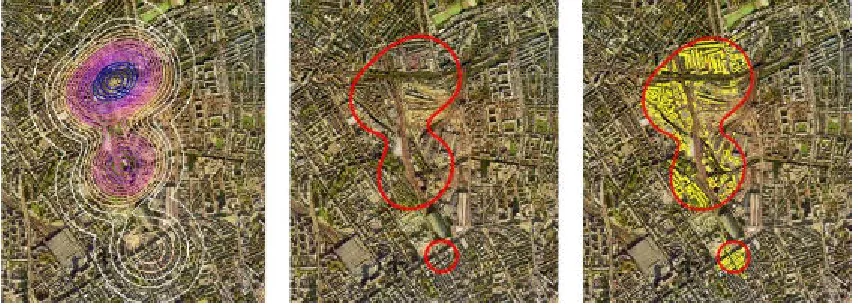
Fig 4: Pollution Generated from the Redevelopment of Kings Cross Site
The concentration of dust levels on the site of the new Channel Tunnel Raillink is visualised by diffusion contours (left). A contour above which levels of dust are unacceptable is identified (centre). The buildings that fall within this contour from which we can compute the ‘at-risk’ population, can then be selected (right).
The kind of environmental problems that can be explored depend ultimately on how the user
articulates the problem in the light of data and information within the system. Its various elements
are also tied together through different forums for interaction, based on opportunities for users to
query the system through email-like requests and to peruse such information which is posted on
bulletin boards, responding if appropriate. We envisage that dialogue between users will begin and
that policy maps would emerge from structured and focused discussion concerning environmental
issues. Ways in which users might sketch their ideas visually from remote sites have been
developed through new extensions to the GIS software. Dialogue is currently entered, using the
Online Planning Forum which is at present coupled to the system. and this is being rapidly extended
to embrace other relevant interests and decision-making structures. Through its web pages, the
system is linked to many other relevant sites, for example to the Friends of the Earth, to the
Department of Environment, Transport and the Regions, to the Sustainable London Trust and so on,
enabling users to search out the background to environmental issues but within the perspective of
8
Fig 5: Dialogue and Discussion within the Environmental Information System
Users are able to browse a library of different requests and responses concerning urban environmental problems, and to submit their own comments, thus enabling ongoing discussion of important issues and policies to begin
These are the tools that we consider should be used in exploring questions about urban
environments in an integrated way which cross disciplinary, professional, and political divides. We
would argue that if the quality of life in our cities is to be improved so that all benefit, then it is
intrinsically participatory systems like these that must be developed. Only then might we avoid
what Garret Hardin called the ‘Tragedy of the Commons’, where public resources are compromised
by the individual over-exploitation of land use, with pollution impacts that affect us all. In the
forthcoming debate about how we might exploit our brownfield sites, this is as important an issues
Further Reading
M. Batty, M. Dodge, S. Doyle and A. Smith (1998) Modelling Virtual Environments, in P. A. Longley, S. M. Brooks, R. McDonnell, and B. Macmillan (eds) Geocomputation: A Primer, John Wiley and Sons, Chichester, UK, pp. 139-161
S. Doyle, M. Dodge, and A. Smith (1998) The Potential of Web-Based Mapping and Virtual Reality Technologies for Modelling Urban Environments, Computers, Environments and Urban Systems, 22, (2), 137-155
Simon Doyle is GIS Officer in the London Borough of Brent, and Michael Batty is Director, Centre for Advanced Spatial Analysis, University College London, 1-19 Torrington Place, London WC1E 6BT, UK