| PRIMER
Detecting Adaptation with Genome-Scale Molecular
Evolutionary Analysis: An Educational Primer for Use
with
“
RNA Interference Pathways Display High Rates
of Adaptive Protein Evolution in
Multiple Invertebrates
”
Brian P. Lazzaro1
Cornell Institute of Host-Microbe Interactions and Disease, Department of Entomology, Cornell University, Ithaca, New York 14853 ORCID ID: 0000-0002-3881-0995 (B.P.L.)
ABSTRACTHosts and pathogens impose coevolutionary pressure on each other as pathogens strive to establish themselves and hosts seek to suppress infection. RNA interference (RNAi) is a mechanism by which cells repress viruses and transposable elements, thereby serving as a form of immune defense. Previous studies have shown that antiviral RNAi genes evolve extraordinarily quickly in the fruitfly
Drosophila melanogaster, suggesting that they may adaptively coevolve with viruses and transposable elements. An article by Palmer and colleagues extends this observation to nematodes and multiple insects. Their article can be combined with this Primer to demonstrate the use of comparative genomics and molecular evolutionary analyses in the measurement of natural selection.
KEYWORDSadaptation; antiviral; coevolution; host–pathogen; natural selection; RNAi; transposable element
Related article inGENETICS:Palmer, W. H., J. D. Hadfield, and D. J. Obbard, 2018 RNA-Interference pathways display high rates of adaptive protein evolution in multiple invertebrates. Genetics208: 1585–1599.
TABLE OF CONTENTS
Abstract 773
What Is RNA Interference? 774
Detecting Adaptation with DNA Sequence Data 774
The Value of Comparative Analyses and Public Databases 776
Unpacking the Study 776
Curating the Data 776
Adaptive Divergence Between Species 777
Recent Adaptation Within Species 778
Connections to Genetics Concepts 778
Suggestions for Classroom Use 779
Questions for Further Exploration 779
Copyright © 2018 by the Genetics Society of America doi:https://doi.org/10.1534/genetics.118.301453
Manuscript received August 3, 2018; accepted for publication August 30, 2018 Available freely online through the author-supported open access option.
I
MMUNE response genes are frequently among the most rapidly evolving genes in the genome (Nielsenet al.2005; Sacktonet al.2007; Waterhouse et al.2007; Obbardet al. 2009). This is thought to indicate antagonistic coevolution between hosts and pathogens, where each reciprocally adapts to the other in a never-ending cycle of one-upmanship (Dawkins and Krebs 1979), as well as adaptation of the im-mune system to novel pathogens that invade host popula-tions. Of course, not all components of the immune system will experience identical natural selective pressure. Some genes may evolve more quickly than others based on the details of their function, and on the nature of their interac-tions with pathogens and pathogen-derived molecules. Mo-lecular evolutionary analyses can be used to identify the components of the immune response that experience the strongest natural selective pressures, and comparative anal-yses can reveal how universal these selective pressures are.What Is RNA Interference?
RNA interference, or RNAi, describes a set of related mech-anisms by which RNA molecules are targeted for silencing or degradation in cells (a short explanatory video can be viewed at https://www.youtube.com/watch?v=cK-OGB1_ELE). RNAi is triggered by the presence of double-stranded RNA, including the genomes of double-stranded RNA viruses and replicating single-stranded RNA viruses. Additionally, in eu-karyotes, the expression of mature mRNAs can be post-transcriptionally regulated by short RNAs that bind the mRNA transcript to create small segments of double-stranded RNA (Ha and Kim 2014). These short RNAs are known as micro-RNAs, or miRNAs. RNAi can also be activated by short-interfering RNAs (siRNAs), which are produced in response to foreign RNA (e.g., viruses) or to active transposable ele-ments (Bronkhorst and van Rij 2014). Transposable element activity in the germline is additionally suppressed by RNAi mediated by piwi-interacting RNAs (piRNAs), which are expressed from graveyards of inactivated transposable ele-ments stored in the genome (Thomson and Lin 2009; Czech and Hannon 2016). In insects, distinct pathways acti-vate RNAi in response to miRNAs, siRNAs, and piRNAs. These pathways are hypothesized to be under different selective pressures: miRNAi pathways perform housekeeping func-tions in the cell and therefore may be expected to evolve largely under purifying selection; siRNAi and piRNAi path-ways suppress pathogenic viruses and transposable elements, and therefore may evolve adaptively under host–pathogen conflict. Crucially, the homologous proteins in the various RNAi pathways have similar biochemical activities, but they operate in different contexts. Comparisons among them can therefore test whether patterns of adaptation are due to the biochemical functions of the proteins or to the contexts in which they operate. The power of such contrasts was ele-gantly demonstrated in a previous paper by Obbard et al. (2006), which showed that the siRNA pathway of Drosophila melanogastercontains some of the most rapidly and adaptively
evolving genes in the genome, whereas the miRNA pathway of D. melanogasterevolves at a rate similar to that of other house-keeping processes.
Detecting Adaptation with DNA Sequence Data
Patterns of DNA sequence diversity within populations and between species can reveal both recent and ancient adapta-tion. Recurrent adaptation by the same protein over long evolutionary time results in a higher rate of amino acid change than would be expected in the absence of natural selection. This can be revealed by comparing rates of DNA and protein sequence divergence between species (Hughes and Nei 1988; McDonald and Kreitman 1991). Recent bouts of natural se-lection alter allele frequencies in the chromosomal regions that surround the selected genes (Smith and Haigh 1974, Kaplanet al.1989). These impacts can be detected by sequenc-ing alleles of the genes from multiple individuals sampled from a population (e.g., Tajima 1989; Fu and Li 1993; Fay and Wu 2000). Sequence-based tests for adaptation are especially pow-erful when evaluated over the entire genome, thereby reveal-ing genes whose evolution departs dramatically from genome norms (e.g., Nielsenet al.2005; Larracuenteet al.2008).
The concept of using the rate of amino acid divergence between species as a specific test for adaptive evolution was first developed for the Major Histocompatibility Complex (MHC) antigen-presenting genes of the vertebrate immune system (Hughes and Nei 1988). The premise was that the rate of divergence at synonymous codon sites (which do not change protein sequence when mutated) would provide a baseline rate of divergence between the species due to mu-tation and genetic drift without natural selection. Nonsynon-ymous mutations change the amino acid sequence of the protein, which is deleterious in most cases. Natural selection is expected to remove these negative mutations from the population, so they will not accumulate as differences be-tween species. The rate of nonsynonymous divergence (dN)
is therefore generally predicted to be much lower than the rate of synonymous divergence (dS), and indeed that is what
is observed for the vast majority of genes in the genome of any organism. However, Hughes and Nei (1988) noted that the antigen-presenting domain of the MHC genes showed higherrates of nonsynonymous divergence (amino acid replace-ment) than synonymous divergence (silent genetic change), suggesting that amino acid substitutions in the antigen-presenting domain may be adaptively favored.
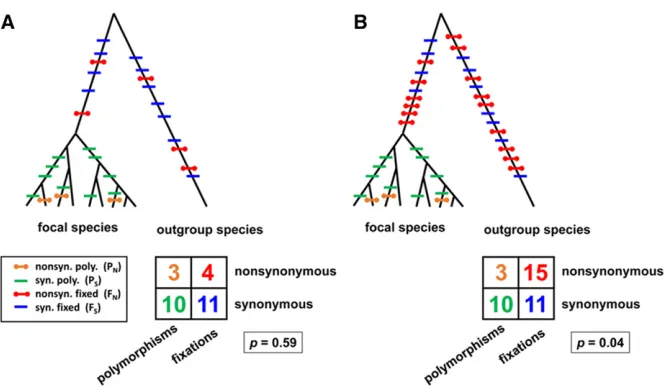
between species should reflect the rates at which mutations arise in a population and drift tofixation. Some nonsynon-ymous mutations are inconsequential, but most are deleteri-ous. A large faction of nonsynonymous mutations that arise should therefore be eliminated by purifying selection. A few may be observed as harmful polymorphisms within the spe-cies and some of the innocuous ones will drift to fixation between species, but the selective removal of deleterious mu-tations will generally result in the observed number of non-synonymous polymorphisms andfixations being smaller than the number of synonymous polymorphisms andfixations. Im-portantly, in the absence of adaptive evolution, the ratio PN/PS
should be similar to the ratio FN/FSbecause mutation, genetic
drift, and purifying selection are the predominant forces both within and between species (Figure 1A). However, some nonsynonymous mutations may be adaptive. Natural selec-tion should quickly drive these to fixation and they will in-crease the observed number of differences fixed between species (Figure 1B). Schlenke and Begun (2003) used the MK test to show that genes in the D. melanogaster and D. simulansimmune systems tend to evolve adaptively. Palmer et al.(2018) screen for adaptive evolution in RNAi genes of several insect and nematode species using a more sophisticated version of the test, but the underlying premise is the same.
Crucially, the dN/dSand MK tests can only detect the
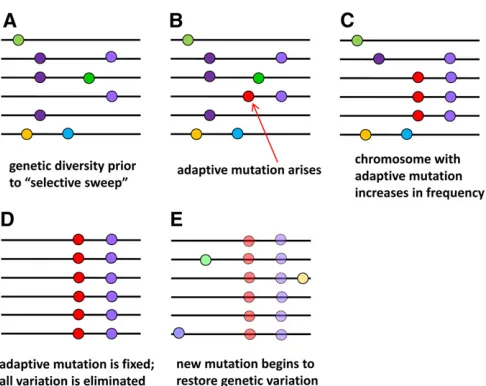
ac-cumulation of a large number of amino acid fixations over long evolutionary time. These tests are insensitive to rare adaptive events. However, recent adaptive fixations can be detected on an individual basis by virtue of their impact on surrounding genetic diversity. When strong natural selection drives an adaptive mutation tofixation in a species, the re-gion of chromosome around the adaptive mutation “hitch-hikes”tofixation along with it (Smith and Haigh 1974). All previously existing alleles are displaced by the adaptively favored chromosome, eliminating genetic diversity until it
is slowly restored by new mutations (Figure 2). For an evo-lutionarily short time after itfixes, the adaptive mutation will therefore be surrounded by a window of reduced genetic di-versity (the size of the window is dependent on the speed of fixation and the rate of meiotic recombination in the popula-tion). Various tests have been developed to measure the re-duction in diversity and recovery of variation around such “selective sweeps”(e.g., Tajima 1989; Fu and Li 1993; Fay and Wu 2000), based on the number of DNA polymorphisms in set of DNA sequences and the individual allele frequencies of each polymorphism [termed the“site frequency spectrum” (SFS)]. Palmeret al.(2018) apply an advanced test of the SFS to evaluate the relative likelihood of selective sweeps around RNAi genes.
they will not have the biological function that is hypothesized to result in adaptive evolution.
The Value of Comparative Analyses and Public Databases
Comparisons across distantly related species can indicate whether a biological phenomenon is general, or whether it is specific to particular species or groups. In previous work,
Obbard et al. (2006) have shown that siRNA genes of
D. melanogasterevolve rapidly and adaptively compared to other genes in the genome, presumably because of conflict with viruses and transposable elements. Palmeret al.(2018) extend this analysis to include a newD. melanogaster data set, another Drosophila species (D. pseudoobscura), a mos-quito (Anopheles gambiae), a honeybee (Apis mellifera), a moth and a butterfly (Bombyx mandarinaandHeliconius mel-pomene), and two nematodes (Pristionchus pacificus and Caenorhabditis briggsae). They hypothesize that if conflict with viruses and/or transposable elements generally drives rapid evolution, they should see parallel adaptation in the siRNA genes of all of these species. The prediction is consis-tent with the findings from a recent paper by Enard et al. (2016), which showed that evolutionary escape from viruses can be a strong driver of adaptive evolution in broadly diverse
mammalian proteins, including proteins that are not involved in RNAi.
The Palmeret al.(2018) study is possible because popu-lation genomic data sets (genome sequences from multiple individuals) have been generated for each of these species by other groups and the data are freely available in public ar-chives. This project would have been impossible 5 years ago, when genome sequencing was more expensive and existing data sets were sparse. It would be impractically expensive and difficult even today if Palmer and colleagues would have had to generate the sequence data themselves. However, studies like that of Palmeret al.(2018) become possible with the falling cost of genome sequencing and research teams making the sequences they that generate freely available. In the age of genomics and open science, previously unimag-inable projects are becoming inexpensive and feasible, and widespread data sharing allows secondary investigators to address questions that might never have been conceived by the primary data generators.
Unpacking the Study
The objective of this study is to test whether host–pathogen interactions drive adaptive evolution in RNAi genes. There are two levels of control in the study. The matched control genes that have no RNAi function demonstrate typical evo-lution of the genome, allowing the test of whether RNAi genes have elevated rates of adaptation. The housekeeping miRNAi genes serve as negative controls for the hypothesis that adaptation is driven by host–pathogen coevolution. If antiviral RNAi (viRNAi), siRNAi, and miRNAi genes all show more adaptive evolution than the functionally unrelated ge-nome controls, then the adaptation must arise from some as-pect of RNAi function, but maynotbe driven by host–pathogen conflict. However, if the viRNAi and siRNAi genes show higher rates of adaptation than the miRNAi genes and the background genome, then the investigators can conclude that host–parasite interactions probably drive adaptive evo-lution of the viRNAi and siRNAi systems. Obbardet al.(2009) previously came to this conclusion in a study of D. mela-nogaster, and the Palmer et al.(2018) study tests whether the phenomenon is generally consistent across multiple spe-cies of insects.
Curating the Data
Palmeret al.(2018) combine a variety of computational tools to identify RNAi and control genes in each species, retrieve the gene sequences from public databases, and ensure that the sequence data are of good quality for molecular evolu-tionary analysis. This rigor of this pipeline is very important in experimental practice; however, the details of how each com-putational tool works are not essential for most teaching con-texts. An overview of what the investigators are trying to achieve and why they want to do it may be preferable to a nuts-and-bolts dissection of how exactly they did it.
The sequence data used in this study were generated in several different studies by different investigators using varied methods. Thefirst tasks of Palmeret al.(2018) were therefore to retrieve the data from the public databases, identify the RNAi genes from each species, and assemble similar sets of control genes for all species. To identify the RNAi genes from each species, they used the already known and annotated gene sets from D. melanogaster and C. elegans as “query” sequences tofind the most similar sequences in the genomes of the other insects and nematodes. If no good match to a query gene could be found in the genome being analyzed, the gene was classified as missing. If two or more equally good matches were found, the gene was classified as duplicated. The genomic control genes were the physically closest genes upstream or downstream of each RNAi gene that were roughly similar in length. Polymorphic alleles of all of these genes were then retrieved from the population genomic da-tabases for each species. Gene regions were only included if they were covered by a minimum of five independent se-quence reads (or two reads forB. mandarina, for which less sequencing had been performed) to maximize the probability that both alleles would be observed in a heterozygote.
Palmeret al.(2018) use molecular evolutionary tests that require comparisons to closely related species, termed “out-groups”(see Figure 1). For each of the main species analyzed, the authors retrieved homologous RNAi and control genes from the mostly closely related species for which a ge-nome sequence was available. These outgroup species are typically,10% diverged at the DNA sequence level. How-ever, the phylogenetic structure ofAnophelesmosquito spe-cies presented a complication. There is a constellation of species that are very closely related toA. gambiae, but these are so closely related (in some cases, they are hybridizing subspecies) that they cannot be used for analysis of sequence divergence. However, the next most closely related species are too divergent for optimal analysis (Obbardet al.2007). Palmeret al.(2018) solve this problem by performing theA. gambiaeanalyses twice: once in comparison to the too-close A. melasand once in comparison to the too-divergentA. chris-tyi. Both analyses give qualitatively similar results and they present only thefindings from comparison toA. melasin the paper. The data for the outgroup nematode C. nigoni also presented a challenge. It is known that the sequence of this species is contaminated with DNA from a more distantly re-lated species,C. afra(Thomaset al.2015). To prevent this contamination from confounding the molecular evolutionary analyses, Palmeret al.(2018) exclude any sequence regions that show.6 standard deviations higher divergence than the average betweenC. nigoniandC. elegans, assuming that these extraordinarily high-divergence regions reflect contam-inating sequence fromC. afra. The genomes of the outgroup bee A. cerana and butterfly H. hecale had been previously sequenced, but the raw sequence reads were not assembled into complete genomes. Therefore, Palmeret al.(2018) con-trive a rapid pipeline to infer the gene sequences of these outgroup species from raw sequence data using established
bioinformatic tools. They validated the accuracy of their pipe-line by testing it with sequence data fromD. melanogasterand D. simulans, two species whose complete genome sequences are well known.
Adaptive Divergence Between Species
Palmer et al. (2018) estimate the rate of adaptive protein evolution for each individual gene, as well as for genes pooled into various classifications to allow specific contrasts (e.g., RNAivs.control, viRNAivs.miRNAi, etc.). They do this with two sophisticated extensions of the MK test illustrated above. In the first extension, they use a piece of software called DFE-ato estimate a parameter,vA, that can be
inter-preted as the proportion of amino acid differences between two species that werefixed by positive selection as opposed to genetic drift.vAis similar to dN/dS, with an emphasis on
detecting the proportion of nonsynonymous substitutions that became fixed through adaptive evolution (as opposed to genetic drift). It is not necessary to understand the details of how this estimate is made [described in detail in Supple-mental Material, Text S1 in Palmeret al.(2018)] to under-stand the biological conclusions of the Palmeret al.(2018) paper. It is sufficient to appreciate that the test is based on the MK concept, with a statistical correction that uses the whole-genome data set to model the demographic history of the species in question because demographic effects can impact evolutionary rates. To contrast the rates of adaptation be-tween different classes of genes (e.g., RNAi vs. control), Palmer et al.(2018) load the individualvAestimates from
each gene into a novel analysis that they term a“multispecies meta-analysis,”which allows them to estimatevAfor entire
pathways averaged across species. Thus, they can contrast whether the RNAi pathways differ from controls or from each other generically across species. These estimates have some uncertainty, and the posterior density in Figure 1B and Figure 2, B and C shows the likelihood thatvAhas a given value for
each gene set. The highest point of the graphed distribution is the most likely value ofvAand the width of the distribution
indicates the confidence in that estimate.
The second extension of the MK test is the SnIPRE analysis [based on Eilertson et al. (2012)], which returns a value called the “selection effect” for each gene or gene set. In the SnIPRE analysis, mutations are again categorized into four classes: synonymous (silent) polymorphism within spe-cies, nonsynonymous (amino acid replacement)
poly-morphism within species, synonymous divergencefixed
effect”indicates a relative excess of amino acid divergence between species in a gene or gene set, and that this excess is interpreted as evidence for adaptive evolution.
Both the DFE-aand the SnIPRE approaches demonstrate higher rates of adaptive evolution in the RNAi genes than in the controls. This is shown, for example, as a significantly higher averagevAfor the RNAi genes in the DFE-aanalysis
(vA= 0.01 in control genes andvA= 0.062 in RNAi genes,
P , 0.001). However, the DFE-a analysis also revealed a much highervariancein DFE-aamong the RNAi genes, sug-gesting that different RNAi genes or pathways may evolve with different rates of adaptive evolution. Sure enough, a pathway-level analysis demonstrates that the housekeeping miRNA genes show no difference from the control genes in rate of adaptive amino acid divergence. However, the rate of adaptive divergence is much higher in the viRNA, piRNA, and siRNA classes. The SnIPRE analysis shows the same pattern. In all analyses, the viRNA genes show the strongest evidence for adaptive divergence between species, which is consistent with the hypothesis that interaction with viruses is a strong driver of adaptive protein evolution [see also Obbard et al. (2006) and Enardet al.(2016)]. The piRNA genes, which are responsible for suppressing transposable elements in the germline, also show strong signatures of adaptation that are most easily detected with the DFE-aanalysis. Following Blumenstielet al.(2016), Palmeret al.(2018) speculate that adaptation in piRNA genes may be driven by the invasion of new transposable elements into each species and by evolu-tionary fine-tuning of the response to existing transposable elements. The paper presents multiple additional analyses that parse the genes into different functional subclasses, and set up a variety of specific contrasts within and across species, but they all follow the same logic and support the same broad set of conclusions. A classroom exercise could be to examine each of the contrasts, and to have students iden-tify the specific hypothesis being tested and interpret the results in each.
Recent Adaptation Within Species
Evolutionarily recent bouts of strong adaptation leave a sig-nature of reduced diversity and distorted allele frequencies in the genome immediately surrounding adaptive mutations. The distribution of the individual allele frequencies of every polymorphic nucleotide in a genomic window is termed the site frequency spectrum. Palmeret al. (2018) use an algo-rithm called SweeD to scan for evidence of selective sweeps. The SweeD algorithm assesses the likelihood that a selective sweep has occurred in a given genomic interval based on the deviation of the SFS of that interval from what would be typically expected for the genome being analyzed. As with the DFE-aand SnIPRE analyses, it is not necessary for stu-dents to understand the details of the SweeD algorithm un-less the course has an intensive focus on population genetic methods. For most classes, it will be sufficient to appreciate that SweeD identifies genomic regions that are likely to have
experienced a recent selective sweep. Palmer et al.(2018) then contrast the abundance of apparent selective sweeps in genomic regions that include RNAi genes to those that con-tain control genes. The explicit hypothesis is that if RNAi genes exhibit adaptive evolution more often than the rest of the genome does, then there should be positive SweeD results at RNAi genes more often than at control genes. Con-ceptually analogous analyses are conducted to contrast other classifications of RNAi genes, such as viRNAi vs. miRNAi genes.
Palmer et al. (2018) find evidence of selective sweeps within 1 kb of a significantly larger proportion of RNAi genes than control genes in six of the eight species (limited genome annotation prevented analysis of the P. pacificus and B. mandarinagenomes). However, all RNAi subpathways were equally likely to have experienced recent sweeps. Remark-ably, two genes—spn-E (a piRNA gene) and vig (a siRNA gene)—showed evidence of a recent sweep infive of the six insect species. This degree of parallel adaptation indicates that these genes are frequently subject to strong selective pressure in diverse species and may be common targets of host–parasite coevolution. However, for the most part, differ-ent genes in each species show evidence of recdiffer-ent adaptive sweeps.
Connections to Genetics Concepts
Althoughfirst intuition might suggest that adaptive mutations will be obvious in complete genome sequences, in practice it is virtually impossible to determine from DNA sequence alone whether any particular mutation is (or was) favored by natural selection. The adaptive mutations themselves do not look any different from neutral mutations that becomefixed between species by genetic drift. A challenge in evolutionary biology then becomes to infer which genes have experienced recent or recurrent adaptive evolution. Contemporary approaches for inferring historical adaptation from sequence data can be daunting for nonexperts, and the Methods sections of papers, such as that by Palmeret al.(2018), can seem impenetrable to the uninitiated. The key to teaching papers like this in an introductory classroom is to emphasize two fundamental concepts: (1) repeated episodes of protein adaptation will speed up the rate of divergence between species (Figure 1) and (2) rapid fixation of an adaptive mutation sweeps the surrounding chromosomal region tofixation as well (Figure 2). Modern methods employ sophisticated model testing to distinguish adaptive evolution from neutral evolution under complex demographic scenarios, which is a level of rigor that is essential for scientific practice. However, even the sophis-ticated models are based on these two fundamental concepts, and the more complex details can be set aside for more ad-vanced classes.
adaptation in antiviral and antitransposable-element genes. The study can be used as a case example in the application of fundamental molecular evolutionary analyses in an introduc-tory class, and the rigorous application of cutting-edge meth-odology can serve as a model for more advanced classes. The Palmeret al.(2018) article further serves to teach the value of genome-scale comparisons for drawing evolutionary infer-ence, as all of their analyses gain power from the contrasts of multigene sets and pathways. Finally, the article serves as an endorsement of open science and data sharing. The paper re-lies on the independent and parallel observation of similar evolutionary patterns in different species to demonstrate the generality of host–pathogen coevolution in RNAi genes. This is only possible because the genome sequences are publicly avail-able and freely shared. The Palmeret al.(2018) article can thus be used as a catalyst for classroom discussion of data ownership and sharing in global scientific research, which is especially pertinent in the postgenomic era of massive data generation.
Suggestions for Classroom Use
Instructors are encouraged to provide this Primer to students in conjunction with the article by Palmeret al.(2018). Stu-dents could be encouraged to focus on the Introduction and mainfigures of Palmeret al.(2018), supplemented with the background explanations provided above. Instructors may also want to employ a variant of the C.R.E.A.T.E. strategy of having students read and interpret several papers in se-quence (Hoskinset al.2007). A potential sequence could be to begin with the original dN/dSpaper from Hughes and Nei
(1988), then read the original article presenting the MK test (1991). These papers could be followed by Obbard et al. (2006), which showed that viRNAi genes are among the fastest evolving genes in the D. melanogaster genome, ulti-mately leading in to the present article by Palmer et al. (2018). The two initial papers are brief and accessible, and neatly present the logic behind the molecular evolutionary tests as originally conceived. The Obbardet al.(2006) paper provides an initial application of those methods to a small number of RNAi genes in a single species, and also presents an initial contrast of those genes to the evolutionary trajectory of the background genome. The paper provides a clear intro-duction to Palmeret al.(2018), which then addresses essen-tially the same question with more sophisticated methods in more species simultaneously. By reading these papers in series, students will come to appreciate the progression of both meth-odology and biological understanding over years of research.
Questions for Further Exploration
The following questions can be used to simulate discussion either in small groups or as a whole class. Students may also be assigned to prepare short answers to one or more questions in advance of a class meeting. Pondering these questions should promote deeper understanding of the Palmer et al.(2018) article and the concepts therein.
1. Palmeret al.(2018) do a parallel analysis of the RNAi genes of six species of insect and two species of nematode. What value is gained by doing this study in multiple species? Should it be expanded to an even larger number of species? 2. Two of the analyzed species yield negative estimates for
vA in both control genes and RNAi genes. Which two
species are those, and how is that observation interpreted? 3. Even in the two species for which vA is negative, the
estimate is more negative in control genes than it is in RNAi genes. How is this observation interpreted? 4. Based onfigure 2, which class of genes shows the
stron-gest evidence of adaptive evolution?
5. What do the vertical gray bars infigure 4 indicate (note that there is a thin bar in the left panel in addition to the prominent bar in the right panel).
6. The authors observe a greater variance in estimatedvA
among RNAi genes than among control genes. What does this indicate about adaptation in RNAi pathways? 7. Infigure 4, the authors show relatively little variance in
estimatedvAamong genes within the viRNAi, piRNAi
and siRNAi, and miRNAi pathways. What does this in-dicate about the effects of selection on these pathways? 8. The authors did not identify any genes that showed sig-nificant evidence of adaptive evolution in every species tested. However, there were strong parallels in the rela-tive strengths of adaprela-tive evolution on the different RNAi pathways across species, and seven individual genes were identified as showing strong indication of adaptive evolution in more than one-half of the species examined. Yet the species are distantly enough related that they should be infected by distinct viruses and transposable elements. Why would the same RNAi genes evolve adap-tively in species that are infected by different parasites? 9. Demographic events like strong population bottlenecks followed by rapid population expansion can result in an SFS that is similar to the SFS expected after a selective sweep. Explain why this would be the case, using illus-trations to support your argument.
10. Why are transposable elements damaging to host ge-nomes? Why do host cells need to suppress the activity of transposable elements?
11. Some viruses have evolved the ability to inhibit RNAi mechanisms. Explain why viral inhibition of RNAi could result in adaptive evolution of the RNAi pathway. 12. The authors document adaptive evolution in viRNAi genes of
multiple invertebrate hosts. Is this sufficient evidence to dem-onstrate coevolution? What other data might be desirable?
Literature Cited
Bronkhorst, A. W., and R. P. van Rij, 2014 The long and short of antiviral defense: small RNA-based immunity in insects. Curr. Opin. Virol. 7: 19–28. https://doi.org/10.1016/j.coviro.2014. 03.010
Czech, B., and G. J. Hannon, 2016 One loop to rule them all: the ping-pong cycle and piRNA-guided silencing. Trends Biochem. Sci. 41: 324–337.https://doi.org/10.1016/j.tibs.2015.12.008
Dawkins, R., and J. R. Krebs, 1979 Arms races between and within species. Proc. R. Soc. Lond. B Biol. Sci. 205: 489–511.
https://doi.org/10.1098/rspb.1979.0081
Eilertson, K. E., J. G. Booth, and C. D. Bustamante, 2012 SnIPRE: selection inference using a Poisson random effects model. PLOS Comput. Biol. 8: e1002806. https://doi.org/10.1371/journal. pcbi.1002806
Enard, D., L. Cai, C. Gwennap, and D. A. Petrov, 2016 Viruses are a dominant driver of protein adaptation in mammals. Elife 5: e12469.https://doi.org/10.7554/eLife.12469
Fay, J. C., and C.-I. Wu, 2000 Hitchhiking under positive Darwin-ian selection. Genetics 155: 1405–1413.
Fu, Y.-X., and W.-H. Li, 1993 Statistical tests of neutrality of mu-tations. Genetics 133: 693–709.
Ha, M., and V. N. Kim, 2014 Regulation of microRNA biogenesis. Nat. Rev. Cell. Biol. 15: 509–524.https://doi.org/10.1038/nrm 3838
Hoskins, S. G., L. M. Stevens, and R. H. Nehm, 2007 Selective use of the primary literature transforms the classroom into a virtual laboratory. Genetics 176: 1381–1389.https://doi.org/10.1534/ genetics.107.071183
Hughes, A. L., and M. Nei, 1988 Pattern of nucleotide substitution at major histocompatibility complex class I loci reveals overdom-inant selection. Nature 335: 167–170.https://doi.org/10.1038/ 335167a0
Kaplan, N. L., R. R. Hudson, and C. H. Langley, 1989 The“ hitch-hiking effect”revisited. Genetics 123: 887–899.
Larracuente, A. M., T. B. Sackton, A. J. Greenberg, A. Wong, N. D. Singh et al., 2008 Evolution of protein-coding genes in
Drosophila. Trends Genet. 24: 114–123.https://doi.org/10.1016/ j.tig.2007.12.001
McDonald, J. H., and M. Kreitman, 1991 Adaptive protein evolu-tion at the Adh locus in Drosophila. Nature 351: 652–654.
https://doi.org/10.1038/351652a0
Nielsen, R., C. Bustamante, A. G. Clark, S. Glanowski, T. B. Sackton
et al., 2005 A scan for positively selected genes in the genomes of humans and chimpanzees. PLoS Biol. 3: e170. https://doi. org/10.1371/journal.pbio.0030170
Obbard, D. J., F. M. Jiggins, D. L. Halligan, and T. J. Little, 2006 Natural selection drives extremely rapid evolution in an-tiviral RNAi genes. Curr. Biol. 16: 580–585. https://doi.org/ 10.1016/j.cub.2006.01.065
Obbard, D. J., Y.-M. Linton, F. M. Jiggins, G. Yan, and T. J. Little, 2007 Population genetics of Plasmodium resistance genes in
Anopheles gambiae: no evidence for strong selection. Mol. Ecol. 16: 3497–3510.https://doi.org/10.1111/j.1365-294X.2007.03395.x
Obbard, D. J., J. J. Welch, K. W. Kim, and F. M. Jiggins, 2009 Quantifying adaptive evolution in the Drosophila im-mune system. PLoS Genet. 5: e1000698.https://doi.org/10.1371/ journal.pgen.1000698
Palmer, W. H., J. D. Hadfield, and D. J. Obbard, 2018 RNA-Interference Pathways Display High Rates of Adaptive Protein Evolution in Multiple Invertebrates. Genetics 208: 1585–1599.
https://doi.org/10.1534/genetics.117.300567
Sackton, T. B., B. P. Lazzaro, T. A. Schlenke, J. D. Evans, D. Hultmark
et al., 2007 Dynamic evolution of the innate immune system in
Drosophila. Nat. Genet. 39: 1461–1468.https://doi.org/10.1038/ ng.2007.60
Schlenke, T. A., and D. J. Begun, 2003 Natural selection drives
Drosophila immune system evolution. Genetics 164: 1471–
1480.
Smith, J. M., and J. Haigh, 1974 The hitch-hiking effect of a favourable gene. Genet. Res. 23: 23–25.https://doi.org/10.1017/ S0016672300014634
Tajima, F., 1989 Statistical method for testing the neutral muta-tion hypothesis by DNA polymorphism. Genetics 123: 585–595. Teshima, K. M., G. Coop, and M. Przeworski, 2006 How reliable are empirical genomic scans for selective sweeps? Genome Res. 16: 702–712.https://doi.org/10.1101/gr.5105206
Thomas, C. G., W. Wang, R. Jovelin, R. Ghosh, T. Lomaskoet al., 2015 Full-genome evolutionary histories of selfing, splitting, and selection in Caenorhabditis. Genome Res. 25: 667–678.
https://doi.org/10.1101/gr.187237.114
Thomson, T., and H. Lin, 2009 The biogenesis and function of PIWI proteins and piRNAs: progress and prospect. Annu. Rev. Cell Dev. Biol. 25: 355–376.https://doi.org/10.1146/annurev. cellbio.24.110707.175327
Waterhouse, R. M., E. V. Kriventseva, S. Meister, Z. Xi, K. S. Alvarez
et al., 2007 Evolutionary dynamics of immune-related genes and pathways in disease-vector mosquitoes. Science 316: 1738– 1743.https://doi.org/10.1126/science.1139862