Development of a Headband for Acquisition and
Analysis of Forehead EOG Signal for Driver Fatigue
Detection based on Eye-Blink Patterns
Anil.P.C
M.Tech Student NIELIT, Calicut
Aravind.B.
M.Tech Student NIELIT, Calicut
Saritha.S
Scientist/Engineer D NIELIT, Calicut
George Varkey
, PhD Chief Scientist Mobilexion TechnologiesABSTRACT
Road accident occupies the number two position (next to heart attack) among the causes for sudden casualties in India. And it is the cause for 35.2 % of total accident deaths happened in 2012 [1]. Therefore, efforts for prevention of such accidents can lead to significant social and economical benefits. Body area network with wearable computing is an emerging field that can augment current practices for driver safety and accident prevention. It provides the possibility of continuous monitoring of the biological signals for detection of driver fatigue for on-line alerts. This paper presents our experience with development of a low cost system for this. It consists of a head-band housing EOG sensors connected to a small control system developed using open source hardware and the analysis software running inside the mobile phone of the driver. Detailed analysis of multi-channel EOG signal can give a number of indications of the level of driver fatigue. Unfortunately, factors like baseline drift, signal contamination, etc., make the real time analysis difficult. However, eye-blink patterns in the EOG signal stream are easy to detect and the methods for this are generally immune to many of the above problems. Our system is able to accurately capture 89% of the eye-blinks in controlled experiments where the subject is watching a video clip on a computer screen. The majority of cases where the eye-blinks were not correctly identified were the ones in which the blink event got immersed in the characteristic signal for simultaneous eye movement. These could be classified and characterized separately. Further work with field study is needed to establish efficacy of the method and modifications required to make it operationally acceptable.
Keywords
Wearable Computing, EOG Signal Analysis, Fatigue detection, Automobile Safety
1.
INTRODUCTION
The number of road accidents in India in the year 2012 was around half a million and this resulted in around 1,50,000 deaths [2]. Driver fatigue is one of main factors (around 30%) that lead to such accidents. Fatigue may be defined as “a state of reduced physical or mental alertness which impairs performance” [3]. This is a neurobiological process directly related to the circadian pacemaker in the brain and to the biological sleep need of the individual [4]. The period of onset of can last for an hour or more and is often associated with a cumulative gradual decrease in performance coupled with measurable psycho-physiological signs [5][6].
Recent advances in fatigue monitoring technology have demonstrated the ability to detect potentially dangerous levels of fatigue through measurement of different bio-signals like EEG, EOG, etc. Of these, the eye-blink signal associated with EOG has the maximum SNR [7][8].
A human eyeball can be considered as a spherical battery (center of cornea positive and retina negative), embedded in the eye socket that can rotate around the torsional center. Micro currents flow radially from the positive to the negative pole of the battery through the conductive tissue in the orbit, generating standing potentials around the eye termed corneo-retinal potential difference (CRP) in the range of 0.4mV to 1.0mV. On the assumption of an unchanging CRP, the electric signal that can be derived using two pairs of skin electrodes placed at peri-orbital positions around one eye is called Electrooculogram (EOG). If the eyes move from the center position towards the periphery, the retina approaches one electrode while the cornea approaches the opposing one. This change in the orientation of the dipole and the electric potential field result in change in the measured EOG signal, and by analyzing these changes, eye movements can be tracked. The signal shows distinguishable patterns for each kind of eye movement (left, right, up, down, blink) and varies from 50-3500 µV with a frequency range of about DC-100Hz[9].
Eye blinking is the contraction of sets of muscles of eye and it produces an electrical activation of eyelid’s muscles. The duration of a spontaneous eye blink during fully wakeful state is typically between 80 to 300 milliseconds. They are thought to be controlled by a blink generator in the brain. As the fatigue progresses, the amplitude of the signal gradually falls and the duration gradually increases [7]. There are number of other changes in other parameters like frequency of blink, increased number of double blinks, etc. Hence this signal is an ideal candidate for fatigue diagnosis.
This research is about developing such a system for field experiments for determination of driver fatigue. It provides the horizontal EOG for both the eyes by routing the signals from EOG sensors to a tiny central station stitched into the headband that is connected to a smart phone kept in driver’s pocket. The smart phone performs the analysis and alert generation functions online. Fig 1 gives the overall scheme.
[image:2.595.320.539.70.251.2]The first prototype of the system is now nearing completion and the EOG signal acquisition and analysis segment has been tested out extensively. A number of pre-processing methods tested for reliably estimating the eye-blink pattern from the EOG signal stream. This paper presents the results. It is organized as follows. Section II describes the basic instrumentation including the instrumentation amplifier, reference circuit, and data acquisition arrangement. Section III describes pre-processing and segmentation techniques applied on the raw EOG signal before it is subjected to further analysis for parameter extraction and alarm generation. Section VI gives a brief overview of these analysis techniques.
Fig 1: Overall Scheme
2.
INSTRUMENTATION
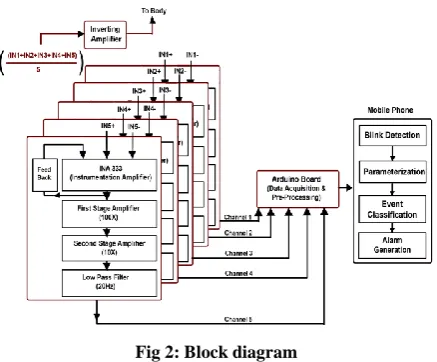
The instrumentation system for EOG has been realized in line with the circuit given in [11]. Fig 2 gives the block diagram. The main sections are the instrumentation amplifier (INA 333), filtering electronics and two stage amplifiers. INA333 provides a very low power solution suitable for this application. The reference voltage is raised to 2.5 Volts to avoid dual supply. The initial amplification of the amplifier is set to 4 to eliminate the chance of amplifying DC level which may otherwise leads to clipping.
The Reference circuit is used to reduce the noise interference from the body of the subject. It is an inverting amplifier configuration which collects the common mode voltage from body and negatively amplifies it before feeding it back.
Fig 2: Block diagram
The open source Arduino Uno is used as the micro processing system for data acquisition and buffering. It is an open-source physical computing platform based on a simple i/o board and a configurable development environment.
The support electronics for the system is configured into a PCB interconnected to the main Arduino board. The total system is shielded using a small steel metal case that is stitched into the end of the head-band. It shields the external noises from interfering with the circuit. The system is powered from the smart phone using a micro USB cable, which acts as the communication link between them.
The communication between the host (Smart Phone) and the microprocessor (Arduino) follows a master slave protocol with the latter acting as the slave. On power on, the microprocessor initializes its environment and polls the micro-USB to see if any commands have been received from the host. Currently, three commands are supported – Self Test, End, and Acquire. In self-test mode, the microprocessor transmits a defined pattern to the host. If it is received correctly, host assumes that the microprocessor is healthy. The End command terminates the action at microprocessor end. In acquire mode, the signal acquisition for the EOG is initiated and the signal stream is transmitted to the smart phone over the serial port in a pre-defined packet format, on a continuous basis. The packet contains the EOG streams for both the eyes along with framing, synchronisation, status and error bits.
At the host side the packets are time checked for consistency and stored at the head of a circular buffer with the analysis segment removing packets from behind. The analysis performs blink pattern detection, fatigue estimation and alarm generation. The steps include pre-processing, segmentation, parameterisation, and analysis of the parameter streams. These are further discussed in the next two sections.
3.
PRE-PROCESSING AND
SEGMENTATION
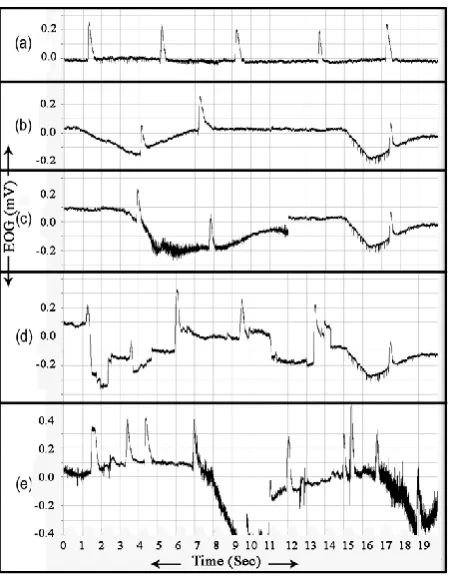
[image:2.595.66.267.317.495.2]Fig 3: Representative EOG signals
Fig 4 shows the effect of digital filtering on the acquired signal. The top graph shows the original signal and the bottom one the filtered output. It may be seen that the filtering has eliminated the baseline drift. The resulting signal is passed on to the segmentation module that outputs the segments corresponding to various events including eye-blinks.
Fig 4: Drift Elimination by Filtering
The output of the segmentation module is the stream of indices corresponding to various segments in the input signal stream. The start index is the point of deviation of the signal from its baseline and the end index is the point of return. The segment from the start index to the end index is an event segment and that from end index to the next start index is a baseline segment. Parameter extraction operates differently for the two types of segments.
Differential
Differential Differential Differential Differential
Average
Smooth
Crossed Limit ?
Declare Event
Start=Zero Cross From Left
End=Second Zero Cross to Right
End Signal
Continue
No
Yes dt
2dt
3dt
4dt
[image:3.595.55.280.69.358.2]5dt
Fig 5: Segmentation Algorithm
Fig 6:Segmentation of signals given in Fig 3
[image:3.595.314.543.374.672.2] [image:3.595.64.271.459.549.2]Event start is the point of zero crossing of the differential to the left. Event end is declared at the second zero crossing to the right –i.e. - the differential crosses the zero-point after event declaration, goes down and comes back to zero. This ensures that both the positive and negative lobes of the signal are captured as one event. Fig 6 gives the output of the segmentation scheme. It may be seen that it is working well for all the signals considered in Fig 3.
4.
PARAMETERIZATION AND ALARM
GENERATION
[image:4.595.315.542.91.180.2]The parameterization module is invoked for each segment. For a baseline segment, it returns the mean standard deviation and the event duration. For an event segment it returns the amplitude, duration, rise time, fall time, half width, average height and event type. Table I gives the definition of these parameters. The computation is straight forward for the first six.
Table 1: Event Parameters
Sl.No Parameter Definition
1 Amplitude Maximum (absolute) value of signal within the event
2 Duration Length of the event (in terms of time duration)
3 Raise Time Time to reach the maximum
4 Fall Time Time from maximum to end of event
5 Half Width
Time duration from first reaching of 50% of amplitude till last reaching of it
6 Area The area under the rectified signal envelope
7 Event type System assigned event type.
The last parameter (event type) is computed based on decision rules set up by the user. These rules use the other six parameters and combinations of them to set the event type as one of “undecided”, “normal blink”, “double blink”, “long blink”, “abnormal”, etc. The system gives a default set of decision rules, but the user may reconfigure the rule book by editing it. For example, an abnormal segment may be made to be defined as one whose amplitude or durations are outside user defined limits. This allows dynamic reconfiguration of the event type rules at run time.
Table II gives the computed parameters for the signal shown in Fig 6c. It may be seen that the parameters truly captures essential features of the signal. Similar results are obtained for the other signals as well.
Table 2: Parameters extracted From Fig 6.C
The parameterization module converts the EOG signal stream into the event streams characterized by the parameters. The alarm generation module operates on the latter converting these into medium term running averages (few minutes) of blink rate, blink width, rate of double blinks, blink amplitude, etc. These are used to determine their trend. Alerts are generated in case there is a consistent downward trend in blink amplitude, upward trend in blink width or rate of double blinks, etc. [13].These rules also are dynamically configurable by editing the rule book.
The above is only the first level approach. The parameters could be uploaded to a corpora annotated with meta data of user provided information on onset of fatigue or those obtained from controlled experiments with on-line video of the driver. Analysis of such corpora to arrive at the optimum rule base can help in performance improvement many fold. This attempt proposed in the next phase of the development.
5.
EXPERIMENTAL RESULTS
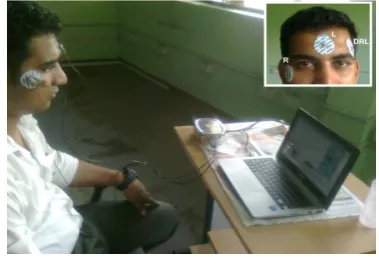
[image:4.595.53.282.295.550.2]To determine the efficacy of the system, an experiment in which volunteers were made to watch a video clip of 10-15 minutes on a laptop computer screen was conducted. Fig 7 illustrates the set-up.
Fig 7: Experimental Setup
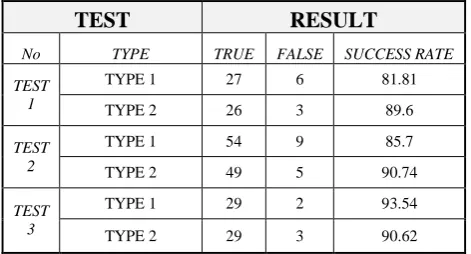
The camera of the laptop video graphs the volunteer throughout this period. Offline manual examination of the video was used to identify the eye-blinks. The instrumentation system correctly detected more than 90% blink events identified in the video using above algorithm. Accuracy is further increased by imposing constrains on blink width, rise time and on the relation between raise-time and fall time. It is found that fall time of a blink was always greater than raise-time. The signals were converted in to two minutes epoch. And in each, two types of tests were conducted. Type-1 tested for validation of each computer detected blinks (by manually comparing with video). In this case, errors found are the false positive detection by the instrument. Type-2 tests whether Table-3 shows results on three representative cases. It is seen that type-2 error is lesser than type-1 error. The examination of video revealed that this missing were due to baseline drifts
Event Max Min Width Raise time Fall Time Half-Width Area
mV mV Sec Sec Sec Sec mV-sec
0 0.223 -0.07 0.462 0.058 0.386 0.412 18.091 1 -0.14 -0.235 0.082 0.002 0.06 1.092 7.77
2 -0.11 -0.2 0.094 0.058 0.026 1.4 7.731
[image:4.595.333.523.445.580.2]associated with lateral eye movements that makes the blink to get immersed into the drifting portions. These may be classified separately and be added to the above to increase the detection accuracy.
Table 3: Test results
TEST
RESULT
No TYPE TRUE FALSE SUCCESS RATE
TEST 1
TYPE 1 27 6 81.81
TYPE 2 26 3 89.6
TEST 2
TYPE 1 54 9 85.7
TYPE 2 49 5 90.74
TEST 3
TYPE 1 29 2 93.54
TYPE 2 29 3 90.62
6.
CONCLUSION
This paper presents a wearable monitoring system with multiple EOG leads and a framework to convert these signals into user configurable driver alerts. It will help in creating an effective environment for conducting controlled experiments for development of EOG based driver alert systems. It will open up more avenues for continuous monitoring of bio-signals in many other environments. Further study and research should continue to develop more effective methods of EOG signal processing, specially tuned for this environment.
7.
ACKNOLEDGEMENT
This work is the outcome of a collaborative effort from three institutions –viz.- National Institute of Electronics and Information Technology (NIELIT) Calicut, Sree Chitra Tirunal Institute of Medical Sciences and Technology (SCTIMST) Trivandrum and Mobilexion Technologies Pvt. Ltd. Trivandrum. We are deeply indebted to the management of these institutions for having provided a very congenial atmosphere for undertaking this work.
8.
REFERENCES
[1] ADSI Reports-2012, Part-2 by National crime records bureau, Ministry of home affairs, INDIA
[2] Manisha Ruikar, ”National statistics of road traffic accidents in India”, Journal of Orthopedics,
Traumatology and Rehabilitation ⋅ Vol-6 ⋅ Issue-1 ⋅ Jan-Apr 2013..
[3] Williamson, Feyer, Friswell,”The impact of work practices on fatigue in long distance truck drivers”, Accident Analysis and Prevention, Volume 28, Number 6, November 1996 , pp. 709-719(11).
[4] Dingus et al., “Detection of Drowsy and Intoxicated Drivers Based on Highway Driving Performance Measures”, Department Report Vehicle Simulation Laboratory, Human Factors Group. Virginia Polytechnic Institute and State University, Virginia. 1985.
[5] Knipling and Wierwille,”Vehicle-Based Drowsy Driver Detection: Current Status and Future Prospects”, IVHS America Fourth Annual Meeting, Atlanta, GA, April 17-20, 1994.
[6] Joel S. Warm, Raja Parasuraman, Gerald Matthews, June 2008, human factors, Vigilance requires Hard mental work and is stressful.
[7] Chongshi Yue, “EOG Signals in Drowsiness Research”, M.Tech Thesis, Biomedical Engineering, University of Linköping, June 2011.
[8] Carina Fors VTI, 2013, Sleep Eye project report, Investigation of driver sleepiness in FOT data..
[9] Robert Krupinski and Przemysław Mazurek, ”Real–Time Low–Latency Estimation of the Blinking and EOG Signals”, from “Real-Time Systems, Architecture, Scheduling, and Application”, www.intechopen.com, 2012.
[10] Usakli A.B,2010,Design of a novel Efficient human computer interface: an EoG based virtual keyboard
[11] Lihuang She, et.al. “A Novel Portable One Lead ECG Monitor with Low-Cost and Long-Time Recording Based on NUC501”, IEEE conference on Control and Decision, July, 2003.
[12] Tobias Wissel, and Ramaswamy Palaniappan, “Considerations on Strategies to Improve EOG Signal Analysis”, IJALR 2(3):6-21 (2011)