Comparative Analysis of Normalized Switching Rate for
Different Fading Channels
Isha Kaushik
Electronics & Comm. Department Dehradun Institute of Technology, Dehradun
Vivek Kumar Gupta
Electronics & Comm. Department Dehradun Institute of Technology, Dehradun
ABSTRACT
Performance of Generalized Selection Combining (GSC) receivers channels mainly in terms of switching rate with non-identical branches has been studied in Rician fading and the graphical results obtained using Mat-lab after implementing the derived switching rate expression for Rician are compared with the performance of Rayleigh Fading Channels as per the research presented in an earlier paper by Paul Ho [1].
General Terms
Switching Rate, Rayleigh fading, Rician fading, Diversity Techniques
Keywords
Generalized selection combining (GSC), Non-identical branches, Multipath Fading, Doppler frequency, Dwell time
1.
INTRODUCTION
Next generation wireless systems are being designed to pro-vide ubiquitous broadband link access to information infra-structure. Application of wireless communications system includes: fixed microwave links; wireless local area networks (LANs); data over cellular networks; wireless wide area net-works (WANs); satellite links; digital dispatch netnet-works; one-way and two-one-way paging networks; diffuse infrared; laser-based communications; keyless car entry; the Global Position-ing System (GPS), mobile cellular communications; and in-door-radio. Whatever be the application, one of the key chal-lenges in wireless communication is the multipath fading .Fading arises due to the possible existence of multiple paths from the transmitter to the receiver with destructive combina-tion at the receiver output. There are many models describing fading in wireless channels [2]. The classic models being Rayleigh and Rician fading models. Rayleigh and Rician models are typically applied to narrowband signals and do not include the Doppler shift induced by the motion of the trans-mitter or the receiver.
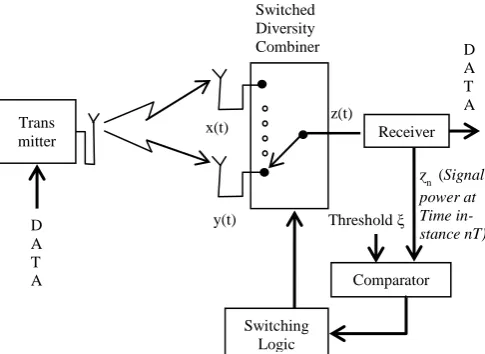
Diversity technique plays a vital role in supporting such high speed connections over radio channels by mitigating the det-rimental effects of multiuser interference and multi path fad-ing. Figure 1 shows the Diagram for a multiple antenna com-munication system. Maximal ratio combining (MRC) of the antennas [3] require accurate knowledge of all complex chan-nel gains (i.e. CSI) and MRC also requires a complete de-modulator for each of N antennas unlike in Generalized Selec-tion Combining (GSC) [4], [5] where RF switch connects the receiver's single demodulator to the antenna with strongest received RF power at any instant.
Switching rate is very important factor in the design of selec-tion diversity receivers. Each time the receiver switches diver-sity branches, a transient is produced by the switching, and this transient corrupts the information signal creating receiver “dead time” or outage. Note that this internally generated
outage is different from, and adds to, outage caused by fading and shadowing, which originates external to the receiver. If the switching rate is too large, a considerable amount of data will be lost which greatly degrades the performance. In addi-tion, knowledge of switching rate has an important role in the design of phase estimation for coherent demodulation receiv-ers [6], [7]. Also, the switching operation consumes power which is not desirable for power limited mobile user. Previous work [6] and [7] studied the switching rates for independent Rayleigh, Rician, and Nakagami-m fading, while [8] studied the switching rate for the case of correlated Rayleigh and Rician diversity branches.
In this paper performance analysis of GSC receivers has been taken into account for the effects of branch correlation be-tween the combined signals .This paper presents powerful function for evaluating the performance of GSC receivers in Rayleigh and Rician fading models with non-identical fading statistics.
The Paper is structured in 4 sections. The Introduction Part elaborates the need and importance of Switching rate and also creates a platform for the understanding of Selection diversity , after that Section II provides a brief overview of Selection diversity in Rician Fading and the its mathematical derivation The detail of system implementation and the numerical results is provided in Section III. Section IV finally concludes the work done and its comparison with Rayleigh Fading. The focus of our paper is the switching rate in M-of-N selection diversity, as well as the average time between switches and the dwell time of an antenna in the selection set.
2.
SELECTION DIVERSITY
2.1
Rician Fading
Figure 1: Multiple Antenna Communication System
2.2
Selection Diversity in Rician Fading
We assume that a receiver with N links between transmitter and M-of-N GSC receiver. Where M is the number of select-ed antennas and N is the total number of antennas. Let gn(t), with n = 1, 2. . . N, be the complex fading gains in the N links between the transmitter and that of the receiver. These com-plex gains are zero-mean comcom-plex Gaussian processes, with gn(t) having avariance of σ2
n in both its real and imaginary components, n = 1, 2, . . . , N. A Jakes power spectrum [10] with a maximum Doppler frequency of fD is assumed for each of these N complex fading processes. As a result, the root mean square (RMS) fading bandwidth is
frms = fD/√2.
The HS diversity receiver monitors the RF signals received on the N antennas, and selects for demodulation at any instant the M signals with the largest amplitudes. Once reduced to base-band, the M signals are combined, coherently or incoherently, to produce a decision statistic. For simplicity in our analysis, we assume that the selection part of the receiver has perfect knowledge of the channel gains. This assumption would be a limitation if we were analyzing performance. However, our interest is in the rate at which selection changes are made. For this purpose, we can assume perfect channel state information, since channel estimation error can usually be modeled as an-other Gaussian process superimposed on g(t) .The time deriv-ative g'n(t) of the gain gn(t) is a zero-mean complex Gaussian process with variance
= 4π2σ2
nf2rms = 2π2σ2nf2D (1) The derivatives
are not necessarily independent of the gains
.the amplitudes
=
all have a Rician probability density function (pdf) .The time derivative of the amplitude rn′ (t) has a Gaussian pdf. [10]
Pr(r’) = ( 2π )-1exp(-
/(2 ) ( 2) For −∞ < r′ < ∞. It is easily being shown that the derivative
is independent of the amplitude rn (t). We are interest-ed in how often the membership of S(t) changes, that is, the switching rate. It is also the rate at which the identities of order statistics M and M + 1 trade positions. The question can be linked to level crossing rate (LCR) analysis by forming the difference.
Thus if we let
u (t) =
(3) There is membership change whenever u (t) becomes zero with a negative slope u'(t) < 0. Dropping the time dependence in u (t) and its derivative u'(t).
Since the study is for non-identical branches so an exponential type branch power profile is considered, i.e.,
(4)
Where 0 < a 1 is the profile parameter, and is the aver-age branch power. Switching rate S (N, M) obtained by Rice's expression [9] is
`
(5)
Where first equality follows from (3) and second from the independence of any
from it’s
. The integral in (5) can be evaluated by using (1), (2), and (3), u' is Gaussian variate zero mean and variance
=
Consequently the integral evaluates [6] to
(7)
Obtaining Pu (0) in (5) is more difficult. A standard result of order statics [11] gives the joint pdf of r (M) and r (M + 1) as
……. (8)
For r (M) r (M + 1), where Pr (r) is the cumulative distribution function (cdf) and Qr (r) is the complementary cdf of r . For Rician pdf [12]
and
respectively (9)
Where
is Marcum Q-function. The complex channel gain acquires a DC
offset, to become c =
where n is a complex gaussian variate with zero mean and variance and K is a rice K-factor. Denote the amplitude as r =|c|. Substitution of the resulting Pu (u) and Iu' into (5) results in the rice fading switch rate, the expression is given as
ɀn (Signal power at Time in-stance nT)
Trans mitter
D A T A
Switched Diversity Combiner
Receiver
Comparator
Switching Logic x(t)
y(t)
z(t)
D A T A
S
R(N, M) =
….. (10)
3.
NUMERICAL RESULTS
We used (10) to generate the normalized switching rates R (N, M) = S (N, M)/fD for Rician channel. Analytical results on the normalized switching rate of pure selection diversity (M = 1) with N = 3, 4. . . 7 available antennas are shown in Figure 2. Here the parameter a is profile parameter and a = 1 indicates uniform profile . Smaller the value of a , more dissimilar the branches are . It is clear from Figure 2 that the presence of non-identical branches reduces the switching rate; smaller the value of a, larger will be the reduction. Table 1 shows the simulation results for switching rate for different combinations of N and a .
[image:3.595.64.265.330.563.2]
Figure 2: Switching rate of 1-of-N GSC in Rician Fading.
While this switching rate reduction allows the receiver more time to dwell on the selected antennas, hence producing more accurate channel estimates for signal combining, the bit error rate may actually suffer when the branches are dissimilar.
The switching rate of M-of-7 GSC with non-identical branch-es is shown in Figure. 3. At each value of M, the switching rate decreases, when a decreases. On the other hand, when a is fixed, the switching rate appears to peak at M = 4, i.e., when slightly more than half the number of available antennas are selected.
Table 2 shows the Mat-lab simulation results for the system having N =7 and changing the value of M and a
Table 1. Simulation Results on switching rate of 1-of-N System
N/a
a
1 0.55 0.4 0.25 0.1
N
3 2.1453 1.9025 1.6731 1.399 0.0561
4 1.941 1.9062 1.6651 1.2965 0.0034
5 1.5705 1.6931 1.519 1.1466 0.0001
6 1.1982 1.3837 1.2915 0.9741 5.30E-06
7 0.883 1.0691 1.0398 0.7995 1.60E-07
[image:3.595.325.532.469.678.2]As it can be seen from Figure 2 and Figure 3 that Normalized switching rate of a Rician fading is a function of three major Parameters, These three parameters are N (total number of antennas ), M ( number of Selected antennas ) and a ( Profile parameter ). As mentioned earlier the parameter a actually decides the uniformity of the branches received after multi-path fading. Here Figure 2 clearly depicts that there is a sharp decline in the switching rate once the profile parameter cross the threshold of 0.5. The switching rate of M-of-7 GSC with non-identical branches is considered in Figure 3 As shown in Figure 3, for M-of-7 system switching rate first increases at peak value a=0.4 and then decreases with non-identical branches. Here switching rate is plotted by keeping N = 7 and changing the values of M and a. At each value of M, switch-ing rate decreases with decrease in value of a. but for a given value of a switching rate increases as we increase the no. of selected channels M.
Figure 3: Normalized Switching rate of M-of-7 GSC in Rician Fading
2 3
4 5
6 7
0 0.5
1 0 0.5 1 1.5 2 2.5
N Normalized switching rate of 1-of-N GSC in rician fading channel
a
N
o
rm
a
li
z
e
d
s
w
it
c
h
in
g
r
a
te
2 3
4 5
6
0 0.2 0.4 0.6 0.8 1 0 2 4 6 8 10
M Normalized switching rate of M-of-7 GSC rician fading channel
a
N
o
rm
a
li
z
e
d
s
w
it
c
h
in
g
r
a
te
M =1 (Pure selection Diversity)
Table 2: Simulation Result of M of 7-System
a = 1 a = 0.55 a = 0.4 a = 0.1
M=2 3.501318 4.278869 4.225354 7.89E-06
M=3 6.398846 7.919836 7.998217 0.000248
M=4 7.446922 9.356166 9.764459 0.006081
M=5 6.724668 8.53 9.238681 0.099659
M=6 5.834025 7.186552 7.972836 1.62
4.
CONCLUSION
[image:4.595.314.560.136.340.2]The comparison is shown in Figure 4 for 1-of-N GSC receiv-ers in Rayleigh and Rician fading channels .The numerical values present in Figure 4 for Rician are simulated using the Equation 10 , the value of M is kept at 1 i.e. pure selection diversity and value of a is kept as 0.5 . And the numerical values for switching rate in Rayleigh are used for comparison using [1] . It can be concluded from Figure 4 that in case of pure selection diversity, for a given value of a , switching rate decreases with the increase in the number of antennas in Rician fading channel whereas in case of Rayleigh it is a line-ar function of number of antennas. In this paper, analysis of switching rate is done with the help of analytical expression for the switching rate of selection diversity receivers operating in Rician fading. These receivers will select, the M strongest branches, out of a total of N branches for combining. In order to produce accurate channel estimation, switching rate should be small. Switching rate decreases for non-identical branches in both Rayleigh and Rician fading channels. In Rician , as the profile parameter(a) decreases, the switching rate decreases as we can see in Figure 2 and the behavior is similar for both Rayleigh and Rician . But unlike Rayleigh, in Rician with increase in number of antenna the Switching rate decreases as it can be seen in Figure 2 and Figure 4.
Figure 4: Comparison of Swtiching rate of 1-of-N GSC Receivers in Rayleigh and Rician Fading Channels.
Also the switching rate comparison for M-of-7 systems are shown in Figure 5, The total number of antennas N is kept as 7 and the value of a is kept as 0.5 , the results for Rayleigh and Rician are almost identical however their absolute values differs as shown.
Figure 5: Comparison of switching rate of M-of-7 GSC in Rayleigh and Rician fading Channels
5.
ACKNOWLEDGEMENTS
The authors would like to thank the ECE Department faculty, Dehradun Institute of technology for their sug-gestions that have enhanced this paper
6.
REFERENCES
[1] Paul Ho, Raymond Kwan ,and Xianbin Wang "Impact of Non-identical branches on the switching rate of general-ized selection combining in Rayleigh fading channels" IEEE trans. on vehicular technology, vol. 58, no. 5, June 2009.
[2] R. B. Ertel and P. Cardieri, “Overview of spatial channel models for antenna array communication systems," IEEE Personal Communications, pp. 10-22, Feb. 1998.
[3] D. G. Brennan, “Linear diversity combining tech-niques,” in Proc. IRE, vol. 47, pp. 1075–1102, June 1959.
[4] N. Kong and L. B. Milstein, “Average SNR of a general-ized diversity selection combining scheme,” IEEE Commun. Lett., vol. 3, no. 3, pp. 57–59, Mar. 1999 [5] M. Z. Win and J. H. Winters, “Virtual branch analysis of
symbol error probability for hybrid selection/maximal-ratio combining in Rayleigh fading,” IEEE Trans. Commun., vol. 49, no. 11, pp. 1926–1934, Nov. 2001. [6] J. K. Cavers and P. Ho, “Switching rate and dwell time in
M-of-N selection diversity,” IEEE Trans. Wireless Commun., vol. 6, pp. 1218-1223, Apr. 2007.
[7] N. C. Beaulieu, “Switching Rates of Dual Selection Di-versity and Dual Switch-and-Stay DiDi-versity,” IEEE Trans. Commun., vol. 56, no. 9, pp.1409-1413, Sept. 2008.
2 3 4 5 6
Rayleigh 5.286 6.247 7.568 7.879 6.2489
Rician 4.278 7.919 9.356 8.532 7.186
0 1 2 3 4 5 6 7 8 9 10
S
w
it
ch
in
g
R
at
e
Rayleigh v/s Rician Switching rate for M-of-7 GSC receiver
a = 0.5 N= 7
3 4 5 6 7
Rayleigh 1.255 1.8909 2.4 2.9 3.3
Rician 1.673 1.66512 1.57054 1.2915 1.0398
0 0.5 1 1.5 2 2.5 3 3.5
S
w
it
ch
in
g
ra
te
Rayleigh v/s Rician Switching Rate for 1-of-N GSC receiver
[image:4.595.43.285.493.687.2][8] X. Wang and N. C. Beaulieu, “Switching Rates of Two-Branch Selection Diversity in Correlated Doppler Fad-ing,” to appear in IEEE Trans. Wireless Commun
[9] S. O. Rice, “Statistical properties of a sine wave plus random noise,” Bell Syst. Tech. J., vol. 27, pp. 109–157, 1948.
[10]W. C. Jakes, "Microwave Mobile Communications". New York: IEEE Press, 1993.
[11]N. Balakrishnan and A. C. Cohen, “Order Statistics and Inference: Estimation Methods” Academic Press, 1991 [12]J. G. Proakis, “Digital Communications, Fourth