Simultaneous THEMIS observations in the near-tail
portion of the inner and outer plasma sheet flux
tubes at substorm onset
V. A. Sergeev,1 S. V. Apatenkov,1V. Angelopoulos,2 J. P. McFadden,3D. Larson,3 J. W. Bonnell,3 M. Kuznetsova,4 N. Partamies,5 and F. Honary6
Received 23 June 2008; revised 13 August 2008; accepted 22 August 2008; published 19 November 2008.
[1] We analyzed the measurements made by two Time History of Events and Macroscale
Interactions during Substorms (THEMIS) probes in ideal observational conditions (quiet background, near midnight, inside the substorm current wedge) during two distinct isolated substorm onsets, with probe P2 measuring the inner plasma sheet at8 Re and P1 near the plasma sheet – lobe interface at 11– 12 Re. The earliest onset-related strong perturbations were observed by P1; they include the increase of both Bz(dipolarization)
andEy (a few mV/m) as well as the simultaneous drop in total pressure, indicating the
unloading process. This was also accompanied by fast inward plasma motion (up to 100 km/s, toward the neutral sheet) and fast plasma sheet thinning while the poleward auroral expansion was in progress in the conjugate ionosphere. These perturbations were followed after 6 –8 min by the rapid expansion of the already heated plasma sheet. While in the adjacent lobe during this thinning phase, probe P1 continued to observe intense flux transfer toward the sheet center plane. The inner probe observed intense dipolarization and inward plasma injection but with a smaller flux transfer and starting 1 –2 min after the perturbations at P1, supporting the conclusion that onset instability took place tailward of 12 Re. We also demonstrate the global MHD simulations to show that a nontrivial combination of dipolarization and the plasma sheet thinning may be observed simultaneously in the outmost part of the dipolelike region during a sudden increase of the reconnection rate at the nearby active Xline, staying a few Re from the observation point. These observations provide constraints for the choice of substorm onset mechanism and indicate near-Earth magnetic reconnection as the most probable source process.
Citation: Sergeev, V. A., S. V. Apatenkov, V. Angelopoulos, J. P. McFadden, D. Larson, J. W. Bonnell, M. Kuznetsova, N. Partamies, and F. Honary (2008), Simultaneous THEMIS observations in the near-tail portion of the inner and outer plasma sheet flux tubes at substorm onset,J. Geophys. Res.,113, A00C02, doi:10.1029/2008JA013527.
1. Introduction
[2] The magnetotail plasma sheet shows complicated dynamics around the time of substorm onset in the near-Earth tail region which holds important information about the mechanism of explosive instability which triggers the onset. The gross configuration changes [e.g.,McPherron et al., 1973] include the magnetic field dipolarization, plasma sheet expansion and inward plasma injection in the
dipole-like inner region (roughly, within 10 Re), which are thought to be closely related to the diversion of a part of the plasma sheet dawn-to-dusk current via the ionosphere (the so-called substorm current wedge, SCW). Further downtail, in the midtail region, the plasma sheet current starts to be dis-rupted (as revealed by the lobe magnetic field decrease [Caan et al., 1978]) and fast plasma flows are generated, whereas the plasma/current sheet configuration often dis-plays a fast thinning [Hones et al., 1984]. These changes are often interpreted as an indication of explosive onset of magnetic reconnection [Nagai et al., 1998]. However, the onset phenomena are highly variable and localized so they could not be fully observed and described with previous scarce spacecraft and ground coverage. Consequently, the basic morphological questions concerning the exact time sequence of the phenomena in different regions (at time resolution better than a couple of minutes) remain contro-versial. The answer to questions concerning the origin of the explosive tail instability is a basic goal of the Time History of Events and Macroscale Interactions during Substorms (THEMIS) mission.
Here
for
Full Article
1St. Petersburg State University, St. Petersburg, Russia. 2
Institute of Geophysics and Planetary Physics, University of California, Los Angeles, California, USA.
3
Space Sciences Laboratory, University of California, Berkeley, California, USA.
4
NASA Goddard Space Flight Center, Greenbelt, Maryland, USA.
5
Finnish Meteorological Institute, Helsinki, Finland.
6Department of Communication Systems, Lancaster University,
Lancaster, UK.
Copyright 2008 by the American Geophysical Union. 0148-0227/08/2008JA013527$09.00
[3] A special interest in that respect is the transition region at 10 – 12 Re in the tail separating the dipole-like and tail-like plasma tube configurations, which approxi-mately correspond to a demarcation line between the source regions in the groups of Inside!Out models (instability starts in the inner region, and may then stimulate the reconnection further down the tail) and Outside!In models (midtail reconnection starts first and send flows to the inner region) [Ohtani, 2004]. This region is thought to be close to the heart of the current disruption and also a potential region of the braking of the fast Earthward flows launched from the tail [e.g.,Kepko et al., 2001]. However, the substorm onset-related phenomena in this key region were not previously studied as systematically as it was done in the midtail or in the geosynchronous region, so the question (What is going on in this region during the first minutes around onset time?) is still basically unanswered. It is why we choose as a main objective of our particular study to investigate the perturbations near the outward PS boundary (including adjacent lobes) at11Re during simultaneous observations of the inward injection and ground-based phenomena on the same meridian. Our goals here are (1) to describe the configurational changes in the PS boundary region, (2) to establish a time sequence between the perturbations in this
region comparing to the inner region (between GEO and 9 Re) and ground phenomena, and (3) to discuss the con-straints on the choice of onset instability as seen by the observer at 11 Re.
[4] In the following we analyze a case of two subsequent substorm onsets observed by two THEMIS spacecraft ideally located (for our goals) on the outbound part of their trajectory. These events are also ideal because they had very distinct onsets in all phenomena, at both spacecraft and on the ground, and because both spacecraft and the conjugate ground MIRACLE network made observations inside the substorm current wedge (SCW) sector. To support our interpretation we also show some additional material from other events and present the results of MHD simulations.
2. Observations on 27 December 2007
[5] The THEMIS mission was previously described by
Angelopoulos et al.[2008]. Here we used observations from the magnetometer (FGM), the particle spectrometers (ESA and SST) and from the electric field double probe. These instruments are described in the special issue of Space Science Reviews, 2008.
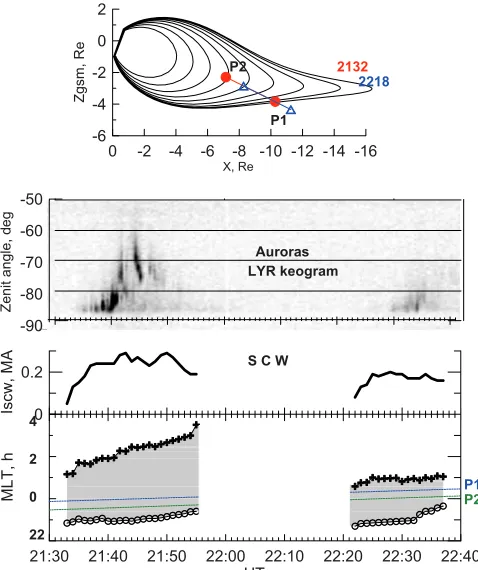
[6] The two events of interest occurred at the end of the day on 27 December 2007, when the probes P1 and P2 passed outbound near the midnight meridian plane after their perigee (Figure 1). At the times of onset (2132 UT and2219 UT) the P1 spacecraft was1.5 Re below the neutral sheet and probed the plasma sheet near its outer boundary at the distance of 11 and 12 Re, respectively. Probe P2 passed near the neutral sheet (jdZj< 0.4 Re) and near the inner PS boundary during the first onset (being at 7.4 Re), or inside the innermost portion of the inner plasma sheet (at 8.7 Re) during the second onset; see Figure 1 (top). The data come at 3 sec spin resolution in the slow data storage mode, which excludes the detailed study of the distribution functions in these events.
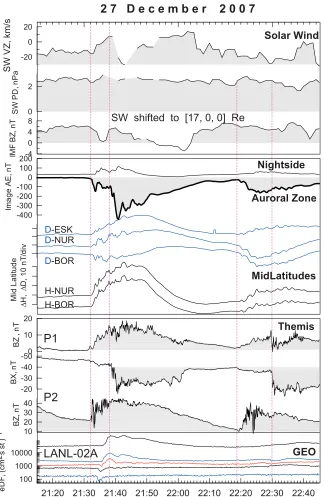
[image:2.612.61.300.59.344.2][7] Ground activity started in the quiet background dur-ing the northward (but small) IMFBzand solar wind flow pressure of 2 nPa (Figure 2). The electrojet index of the Image magnetometer network (midnight at2140 UT for the central meridian chain) indicates the modest electrojet enhancements with AL peak values of450 nT and150 nT and isolated onsets. The magnetic bays are also very distinct in the midlatitude variations: positiveHbays andD varia-tions of different signs with intense Pi2 components (shown in Figure 2) are good for accurate timing and quantitative analysis. Using the midlatitude magnetic variations of 16 Intermagnet stations (distributed between 1800 and 0600 MLT on the nightside) as inputs to determine the intensity and longitudes of the substorm current wedge (see Sergeev et al.[1996] for the description of the procedure) we reconstructed the SCW parameters for both onsets, using the magnetic field values at 2131 and 2218 UT as the reference levels for the variations. Although the current wedges in the two events were of different peak magnitude (0.3 and 0.2 MA, correspondingly) and of different width and locations (see Figure 1, bottom), the spacecraft foot-point longitudes (close to midnight) as well as the central meridian of the Image network (local midnight at2140 UT) fall well inside of the developing substorm current wedges, and thus, fairly well inside of the substorm active sector. Figure 1. (top) XZ-GSM locations of P1 and P2
[8] The digital ASC auroral measurements for this event are only available from Longyearbyen station (LYR, 75.1°
CGLat, 113°CGLon) situated near the poleward border of the auroral oval (see Figure 1, middle). Although these measurements are useless for the precise substorm onset timing, they document a strong poleward expansion of bright active auroras during the times when the P1 space-craft probed the inward motion of the outer plasma sheet boundary. According to the Image magnetograms, the onset latitude was at67°, slightly southward of Nordkap station
as follows from initial small positivedZexcursion observed here at both onsets. The poleward expansion peak reaches 73° (72°) CGLat (at 2142 and 2233 UT) indicating a rather strong and fast poleward auroral expansion during the period when the P1 probe made observations in the lobe region (see below).
[image:3.612.148.472.55.552.2][9] Both THEMIS spacecraft observed distinct positive bay-likeBzvariations of similar shape (Figure 2); however, the behavior of plasma parameters at spacecraft separated by only3 Re distance differs drastically (see Figure 3). Figure 2. (top) Survey of time-shifted solar wind parameters (Vz, flow pressure and Bz, from
Whereas the innermost probe P2 observed the arrival of accelerated plasma soon after the onset times, probe P1 instead showed 10 min-long plasma dropouts in both cases, indicating that the probe exited from the plasma sheet to the lobes. Let us consider in more detail the initial onsets and lobe periods at P1 which display a lot of interesting activities.
[10] Figure 4 provides the time series of basic parameters from particle and field experiments at the plasma sheet – lobe interface. The onset of the first isolated event was very distinct and related phenomena occurred simultaneously in the magnetic and electric fields, at around 2131:35(±10 s). At this time theBzcomponent started its positive excursion, and the Bx component dropped in magnitude. In terms of total energy (magnetic plus plasma pressure, equivalent to the lobe energy density) the last variation implies a signif-icant loss of the lobe magnetic pressure by 10% in a half minute (see Figure 4, bottom). The magnetic pressure continued to decrease during the next several minutes when the probe P1 was already in the lobe. A very distinct and strong negativeEyfield in satellite (DSL [seeAngelopoulos, 2008]) coordinates, reaching 3 mV/m in a half minute, corresponds to the appearance of strong dawn-to-dusk (positive GSM) electric field near the spacecraft. This may imply a fast upward plasma motion (Vz in Figure 4)
as the origin of fast disappearance (thinning, or upward lifting) of the plasma sheet which was noticed a minute after the onset. This strong Ey, indicating the fast flux transport and enhanced dissipation in the tail, was the dominant E field component. Similar manifestations, including a drop of the total (lobe) pressure, an increases in GSMBzand GSM Ey(although more smooth and weak) are confirmed for the second event. The inferred onset times of particular onset phenomena will later be summarized in Table 1.
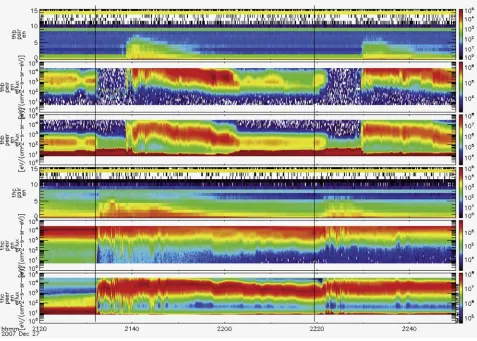
[image:4.612.69.546.59.400.2][11] Approximately 2 and 4 min after the onsets, corre-spondingly, probe P1 exited into the lobe for 6 – 8 min in both events. However, the lobe intervals were not the quiet periods. The total pressure continued to decrease, although at smaller rate compared to its drop at the onset. The Bz component continued to grow (increasing finally to as much as 15 nT in the first event) and theEycomponent remained large and directed dawn-to-dusk. These field variations contain a noticeable impulsive component at 1 min time scale, which is a dominant feature of the first episode, with correlatingBzandEyGSM components. Unfortunately, the reconstruction of the vector E-field is difficult in this case (the B vector lies nearly in the spin plane and E B = 0 technique cannot be successfully applied) and ground plasma moments are unavailable in the slow mode. How-ever, a remarkable particle feature observed by the ESA Figure 3. A set of three energy spectrograms for THEMIS spacecraft P1 (top set) and P2 (bottom set).
spectrometer helps us to verify the observedEy, and better understand its consequences.
[12] During the lobe intervals the ESA spectrometer observed the polar rain electrons at E < 100 eV and no heated plasma sheet ions in the keV energy range. However, the ion spectrometer frequently detected the intense and almost monoenergetic ions with energy varying in time from tens to hundreds of eV. This energy is displayed by red circles in Figure 4 (top). Owing to the slow sampling rate mode only one distribution function was available in 3 min. A single example was available during the monoenergetic ion event (at 213330 UT) and exhibited a tailward compo-nent as well as a significant compocompo-nent perpendicular toB. To test whether the variations of monoenergetic beam energy reflect the cross-B convective motion of the cold plasma as previously observed by Cluster [e.g.,Sauvaud et al., 2004] and THEMIS [McFadden et al., 2008], we computed the Vz expected from the electric drift motion taking into account only one flow component, namely,Vz= Ey/Bx. From that we calculate the kinetic energy of this cross-field motion, Wi = mpVz2/2, assuming that ions are protons. A comparison in Figure 4 (top) justifies our expectation: the beam energies are in a range compatible with the energy of the proton electric drift motion, and the observed time variations closely follow our predictions. As a result of this successful test we learned that (1) cold ions are protons, (2) the magnetic fields are frozen into the plasma, (3) the measurements of the electric field Ey
component are reliable even in the lobes, and (4) there are real fast upward plasma tube convective motions in the lobes at r 10 Re toward the plasma sheet center. They are very fast, up to Vz 50 – 150 km/s, during the whole 10-min long lobe period starting from the onset, indicating a steadily large flux transfer.
[13] Whereas the fast inward (toward the neutral sheet, upward in the southern lobe) plasma motion naturally explains the fast plasma sheet thinning, there is no compa-Figure 4. Observations at P1 THEMIS spacecraft near the onsets of two substorms, including (from
[image:5.612.115.498.54.333.2]bottom to top) the total (plasma plus magnetic, PTOT) pressure; GSMBz;Ey from the double probe (in DSL coordinates, whereEy EYGSM); vertical flow component (estimated asVE=Ey/Bx, and the GSM Vzcomponent from onboard ESA moments); and temperature of plasma sheet ions. For the lobe time period, the time variations of the energies of monoenergetic ions (circles) and proton energies corresponding to electric driftVEare also shown on the top panels. The red vertical lines indicate the earliest times of onset-related phenomena.
Table 1. Onset Times of the Phenomena Observed Near the Substorm Onset
Signature First Event Second Event
P1,11 Re, PSBL/lobe
+Bzonset 2131:25 ± 5 s 2218:30 ± 30 s (gradual)
Start of +Vz/+Ey 2131:35 ± 5 s 2218:30 ± 30 s
Lobe energy drop 2131:45 ± 5 s 2218:30 ± 5 s P2, 7 – 8 Re, inner PS
+Bzonset 2132:05 ± 5 s 2219:30 ± 5 s
Plasma pressure precursor 2132:05 ± 5 s 2219:00 ± 5 s +Eyonset 2132:00 ± 5 s ?2221:10
Plasma boundary 2132:10 ± 5 s ?2221:50 FlowVxincrease 2132:10 2219:50
Ground Pi2 and SCW (SAMNET)
2132:20 ± 5 s 2219:30 ± 5 s
Auroral expansion (>213320 LYR)
[image:5.612.311.552.586.740.2]rable opposite (dusk-to-dawn)Eycomponent during the fast plasma sheet expansion, suggesting a different association of plasma sheet boundary motion and cross-field plasma motion in this events. This will be addressed further in our discussion.
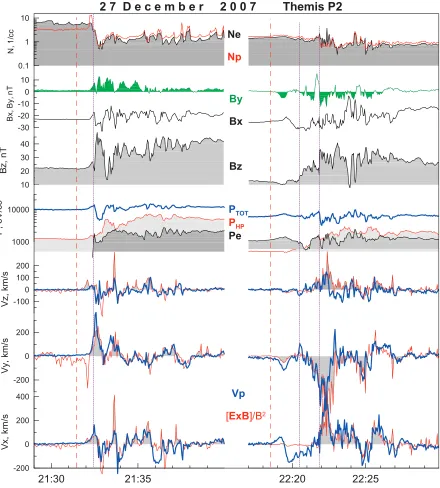
[14] The substorm onset observations of probe P2 near the inner plasma sheet boundary are displayed in Figure 5. The major dipolarizations and flux transfer (identified by strongEyandBzfields) are delayed by >1 min after the P1 onset times, although some precursor phenomena are
[image:6.612.89.529.57.545.2]ob-served. Compared to the onset times at P1 the first signa-tures of activity at P2 (slow Earthward and a stronger duskward flow, and a slow pressure increase) are delayed by 20 – 30 s in the first event, and the major injection started a minute later. In the second event the first appearance of a weak Earthward-then-dawnward-then-tailward flow and slow pressure increase were nearly simultaneous with the start of activity at P1. However, in this case, the absence of convective flow implies that these flows may be associated with the plasma injection mainly along the flux tube, rather Figure 5. Observations at P2 THEMIS spacecraft near the onsets of two substorms, including (from
than with the flux tube transport. A major injection of plasma tubes in the second event was observed after 2221 UT, simultaneously with the Ey increase and fast plasma sheet thinning at P1 (Figure 4). Although the details of plasma injection into the inner magnetosphere will be the subject of a subsequent paper, we briefly emphasize one remarkable feature. In the first event (P2 was near the dusk edge of the SCW, Figure 1) the azimuthal flow was duskward, whereas in the second event (P2 was near the dawn SCW edge) it was dawnward. This possibly indicates a flow diversion associated with the localized (in MLT) inward plasma injection. After inspecting the observations atr 8 Re in the middle of the dipole-like plasma sheet, it can be concluded that there is no strong activity (strong flux transport, or pressure variations) that precedes and could explain the intense plasma sheet convection (Ey) com-menced at P1 location at the substorm onset. The distance between two spacecraft is too small (less than 4 Re) to allow for significant flux or plasma transport to be missed in observations.
[15] The timing of important features is summarized in Table 1. Together with already discussed observations we include the injection of energetic electrons to 6.6 Re. This injection time was obtained after eliminating the drift time by using the dispersed electron hole (see data in Figure 2, bottom) which is known to be the ‘‘negative’’ image of the ordinary energy-dispersed injected particle signatures [Sergeev et al., 1992]. It is observed only in the first event, and shows a large (70 sec) time delay against the injection at P2, consistent with a slow inward propagation speed of 80 km/s. We also include the earliest timing of Pi2 onset at subauroral stations of SAMNET network which are delayed by 50 – 60 s after the initial activation observed at P1 spacecraft. In any case, the phenomena observed at P1 are the most intense and earliest observations related to the explosive substorm onset, and they are most closely linked to the basic instability responsible for the onset.
3. Discussion
3.1. Expansion Onset Process as Seen by the Observer at the Lobe – Plasma Sheet Interface
[16] Favorable location and distinct isolated onset fea-tures in the considered events allow us to provide a consistent description of the substorm expansion process from the viewpoint of the observer, located at the lobe – plasma sheet interface, in the transition region separating the dipolelike and taillike plasma sheet domains. This location is illustrated by the P1 probe location in the magnetic configuration shown in Figure 1. We note that actual depression of theBzcomponent just prior to the onset was 10 nT larger than in theKp = 3 T89 model used to draw the field lines in Figure 1, so the real configuration is even more tail-like than shown.
[17] An important new observation is that the earliest signature of the onset includes a distinct increase of the dawn-duskEyfield, indicative of a sudden start of intense (a few mV/m) flux transport. Although double-probe measure-ments in the rarified lobe plasma are usually considered with great caution, in our case we were able to confirm the large amplitude and time variations of Ey by directly observing the energy of perpendicular (E B– related)
proton drift motion on the ion spectrograms. We emphasize thatEyand relatedVzare an order more intense as compared to the average cross-tail electric field (about 0.15 mV/m), so that theseEyare really strong and correspondingVzare very fast, compared to their average values. The reliable obser-vation of a convection of such intensity allows us to combine and interpret a few other features observed nearly simultaneously. Most of the features discussed below have already been identified in previous studies, although in our case the reliable Ey diagnostics, high time resolution and good identical instrumentation of THEMIS spacecraft allow for the first time to combine all of these features together, to provide the constraints for the choice of a physical model of substorm onset.
[18] A remarkable onset-related phenomenon is the rapid exit of the probe from the plasma sheet, which may be interpreted either as a manifestation of fast plasma sheet thinning, or as a result of a current sheet tilt, induced, for example, by a sudden change in the solar wind direction. Indeed, a short positive excursion of the solar wind Vz, which could cause the upward shift of the current sheet, was inferred near 2130 UT at the subsolar bow shock position (Figure 2). However, this feature is too late in the first event, and no comparable variation is seen in the second event. Both events showed an increase of Ey and correspond to rather strong (50 to 150 km/s) upward transport velocities (Vz = Ey/Bx in Figure 4) which continued for about 10 min, much longer than a short positive excursion of the solar wind Vz in the first event. Another reason to believe in the inner-magnetospheric origin of the fast plasma thinning is that the onset of upward flow (Vz) was synchronized within 10 s with a sudden drop of the total pressure and with a start ofBz increase, which is inconsis-tent with what is expected from a simple upward lifting of the current sheet. These three phenomena are closely connected and should be interpreted together.
[19] The fast plasma sheet thinning is a well-known manifestation of the substorm onset; however, previously it was associated with a more tailward midtail region, atr> 15 Re [Hones et al., 1984]. Previous analysis showed that the thinning sheet boundary velocity evaluated from the timing at two spacecraft (ISEE-1,2) was consistent with simultaneously observed inward (upward in our case) plas-ma flow velocity [Forbes et al., 1981]. A recent timing study by Cluster [Dewhurst et al., 2004] gave the typical thinning speeds of 10 – 70 km/s and confirm that fast thinnings are the expansion-related (rather than growth phase-related) phenomena. In a few cases the fast thinnings were observed as close to the Earth as 9 Re (Polar observations at 2107 UT on 8 September 2002 presented bySergeev et al.[2005]) or even7 Re (initial thinning at TC2 before the subsequent plasma sheet expansion occurred 1 min later [Sergeev et al., 2008]). These observations conflict with the scheme in which the plasma sheet is expanding in the near-Earth region where dipolarization is observed [McPherron et al., 1973;Baker et al., 1996]. We reiterate that in our case the plasma sheet thinnings were observed simultaneously with the continued depolarization (see Figure 4).
positive H component bay amplitude at the midlatitudes (see Figure 2). Formally this can be interpreted by the decrease of the tail current that started and continued tailward from the P1 spacecraft, in agreement with the observed dipolarization time delay from P1 to P2.
[21] A sudden drop of the total pressure (in the absence of related drops of the solar wind flow pressure) is another significant and well-known feature of the substorm onset mechanism [e.g., Caan et al., 1978; Yamaguchi et al., 2004]. It means a net loss of the magnetic flux from the given tail cross section, which is consistent with enhanced flux transfer revealed by the large Ey amplitude. In other way, it is consistent with the decrease (disruption) of the tail current, which takes place tailward of P1 as argued above. [22] All of these features can in principle be interpreted by either (any kind of) current disruption process in the inner magnetosphere (earthward of 10 Re), or by (any kind of) current disruption in the further tail region including the magnetic reconnection. However, current disruption in the inner magnetosphere is inconsistent with both relative timing and relative intensities of the flux transport at P1 and P2, which stay nearly in the same magnetic meridian plane (within 1 – 2 Re perpendicular to that plane). Our study clearly shows that in the outermost part of the dipole-like region, atr7 – 8 Re, there were no indications of any significant phenomena, which could cause the sudden fast inward transport of the plasma tubes at P1’s location by launching the tailward-propagating rarefaction wave propa-gating down the tail, as suggested in some versions of the Inside-Out scenario [Lui, 1996]. Neither large transport through the inner region, nor the significant pressure drop capable to launch the rarefaction wave are observed by the inner spacecraft. Vice versa, significant dipolarization/in-jection phenomena at P2 start later and are less intense than those observed at P1. Finally, the P1 and P2 probes are close enough (interspacecraft distance is less than 4 Re) to safely exclude the possibility, that the strong process capable of considerably changing the amount of magnetic flux or plasma in the very limited space between the two closely spaced spacecraft could be missed from observations.
[23] ‘‘Dipolarization’’ combined with ‘‘thinning’’ is a nontrivial combination. For geometrical reasons, a dipolar-ized tube normally has a larger height/thickness compared to its ‘‘stretched’’ neighbors. The inward propagation of a fast plasma flow tube, the likely result of a tailward source location (either reconnection or current disruption), or its braking; both processes are typically associated with the increase of the plasma sheet thickness (e.g., the simulation of plasma bubbles by Birn et al. [2004]). If the enhanced magnetic field diffusion occurs at the distance probed by the P1 spacecraft, it is usually associated with the increase of the current sheet thickness. Therefore the combination ‘‘dipolarization+plasma sheet thinning’’ may be an addi-tional important property to constrain the choice of sub-storm onset mechanism.
[24] The magnetic reconnection process provides the total pressure drop (unloading) and includes the inward plasma and flux transport (toward and through the reconnection separatrix) and dipolarization (see, e.g.,Baker et al.[1996] for a review). The outward expansion of accelerated plasma (plasma sheet expansion) which proceeds simultaneously with the plasma motion in the opposite direction (toward the
neutral sheet) is also explained by the reconnection model in case of lobe reconnection. However, the association of plasma sheet thinning and dipolarization does not automat-ically follow from the reconnection mechanism taken alone, without being implanted into the realistic magnetospheric configuration. In the next section we shall address this question by using the global 3d MHD simulations.
3.2. Interpretation of Fast Plasma Sheet Thinning Phase
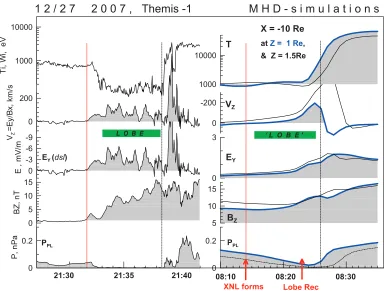
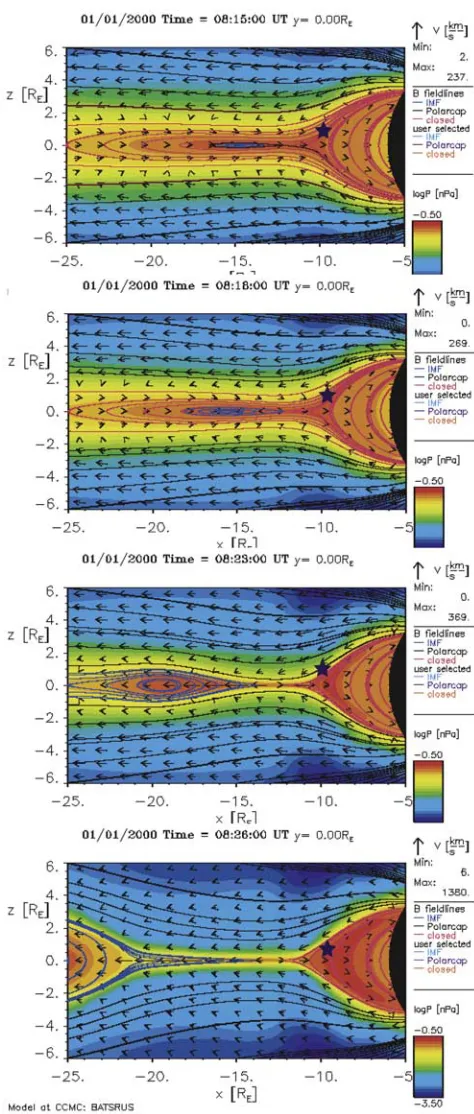
[25] In this section we shall demonstrate the results of global MHD simulations of the reconnection onset in the tail current sheet to show that two phenomena, namely, dipolarization and plasma sheet thinning, may be observed simultaneously in the transition region during a sudden increase of the reconnection rate for a nearby activeXline, staying a few Re from the observation point. For this purpose we utilize one of simulations made previously in Community Coordinated Modelling Center at NASA/GSFC (run Masha_Kuznetsova_092203_6a). In that case the BATSRUS code [Powell et al., 1999] was run with a very high spatial grid resolution of 1/16 Re in the tail current sheet region of interest.
[26] Figure 6 (right) provides the simulation results at 1-min time resolution near the reconnection onset time at X = 10 Re for two locations (at Z = 1 and 1.5 Re) in the same format as THEMIS observations shown in Figure 6 (left). Selected snapshots of the plasma configuration are collected in Figure 7. The simulated disturbance was driven by the solar wind with a strong southward IMF (Bz= 10 nT) which caused a rapid growth and thinning of the tail current at the initial stage. This thinning was enhanced after a reconnection X line started to develop at 0814 (of simulation time, ST) near X 15 Re, which occurred inside of the closed field lines, in the thin current sheet formed during the previous several minutes.
event, this simulation shows that it is principally possible to observe in the transition region (near 10 Re in case of simulations) a combination of thinning and dipolarization as a result of the development of the magnetic reconnection at a nearby (a few Re) location from the observation point.
[29] In the context of these simulations we can interpret our observations as follows. The sudden drop in the total pressure, increase ofEy,BzandVzcan be attributed to the explosive growth of reconnection in closed flux tubes at the distance of a few Re from probe P1. Similar large ampli-tudes of impulsive reconnection on closed field lines were previously shown to occur [Sergeev et al., 2008]. The following stage, during which the probe P1 exited into the lobe during a strong plasma inflow (large + Vz) in the absence of any energization of the outer plasma sheet may correspond to the episode of reconnection proceeding on closed field lines. We note that at a speed of Vz 50 – 100 km/s (i.e., 0.5 – 1 Re/min) observed at P1 in the first event, the entire closed magnetic flux contained in the plasma sheet at r 11 Re should be transported to the neutral sheet, reconnected and transported away (because the total pressure continues to decrease) in a couple of minutes. The last stage, with the sudden expansion of the heated plasma sheet, is natural to associate with lobe reconnection.
[30] The final verification of this scenario will certainly require the direct observations of the reconnection at the more tailward THEMIS spacecraft, which we hope will be
available after analyses of other events during the THEMIS mission.
4. Conclusions
[image:9.612.114.500.55.346.2][31] Simultaneous measurements during distinct substorm onsets near the midnight meridian made by two THEMIS probes, one in the inner region at 7 – 8 Re, and another one near the plasma sheet – lobe interface at 11 – 12 Re, show the earliest indication of the explosive onset and the largest flux transport rates to occur at the outermost spacecraft, con-firming that the source region was definitely atr> 11 Re in the midtail in these events. As seen by the observer near the plasma sheet boundary, the explosive process responsible for substorm onset is characterized by the fast unloading of the magnetic energy and fast transport of plasma tubes toward the neutral sheet leading to the fast plasma sheet thinning under the conditions of frozen-in plasma. This all occurred simultaneously with the local magnetic dipolariza-tion (Bzincrease), which is a nontrivial association because in most cases the dipolarized tubes have a larger thickness than their thin neighbors have. Only 6 – 8 min later, the plasma sheet expanded while the plasma tubes continued to move inward; the expanding plasma was considerably heated up to the boundary, and its density was reduced as compared to the preonset state. The process operated with fast transfer rates characterized byEyup to 5 mV/m in the Figure 6. Variations of basic parameters near the onset at the lobe – plasma sheet interface (left) as
impulsive regime; with correlating positiveEyandBz wave-forms. The observations are consistent with the Outside/IN scenario, in which the substorm process including current disruption is initiated tailward of >11 Re but not in the inner magnetosphere. With the support of the global MHD simulations we infer the basic process to be impulsive magnetic reconnection initiated in the closed flux tubes at a nearby location (a few Re) of the reconnectionXline.
[32] Acknowledgments. Data from the Intermagnet, IMAGE, and SAMNET magnetometer networks were used in this study as well as solar wind observations from ACE and Wind (from the OMNI Web site) and energetic particle data (from the LANL Web site). We thank all data providers as well as the developers of the BATSRUS code and the CCMC staff for making the global MHD simulations available. Thanks to K. H. Glassmeier, U. Auster, and W. Baumjohann for the use of FGM data provided under the lead of the Technical University of Braunschweig and with financial support through the German Ministry for Economy and Technology and the German Center for Aviation and Space (DLR) under contract 50 OC 0302. We thank M. Holeva and Amanda Prentice for their help in preparing the manuscript and A. Runov for help in the THEMIS data processing. The work was supported by THEMIS contract NAS5-02099. The work by V.S. and S.A. was also supported by Russian Ministry of Science grants, by RFBR grants 07-02-91703 and 07-05-91109 and CRDF grant 2861.
[33] Wolfgang Baumjohann thanks the reviewers for their assistance in evaluating this paper.
References
Angelopoulos, V. (2008), The THEMIS mission, Space Sci. Rev., doi:10.1007/s11214-008-9336-1, in press.
Angelopoulos, V., et al. (2008), First results from the THEMIS mission,
Space Sci. Rev., doi:10.1007/s11214-008-9378-4, in press.
Baker, D. N., T. I. Pulkkinen, V. Angelopoulos, W. Baumjohann, and R. L. McPherron (1996), Neutral line model of substorms: Past results and present view,J. Geophys. Res.,101, 12,975 – 13,010.
Birn, J., J. Raeder, Y. L. Wang, R. A. Wolf, and M. Hesse (2004), On the propagation of bubbles in the geomagnetic tail,Ann. Geophys.,22, 1773 – 1786.
Caan, M. N., R. L. McPherron, and C. T. Russell (1978), The statistical magnetic signature of the magnetospheric substorms,Planet. Space Sci.,
26, 269 – 279.
Dewhurst, J., P. C. J. Owen, A. N. Fazakerley, and A. Balogh (2004), Thinning and expansion of the substorm plasma sheet: Cluster PEACE timing analysis,Ann. Geophys.,22, 4165 – 4184.
Forbes, T. G., E. W. Hones Jr., S. J. Bame, J. R. Asbridge, G. Paschmann, N. Sckopke, and C. T. Russell (1981), Substorm-related plasma sheet motions as determined from differential timing of plasma changes at the ISEE satellites,J. Geophys. Res.,86(A5), 3459 – 3469.
Hones, E. W., Jr., T. Pytte, and H. I. West Jr. (1984), Associations of geomagnetic activity with plasma sheet thinning and expansion: A sta-tistical study,J. Geophys. Res.,89(A7), 5471 – 5478.
Kepko, L., M. G. Kivelson, and K. Yumoto (2001), Flow bursts, braking, and Pi2 pulsations,J. Geophys. Res.,106(A2), 1903 – 1915.
Lui, A. T. Y. (1996), Current disruption in the Earth’s magnetosphere: Observations and models,J. Geophys. Res.,101, 13,067 – 13,088. McFadden, J. P., C. W. Carlson, D. Larson, J. Bonnell, F. Mozer,
V. Angelopoulos, K.-H. Glassmeier, and U. Auster (2008), THEMIS ESA first science results and performance issues,Space Sci. Rev., doi:10.1007/ s11214-008-9433-1, in press.
McPherron, R. L., C. T. Russell, and M. P. Aubry (1973), Satellite studies of magnetospheric substorms on August 15, 1968: 9. Phenomenological model for substorms,J. Geophys. Res.,78(16), 3131 – 3149.
Nagai, T., M. Fujimoto, Y. Saito, S. Machida, T. Terasawa, R. Nakamura, T. Yamamoto, T. Mukai, A. Nishida, and S. Kokubun (1998), Structure and dynamics of magnetic reconnection for substorm onsets with Geotail observations,J. Geophys. Res.,103(A3), 4419 – 4440.
Ohtani, S.-I. (2004), Flowbursts in the plasma sheet and auroral substorm onset: Observational constraints on connection between midtail and near-Earth substorm processes,Space Sci. Rev.,113, 77 – 96.
Powell, K. G., P. L. Roe, T. J. Linde, T. I. Gombosi, and D. L. DeZeeuw (1999), A solution-adaptive upwind scheme for ideal magnetohydrody-namics,J. Comput. Phys.,154, 284 – 309.
[image:10.612.60.297.68.625.2]Sauvaud, J.-A., et al. (2004), Case studies of the dynamics of ionospheric ions in the Earth’s magnetotail, J. Geophys. Res., 109, A01212, doi:10.1029/2003JA009996.
Sergeev, V. A., T. Bosinger, R. D. Belian, G. D. Reeves, and T. E. Cayton (1992), Drifting holes in the energetic electron flux at geosynchronous orbit following substorm onset,J. Geophys. Res.,97, 6541 – 6549. Sergeev, V. A., L. I. Vagina, R. D. Elphinstone, J. S. Murphree, D. J. Hearn,
L. L. Cogger, and M. L. Johnson (1996), Comparison of UV optical signatures with the Substorm Current Wedge predicted by an inversion algorithm,J. Geophys. Res.,101, 2615 – 2627.
Sergeev, V. A., et al. (2005), Transition from substorm growth to substorm expansion phase as observed with a radial configuration of ISTP and Cluster spacecraft,Ann. Geophys.,23, 2183 – 2198.
Sergeev, V., et al. (2008), Study of near-Earth reconnection events with Cluster and Double Star,J. Geophys. Res.,113, A07S36, doi:10.1029/ 2007JA012902.
Yamaguchi, R., H. Kawano, S. Ohtani, S. Kokubun, and K. Yumoto (2004), Total pressure variations in the magnetotail as a function of the position
and the substorm magnitude, J. Geophys. Res., 109, A03206, doi:10.1029/2003JA010196.
V. Angelopoulos, Institute of Geophysics and Planetary Physics, University of California, Los Angeles, CA 90095, USA.
S. V. Apatenkov and V. Sergeev, St. Petersburg State University, St. Petersburg, 198504, Russia. ([email protected])
J. W. Bonnell, D. Larson, and J. P. McFadden, Space Sciences Laboratory, University of California, 7 Gauss Way, Berkeley, CA 94720, USA.
F. Honary, Department of Communication Systems, Lancaster University, Lancaster LA1 4YR, UK.
M. Kuznetsova, NASA Goddard Space Flight Center, Code 674, Greenbelt, MD 20771, USA.