Retraction Notice
Title of retracted article: Remote Sensing Techniques for Accurate and Consistent Detection of Small-Scale Changes in a Tropical Forest: Exploring Details of Forest Cover Dynamics Using Multi-Temporal Landat Imagery
Author(s): Gudina L. Feyisa1, Zerihun Kebebew, Kiflu H. Ali, Hirko D. Kanke, Andy Nelson
* Corresponding author. Email: fgudina@gmial
Journal: Natural Resources (NR)
Year: 2016
Volume: 6
Number: 12
Pages (from - to): 586 - 596
DOI (to PDF): http://dx.doi.org/10.4236/nr.2015.612056
Paper ID at SCIRP: 2000569
Article page: http://www.scirp.org/Journal/PaperInformation.aspx?PaperID=62169
Retraction date: 2016-03-15
Retraction initiative (multiple responses allowed; mark with X): All authors
XSome of the authors:
Editor with hints from Journal owner (publisher) Institution:
Reader:
Other:
Date initiative is launched: 2016-02-15
Retraction type (multiple responses allowed): Unreliable findings
Lab error Inconsistent data Analytical error Biased interpretation
Other:
Irreproducible results
Failure to disclose a major competing interest likely to influence interpretations or recommendations Unethical research
Fraud
Data fabrication Fake publication Other:
Plagiarism Self plagiarism Overlap Redundant publication *
Copyright infringement Other legal concern: Editorial reasons
Handling error Unreliable review(s) Decision error Other:
X Other: due to institutional policy of some of the authors
Results of publication (only one response allowed): are still valid.
Xwere found to be overall invalid.
Author's conduct (only one response allowed): honest error
academic misconduct
Xnone (not applicable in this case – e.g. in case of editorial reasons)
History
Expression of Concern: yes, date: yyyy-mm-dd Xno
Correction:
yes, date: yyyy-mm-dd Xno
Comment:
Free style text with summary of information from above and more details that can not be expressed by ticking boxes.
This article has been retracted to straighten the academic record. In making this decision the Editorial Board follows
Natural Resources, 2015, 6, 583-596
Published Online December 2015 in SciRes. http://www.scirp.org/journal/nr http://dx.doi.org/10.4236/nr.2015.612056
How to cite this paper: Feyisa, G.L., Kebebew, Z., Ali, K.H., Kanke, H.D. and Nelson, A. (2015) Remote Sensing Techniques for Accurate and Consistent Detection of Small-Scale Changes in a Tropical Forest: Exploring Details of Forest Cover Dy-namics Using Multi-Temporal Landat Imagery. Natural Resources, 6, 583-596. http://dx.doi.org/10.4236/nr.2015.612056
Remote Sensing Techniques for Accurate
and Consistent Detection of Small-Scale
Changes in a Tropical Forest: Exploring
Details of Forest Cover Dynamics Using
Multi-Temporal Landat Imagery
Gudina L. Feyisa
1*, Zerihun Kebebew
2, Kiflu H. Ali
2, Hirko D. Kanke
2, Andy Nelson
31Department of Botany and Plant Science, University of California, Riverside, USA 2Department of Natural Resource Management, Jimma University, Jimma, Ethiopia
3Faculty of Geo-Information Science and Earth Observation (ITC) of the University of Twente, Enschede,
Netherlands
Received 23 November 2015; accepted 21 December 2015; published 24 December 2015
Copyright © 2015 by authors and Scientific Research Publishing Inc.
This work is licensed under the Creative Commons Attribution International License (CC BY).
http://creativecommons.org/licenses/by/4.0/
Abstract
Remotely sensed information plays key role in detection and monitoring forest cover changes. While several advanced image analysis techniques are developed and described in the literature, remote sensing of forest cover changes often suffers from lack of accuracy and consistency of es-timates. In this study a sequential combination of decision tree and machine learning algorithms has been applied to improve accuracies. Six Landsat images were acquired at approximately 5 years intervals between years1986 and 2012. First, images were classified into vegetation and no- vegetation categories based on threshold value obtained from kernel density distribution of Nor-malized Difference Vegetation Index (NDVI). Non-vegetated categories were classified into barren and other cover types applying a bareness index. Support Vector Machine (SVM) was used to fur-ther classify forest into dense, medium and low canopy (>30%, 10% - 30% and <10% canopy) classes. Using this approach, minimum and maximum overall accuracy of 86.3% and 92.9%, and kappa coefficients of 0.82 and 0.90 were, respectively, achieved. Between years 1986 and 2012, annual losses of dense forest (canopy cover of >30%) was 1.1%. During the same time span, about 14% net gain in dense forest was shown in steep sloping terrains. However, magnitude of losses, gains and persistence of forest cover varied in time and spaces. Results presented in this study are useful for planning and implementing locally appropriate management interventions and policy strategies in order to halt the rapid rate of forest destruction in Belete and other similar forest ecosystems.
*Corresponding author.
Keywords
Accuracy, Classification, Forest Cover Change, Landsat, Remote Sensing, Land Use, Support Vector Machine
1. Introduction
Conversion of forest lands into other land uses often results in degradation of environmental conditions [1]. With increasing demand for forest products and land for food production, pressure on forest reserves is increas-ing [2] [3] and this is of particular environmental concern in many tropical countries [2] [4]. Ethiopia has al-ready experienced drastic deforestation and consequent land degradation and other undesirable environmental problems [5] [6]. Forest cover changes in tropical areas are often small-scale complex in patterns [7] [8]. While forest land conversion is a local process, it may result in global scale environmental changes such as enhanced greenhouse emissions [1] [9], and at the same time local communities who are heavily dependent on natural re-sources are likely to be impacted by immediate local consequences such as soil and water degradation [10] [11]. Timely detection and monitoring of tropical forest cover changes are essential in halting global and local
en-vironmental challenges and enabling informed decision making processes [12] [13]. The Landsat data archive
made available, free of change, by United States Geological Survey [14] and advances in geospatial technolo-gies such as cloud computing [15] have created opportunities for high temporal resolution forest change
moni-toring [16]-[18]. A number of remote sensing techniques of detecting and monitoring changes in forest cover
have been developed and discussed in the literature [13] [16] [17] [18]-[21].
Despite the contribution of a number of studies in developing methods for assessment of global forest cover dynamics at high spatial resolution [22]-[25], methods that accurately detect small-scale forest cover changes in tropical environments is still lacking. Due to cloud contaminations [24] [26]-[28] and gaps in the Landsat arc-hive [25] [29], detailed spatial information that enables long-term tracking of small-scale forest cover changes in tropical environments is still lacking [27]. In tropical areas such as sub-Saharan Africa, small-scale deforestation is a prominent forest change process [7] [8] and detection and monitoring systems for these processes are gener-ally lacking [27]. Forest cover change estimates are generally inconsistent [4] [16] [30] [31], which may lead to large uncertainty of global and regional forest cover trend analysis [16] [32].
In this paper, a sequential combination of index-based and machine learning algorithm were applied to ana-lyze spatio-temporal dynamics of forest cover in Belete-Gera forest. The studied forest is part of an eco-region that serve as home of genetic diversity of Coffee arabica L. [33]. Despite its vital ecological and economic im-portance as well as its global significance in serving as a gene pool of Coffee arabica L. [33], an accurate and timely tracking of changes in the forest is lacking. This study, therefore, aims at exploring techniques that enable accurate detection of small-scale changes over three decades and improving knowledge of the dynamics of a key forest ecosystem in Ethiopia using Landat imagery. Hence, the objectives of this study were: 1) developing analysis methods that are accurate in detecting small scale changes in a tropical forest environment; 2) demon-strating magnitudes, direction and spatial patterns of changes.
2. Methods
2.1. Study Area
Belete forest is part of Belete-Gera eco-region and is one of the national forest priority areas in Ethiopia. The forest is managed by Oromia Regional State and located in Jimma Zone, about 42 km Southwest of Jimma town (Figure 1). The forest is situated between lat-long of 36˚15'E and 36˚45'E, and latitudes 7˚30'N and 7˚45'N. Be-lete forest is characterized by humid tropical climate and receives a mean annual rainfall ranging from 1800 mm to 2300 mm and the annual mean temperature of the area is 20˚C. Average altitude is 2100 m.a.s.l and the terrain is dominated by rugged and slopping surfaces. Belete-Gera national forest priority area is one of the Afromon-tane biodiversity hotspots and constitutes one of the most threatened natural forest ecosystems in Ethiopia [34] [35]. The forest is a key eco-region for biodiversity conservation, including genetic diversity conservation of
Coffee arabica.
G. L. Feyisa et al.
Figure 1.Study area map.
2.2. Data Sources and Pre-Processing
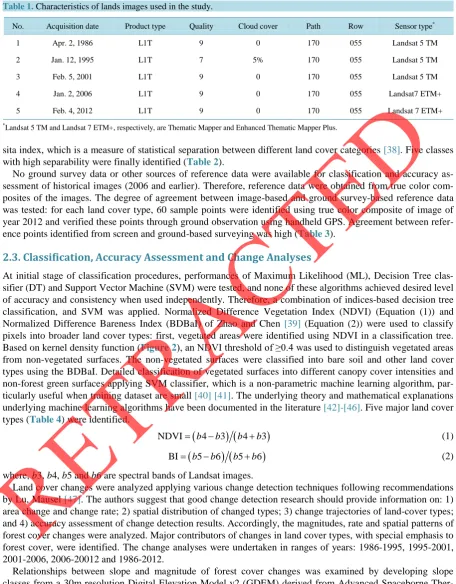
Imagery acquired by sensors of Landsat Thematic Mapper and Enhanced Thematic Mapper Plus satellites (path 170 and row 55) were used. The imagery were downloaded free of charge from United States Geological Survey (USGS) data portal [14]. All the imagery used were of low or no cloud cover and acquired during dry seasons of the years between 1986 and 2012, at approximately 5 years intervals. The selected months of the year were not only suitable for obtaining cloud-free images, but also assumed that confusion in spectral signatures of forest and non-forest green vegetation such as agricultural crops and grasslands could be minimized and the contrast between forest and non-forest land uses is maximized during dry seasons. Since the area is dominated by rain fed agriculture, spectral contrast between forest and agricultural lands is expected to be higher during dry sea-sons. The path 170 and row 55 covers more than 90% of Belete forest, and the remaining part of the forest is covered by the adjacent scene. Due to lack of multi-temporal good quality images in the remaining portion of the forest, the study area was restricted to path 170 and row 55. The portion of the forest which is not covered by this study is shown in Figure 1. The major characteristics of Landsat images used in this study are summarized in Table 1.
Atmospheric correction was applied to all images using the Quick Atmospheric Correction (QUAC) module
in ENVI [36]. All images were rectified to Universal Transverse Mercator (UTM) zone 37 N, datum WGS-84
and co-registered with less than 0.5 pixel mean square error for all images. Due to the instrument malfunction on May 31, 2003 (failure of the Scan Line Corrector), images acquired by Landsat 7 from this date onwards have stripes of data gaps and the gaps make up about 22% of the data on any given scene [37]. Therefore, Landsat 7 ETM+ images used in this study were gap filled using two images from consecutive months by applying a gap-filling tool in ENVI v. 4.8 [36].
Reference data were collected through ground-based characterization of the existing land cover types in March 2012. Polygons and point reference data corresponding to 1181 Landsat pixels were collected during the field survey. Smaller areas were sampled as points by assuming a center of 30 m by 30 m square grid to match the pixel size of the Landsat reflective bands, while large homogenous areas were marked as polygons. Major land cover types of the area were characterized through discussion with local people and visual interpretations. Forest canopy cover was also estimated visually and with a densiometer. The time difference between image acquisition and ground surveying was about one month and no major land cover change was assumed to have occurred within this time difference. Initially seven land cover types were characterized during the field survey. The separability in spectral signature of the selected seven land cover types was tested applying Jeffries-Matu-
Table 1. Characteristics of lands images used in the study.
No. Acquisition date Product type Quality Cloud cover Path Row Sensor type*
1 Apr. 2, 1986 L1T 9 0 170 055 Landsat 5 TM
2 Jan. 12, 1995 L1T 7 5% 170 055 Landsat 5 TM
3 Feb. 5, 2001 L1T 9 0 170 055 Landsat 5 TM
4 Jan. 2, 2006 L1T 9 0 170 055 Landsat7 ETM+
5 Feb. 4, 2012 L1T 9 0 170 055 Landsat 7 ETM+
*
Landsat 5 TM and Landsat 7 ETM+, respectively, are Thematic Mapper and Enhanced Thematic Mapper Plus.
sita index, which is a measure of statistical separation between different land cover categories [38]. Five classes with high separability were finally identified (Table 2).
No ground survey data or other sources of reference data were available for classification and accuracy as-sessment of historical images (2006 and earlier). Therefore, reference data were obtained from true color com-posites of the images. The degree of agreement between image-based and ground survey-based reference data was tested: for each land cover type, 60 sample points were identified using true color composite of image of year 2012 and verified these points through ground observation using handheld GPS. Agreement between refer-ence points identified from screen and ground-based surveying was high (Table 3).
2.3. Classification, Accuracy Assessment and Change Analyses
At initial stage of classification procedures, performances of Maximum Likelihood (ML), Decision Tree clas-sifier (DT) and Support Vector Machine (SVM) were tested, and none of these algorithms achieved desired level of accuracy and consistency when used independently. Therefore, a combination of indices-based decision tree classification, and SVM was applied. Normalized Difference Vegetation Index (NDVI) (Equation (1)) and
Normalized Difference Bareness Index (BDBaI) of Zhao and Chen [39] (Equation (2)) were used to classify
pixels into broader land cover types: first, vegetated areas were identified using NDVI in a classification tree. Based on kernel density function (Figure 2), an NDVI threshold of ≥0.4 was used to distinguish vegetated areas from non-vegetated surfaces. The non-vegetated surfaces were classified into bare soil and other land cover types using the BDBaI. Detailed classification of vegetated surfaces into different canopy cover intensities and non-forest green surfaces applying SVM classifier, which is a non-parametric machine learning algorithm, par-ticularly useful when training dataset are small [40] [41]. The underlying theory and mathematical explanations underlying machine learning algorithms have been documented in the literature [42]-[46]. Five major land cover types (Table 4) were identified.
(
) (
)
NDVI= b4−b3 b4+b3 (1)
(
) (
)
BI= b5−b6 b5+b6 (2)
where, b3, b4, b5 and b6 are spectral bands of Landsat images.
Land cover changes were analyzed applying various change detection techniques following recommendations by Lu, Mausel [47]. The authors suggest that good change detection research should provide information on: 1) area change and change rate; 2) spatial distribution of changed types; 3) change trajectories of land-cover types; and 4) accuracy assessment of change detection results. Accordingly, the magnitudes, rate and spatial patterns of forest cover changes were analyzed. Major contributors of changes in land cover types, with special emphasis to forest cover, were identified. The change analyses were undertaken in ranges of years: 1986-1995, 1995-2001, 2001-2006, 2006-20012 and 1986-2012.
Relationships between slope and magnitude of forest cover changes was examined by developing slope classes from a 30m resolution Digital Elevation Model v2 (GDEM) derived from Advanced Spaceborne
Ther-mal Emission and Reflection Radiometer (ASTER) and released jointly by METI/NASA [48]. Five slope classes
were produced: 0% - 10%, 10% - 20%, 20% - 30%, 30% - 40% and >40% slope (Figure 3). Spatial zonal change analysis was undertaken to examine the nature of forest cover change within each of these slope catego-ries.
G. L. Feyisa et al.
Figure 2. Kernel density of NDVI values of different surfaces.
Table 2. Summary of separability index. Jeffries-Matusita separability index value in bold show highly separable pairs.
Land cover type
Jeffries-Matusita index value
Coniferous plantation
>30% Natural forest
10% - 30% Natural forest
Coffee
forest Semi-green Soil
Other non forest veg.
Coniferous plantation - 1.66 1.92 1.69 1.91 2.00 2.00
>30% natural forest 1.66 - 1.90 1.73 1.90 2.00 1.97
10% - 30% natural forest 1.92 1.90 - 1.65 1.90 1.98 1.96
Coffee forest 1.69 1.73 1.65 - 1.95 0.98 0.85
Semi-green 1.91 1.90 1.90 1.95 - 1.98 1.96
Soil 2.00 2.00 1.98 0.98 1.98 - 1.95
Other non forest veg. 2.00 1.97 1.96 0.85 1.96 1.95 -
Table 3. Matrix of agreement between image-based and field survey-based reference data. A = Forest (>30% canopy), B = Forest (10% - 30% canopy), C = Non-forest vegetation, D = Fallow agriculture and other non-vegetated surfaces, E = Bare soil.
LCT
Reference data from image
A B C D E
Ground observation
A 57 3 0 0 0
B 3 56 1 0 0
C 0 1 58 0 1
D 0 0 4 60 2
E 0 0 5 0 57
Total 60 60 60 60 60
Percent agreement 95 93.3 96.7 100 95
Figure 3. Slope classes of Belete forest.
Table 4. Descriptions of land cover classes.
Land cover type Description
Forest (>30% canopy)
Dense forest which include:
Primary and secondary natural forest with principal species Aningeria adolffii fredricci, Polytius fulva, Olea hochistetere, Syzegium guuneens, Ficus sur);
Coffee forest (principal species Coffee arabica, Alebizia spp., Melitia frugenia, Croton machrstachus); Plantation forest (Cupresses lustanica, Pinus patula and Eucalyptus spp.)
Forest (10% - 30% canopy) Forest areas with generally similar characteristics as the dense forest described above, but with low canopy cover intensity and heavily degraded
Non-forest vegetation Green areas such as grass lands with scattered shrubs or trees
Fallow agriculture land, dry vegetation and other land covers
Agricultural or fallow land with semi-green, dried field crop residue covering surfaces, dried grazing land, roads and other artificial surfaces such as settlement and road
Bare soil Exposed dry organic and mineral soils. This land cover type is primarily agricultural lands which are either ploughed fields or exposed soils with no crop residue, or no other forms of vegetation
Error matrices were used to assess classification accuracy [49]. User’s and producer’s accuracies, overall ac-curacy and the Kappa statistic were calculated in ENVI v. 4.8 [36] for each of the classified images. Accuracy assessment of change maps was estimated by multiplying the individual classification map overall accuracies
[50].
3. Results
[image:8.595.81.541.82.607.2]3.1. Land Cover Classification and Accuracies
Figure 4shows producer’s and user’s accuracy for each land cover category and each of the classified images.
Overall accuracy and kappa statistics were computed and summarized in Table 5. Minimum and maximum
overall classification accuracy was 86.3% and 92.9%, respectively. The summary of change detection accuracy is also presented inTable 6. Visual interpretation of the classification outputs clearly show spatial extents and patterns of changes in forest areas are more evident in recent years (2006 and 2012).
G. L. Feyisa et al.
Figure 4.Land cover classes of years 1986, 1995, 2001, 2006 and 2012.
Table 5. Producer’s and user’s accuracy of classification by year (%).
1986 1995 2001 2006 2012
Class Prod. User’s Prod. User’s Prod. User’s Prod. User’s Prod. User’s
Fallow agri. 78 95 93 95 96 92 90 94 72 84
Bare soil 93 95 88 96 91 98 96 97 98 93
Forest (>30%) 94 91 92 88 94 97 100 91 98 86
Forest (10% - 30%) 82 83 78 75 83 76 82 95 69 87
Non-forest veg 89 61 79 75 87 85 81 72 72 73
Table 6. Summary of accuracy measures.
Year Overall accuracy (%) Kappa coefficient Period Change detection accuracy
1986 86.9 0.83 1986-1995 76.2
1995 87.7 0.84 1995-2001 80.3
2001 91.6 0.89 2001-2006 85.1
2006 92.9 0.90 2006-2012 80.2
2012 86.3 0.82 1986-2012 75.0
Figure 5.Trends of changes in land cover types. Clear linear declining trend of high canopy cover forest rapid increase in bare soil are shown. Trends for other land cover types is not obvious.
Figure 6. Maps showing areas of gains (increase in extent), losses (reduction in extent) and persistence (areas with no
change in extent) between 1986-2012 for: (a) high canopy forest (>30% canopy); (b) bare soil; (c) low canopy forest (10% - 30% canopy); (d) agriculture and other land cover types.
3.2. Trends and Patterns of Changes in Land Cover Types
Closed canopy cover forest category was shown to be consistently declining during the periods 1986 to 2012. Bare soil class followed rapid increase, while other categories of vegetated classes didn’t follow clear trends (Figure 5). Spatial patterns of gains, losses and persistence of the major land cover types is depicted inFigure 6. Net change in closed canopy cover forest (>30% canopy) is consistently negative across all pairs of compared periods and losses between year 1986 and 2012 was 28.6% (~1.1% loss per year). Fastest annual rate of decline (3.8%) in high canopy forest was shown between 1995 and 2001 Trend of changes in forest with <30% canopy cover was not clear, but compared to year 1986, forest in low canopy cover category showed slight positive trend. It should be noted that positive changes in low canopy cover forest is mainly due to large losses in high canopy cover forest (Figure 5 &Figure6).
(a) (b)
(c) (d)
Gain Persistence Losses
Meter 400
G. L. Feyisa et al.
As shown in Figure 7, the largest contributor for high forest loss was bare soil, followed by low intensity for-est. Exchange between high forest and other land cover types are shown in. Though there were some areas where bare soil is converted to high forest, large amount of peripheral parts of the forest areas were converted from forest to bare (Figure 8).
Spatial analysis of relationships between slope categories and magnitude of forest cover change shows that there is differential rate of changes among various slope classes. The maximum forest cover loss took place in lowest slope range of 0% - 10%, followed by slope category 10% - 20%. There was about 14% net gain in forest cover within steepest slope category (>40%). Figurer 9 shows spatial patterns of forest cover in different slope categories. Compared to year 1986, relatively more areas with high canopy cover are shown in steep sloping terrains in year 2012 (Figure 9).
4. Discussion and Conclusion
In an effort to contribute to accurate detection and monitoring of small-sale tropical forest changes, this paper presents a detailed investigation of dynamics of Belete forest cover in Southwest Ethiopia applying multi-tem- poral Landat imagery analyses. In this paper where combination of NDVI, NDBaI and SVM classifications were applied, minimum and maximum overall accuracy of 86.3% and 92.9%, respectively, were achieved. The me-thod implemented in this paper is highly accurate, given that limited ground-based information is available in the studied area. The approach is relatively simple and particularly useful in conditions where historical spatial data are not available or insufficient. While accuracies could depend on multiple factors, classification method is one of the most important factor determining accuracies of remotely sensed information. DeVries, Verbesselt
[27] have applied NDVI time series analysis for small-scale tropical forest change monitoring and achieved overall accuracy of 78%.
This study showed a consistent decline in high canopy (>30%) forest category, and slight increasing trends in low canopy cover forest (<30% canopy). The annual declining rate of 1.1% is substantially larger than results from comparable studies. Two studies undertaken in similar ecosystems of Ethiopia showed about 0.4% annual forest loss [27] [51]. However, direct comparisons of these values could be difficult due to variation in time span and levels of details used in the change analyses. Several studies have shown wide range of forest cover change rates [22] [52] [53]. Accuracies and levels of details forest cover information also considerably vary across
Figure 7. Transition from high forest (>30% canopy) to: (a) fallow agriculture
and other non-vegetated land covers; (b) to low intensity forest (10% - 30% ca-nopy cover); (c) bare soil; (d) non-forest vegetation.
(a) (b)
(c) (d)
[image:11.595.74.509.259.677.2]Figure 8. Exchange between high canopy cover forest and other land cover types (1986-2012).
Figure 9. Forest cover on different slope categories.
the studies.
In this study, drastic decline in high canopy forest was observed between 1995 and 2001, which could be re-lated to regime change that occurred in the country in 1991, that might have led to institutional weakening the-reby exacerbating illegal selective logging [54] [55]. Not surprisingly, it is evident that the main contributor of high forest loss is conversion to agricultural lands. The loss of high forest cover to low intensity forest could al-so be a good indication that the forest is not only declining in spatial extent but alal-so the quality is considerably degrading. It is an interesting observation that steep sloping areas have experienced net gain of about 14% forest. This is, in some way, consistent with findings of, for instance, Armenteras, Rodríguez [56], Htun, Mizoue [57],
and Robalino and Pfaff [58], who generally reported a negative relationship between slope and magnitude of
deforestation. The net forest cover gain in steep slope areas detected in this study, however, may require further investigations.
The findings imply that sustainability of this key ecosystem could be questionable. Persistent decline in the forest cover, particularly the loss of dense canopy forest could potentially lead to losses in a number of
ecosys-1986 2012
G. L. Feyisa et al.
tem services such as reduction in carbon sink potential [59], loss or reduction in its biodiversity conservation values [35], particularly the potentials of the forest in conservation of genetic diversity Coffee arabica L. [33] [60] [61], and other multiple benefits [62]. The forest destruction information shown in this study could support effective management and policy interventions that aim at sustaining the forest and its environmental services. The spatial and temporal details of forest dynamics provided through accurate extraction of remotely sensed in-formation could benefit global conservation and management programs such as REDD+ (Reducing Emissions from Deforestation and Forest Degradation) and a deeper understanding of local human and biophysical va-riables determining degrees and forms of forest cover changes could be instrumental for effective planning and policy measures at all levels.
Therefore, this study is a contribution to efforts being made to better understand dynamics of tropical forests, which often occur at small scales. Further studies exploring the links between forest, local socioeconomics and policies could be useful in understanding the underlying drivers of the observed changes. Moreover, studies on operational usability of remotely sensed spatial information in local planning and decision making processes should focus on tropical areas where data are generally lacking or of low quality. Increasing availability of high quality and cost-free remotely sensed data and development of several image analysis algorithms are great op-portunities that can enable near-real time monitoring and detection of changes in forest cover.
Fund
This research was supported by fund from International Foundation for Science (IFS) grant number C5033- FEYISA.
References
[1] Foley, J.A., DeFries, R., Asner, G.P., Barford, C., Bonan, G., Carpenter, S.R., Chapin, F.S., Coe, M.T., Daily, G.C. and Gibbs, H.K. (2005) Global Consequences of Land Use. Science, 309, 570-574.
http://dx.doi.org/10.1126/science.1111772
[2] Geist, H.J. and Lambin, E.F. (2002) Proximate Causes and Underlying Driving Forces of Tropical Deforestation Trop-ical Forests are Disappearing as the Result of Many Pressures, Both Local and Regional, Acting in Various Combina-tions in Different Geographical LocaCombina-tions. BioScience, 52, 143-150.
http://dx.doi.org/10.1641/0006-3568(2002)052[0143:PCAUDF]2.0.CO;2
[3] Lambin, E.F. and Meyfroidt, P. (2011) Global Land Use Change, Economic Globalization, and the Looming Land Scarcity. Proceedings of the National Academy of Sciences, 108, 3465-3472.
http://dx.doi.org/10.1073/pnas.1100480108
[4] Gibbs, H.K., Ruesch, A., Achard, F., Clayton, M., Holmgren, P., Ramankutty, N. and Foley, J. (2010) Tropical Forests Were the Primary Sources of New Agricultural Land in the 1980s and 1990s. Proceedings of the National Academy of Sciences, 107, 16732-16737. http://dx.doi.org/10.1073/pnas.0910275107
[5] Tadesse, W.G., Demel, T., Denich, M. and Borsch, T. (2001) Diversity of Traditional Coffee Production Systems in Ethiopia and Their Contribution for the Conservation of Coffee Genetic Diversity. In: Tropentag, D., Ed., Conference on International Agricultural Research for Development, Bonn.
[6] Nyssen, J., Poesen, J., Moeyersons, J., Deckers, J., Haile, M. and Lang, A. (2004) Human Impact on the Environment in the Ethiopian and Eritrean highlands—A State of the Art. Earth-Science Reviews, 64, 273-320.
http://dx.doi.org/10.1016/S0012-8252(03)00078-3
[7] Fisher, B. (2010) African Exception to Drivers of Deforestation. Nature Geoscience, 3, 375-376.
http://dx.doi.org/10.1038/ngeo873
[8] Joseph, S., Herold, M., Sunderlin, W.D. and Verchot, L.V. (2013) REDD+ Readiness: Early Insights on Monitoring, Reporting and Verification Systems of Project Developers. Environmental Research Letters, 8, 034038.
http://dx.doi.org/10.1088/1748-9326/8/3/034038
[9] Achard, F., Beuchle, R., Mayaux, P., Stibig, H.-J., Bodart, C., Brink, A., Carboni, S., Desclée, B., Donnay, F., Eva, H.D., et al. (2014) Determination of Tropical Deforestation Rates and Related Carbon Losses from 1990 to 2010.
Global Change Biology, 20, 2540-2554. http://dx.doi.org/10.1111/gcb.12605
[10] Madhurima, C. and Banerjee, A. (2013) Forest Degradation and Livelihood of Local Communities in India: A Human Rights Approach. Journal of Horticulture and Forestry, 5, 122-129.
[11] Demessie, A., Singh, B.R. and Lal, R. (2015) Land Degradation and Soil Carbon Pool in Different Land Uses and Their Implication for Food Security in Southern Ethiopia. In: Sustainable Intensification to Advance Food Security and
Enhance Climate Resilience in Africa, Springer, Berlin, 45-62.
[12] Squires, G.D. (2002) Urban Sprawl and the Uneven Development of Metropolitan America. In: Squires, G.D., Ed.,
Urban Sprawl: Causes, Consequences and Policy Responses, The Urban Institute Press, Washington DC.
[13] Whittle, M., Quegan, S., Uryu, Y., Stüewe, M. and Yulianto, K. (2012) Detection of Tropical Deforestation Using ALOS-PALSAR: A Sumatran Case Study. Remote Sensing of Environment, 124, 83-98.
http://dx.doi.org/10.1016/j.rse.2012.04.027
[14] United States Geological Survey (2012) Landsat Data Archive, Multiple Dates. http://glovis.usgs.gov
[15] Evangelidis, K., Ntouros, K., Makridis, S. and Papatheodorou, C. (2014) Geospatial Services in the Cloud. Computers
& Geosciences, 63, 116-122.
http://dx.doi.org/10.1016/j.cageo.2013.10.007
[16] Wulder, M.A., Masek, J.G., Cohen, W.B., Loveland, T.R. and Woodcock, C.E. (2012) Opening the Archive: How Free Data Has Enabled the Science and Monitoring Promise of Landsat. Remote Sensing of Environment, 122, 2-10.
http://dx.doi.org/10.1016/j.rse.2012.01.010
[17] Boyd, D. and Danson, F. (2005) Satellite Remote Sensing of Forest Resources: Three Decades of Research Develop-ment. Progress in Physical Geography, 29, 1-26. http://dx.doi.org/10.1191/0309133305pp432ra
[18] Goetz, S. and Dubayah, R. (2011) Advances in Remote Sensing Technology and Implications for Measuring and Mon-itoring Forest Carbon Stocks and Change. Carbon Management, 2, 231-244. http://dx.doi.org/10.4155/cmt.11.18
[19] Hansen, M.C., Stehman, S.V. and Potapov, P.V. (2010) Quantification of Global Gross Forest Cover Loss. Proceed-ings of the National Academy of Sciences of the United States of America, 107, 8650-8655.
http://dx.doi.org/10.1073/pnas.0912668107
[20] Lehmann, E.A., Caccetta, P., Lowell, K., Mitchell, A., Zhou, Z.-S., Held, A., Milne, T. and Tapley, I. (2015) SAR and Optical Remote Sensing: Assessment of Complementarity and Interoperability in the Context of a Large-Scale Opera-tional Forest Monitoring System. Remote Sensing of Environment, 156, 335-348.
http://dx.doi.org/10.1016/j.rse.2014.09.034
[21] Verbesselt, J., Hyndman, R., Newnham, G. and Culvenor, D. (2010) Detecting Trend and Seasonal Changes in Satellite Image Time Series. Remote Sensing of Environment, 114, 106-115. http://dx.doi.org/10.1016/j.rse.2009.08.014
[22] Hansen, M.C., Potapov, P.V., Moore, R., Hancher, M., Turubanova, S., Tyukavina, A., Thau, D., Stehman, S., Goetz, S. and Loveland, T. (2013) High-Resolution Global Maps of 21st-Century Forest Cover Change. Science, 342, 850-853.
http://dx.doi.org/10.1126/science.1244693
[23] Sexton, J.O., Song, X.-P., Feng, M., Noojipady, P., Anand, A., Huang, C., Kim, D.-H., Collins, K.M., Channan, S. and DiMiceli, C. (2013) Global, 30-m Resolution Continuous Fields of Tree Cover: Landsat-Based Rescaling of MODIS Vegetation Continuous Fields with Lidar-Based Estimates of Error. International Journal of Digital Earth, 6, 427-448. http://dx.doi.org/10.1080/17538947.2013.786146
[24] Townshend, J.R., Masek, J.G., Huang, C., Vermote, E.F., Gao, F., Channan, S., Sexton, J.O., Feng, M., Narasimhan, R. and Kim, D. (2012) Global Characterization and Monitoring of Forest Cover Using Landsat Data: Opportunities and Challenges. International Journal of Digital Earth, 5, 373-397. http://dx.doi.org/10.1080/17538947.2012.713190
[25] Potapov, P., Turubanova, S., Hansen, M.C., Zhuravleva, I., Yaroshenko, A. and Laestadius, L. (2012) Monitoring For-est Loss and Degradation at National to Global Scales Using Landsat Data. In: Achard, F. and Hansen, M., Eds., Glob-al Forest Monitoring from Earth Observation, Taylor and Francis, New York, 143.
[26] Duveiller, G., Defourny, P., Desclée, B. and Mayaux, P. (2008) Deforestation in Central Africa: Estimates at Regional, National and Landscape Levels by Advanced Processing of Systematically-Distributed Landsat Extracts. Remote Sensing of Environment, 112, 1969-1981. http://dx.doi.org/10.1016/j.rse.2007.07.026
[27] DeVries, B., Verbesselt, J., Kooistra, L. and Herold, M. (2015) Robust Monitoring of Small-Scale Forest Disturbances in a Tropical Montane Forest Using Landsat Time Series. Remote Sensing of Environment, 161, 107-121.
http://dx.doi.org/10.1016/j.rse.2015.02.012
[28] Mitchard, E., Saatchi, S., White, L., Abernethy, K., Jeffery, K., Lewis, S., Collins, M., Lefsky, M., Leal, M. and Woodhouse, I. (2011) Mapping Tropical Forest Biomass with Radar and Spaceborne LiDAR: Overcoming Problems of High Biomass and Persistent Cloud. Biogeosciences Discussions, 8, 8781-8815.
http://dx.doi.org/10.5194/bgd-8-8781-2011
[29] Broich, M., Hansen, M.C., Potapov, P., Adusei, B., Lindquist, E. and Stehman, S.V. (2011) Time-Series Analysis of Multi-Resolution Optical Imagery for Quantifying Forest Cover Loss in Sumatra and Kalimantan, Indonesia. Interna-tional Journal of Applied Earth Observation and Geoinformation, 13, 277-291.
http://dx.doi.org/10.1016/j.jag.2010.11.004
[30] Jamali, S., Jönsson, P., Eklundh, L., Ardö, J. and Seaquist, J. (2015) Detecting Changes in Vegetation Trends Using Time Series Segmentation. Remote Sensing of Environment, 156, 182-195. http://dx.doi.org/10.1016/j.rse.2014.09.010
G. L. Feyisa et al.
[31] Griffiths, P., Kuemmerle, T., Baumann, M., Radeloff, V.C., Abrudan, I.V., Lieskovsky, J., Munteanu, C., Ostapowicz, K. and Hostert, P. (2013) Forest Disturbances, Forest Recovery and Changes in Forest Types across the Carpathian Ecoregion from 1985 to 2010 Based on Landsat Image Composites. Remote Sensing of Environment, 151, 72-88. [32] Grainger, A. (2008) Difficulties in Tracking the Long-Term Global Trend in Tropical Forest Area. Proceedings of the
National Academy of Sciences of the United States of America, 105, 818-823.
http://dx.doi.org/10.1073/pnas.0703015105
[33] Aerts, R., Berecha, G., Gijbels, P., Hundera, K., Glabeke, S., Vandepitte, K., Muys, B., Roldán-Ruiz, I. and Honnay, O. (2013) Genetic Variation and Risks of Introgression in the Wild Coffea arabica Gene Pool in South-Western Ethiopian Montane Rainforests. Evolutionary Applications, 6, 243-252. http://dx.doi.org/10.1111/j.1752-4571.2012.00285.x
[34] Takahashi, R. and Todo, Y. (2013) The Impact of a Shade Coffee Certification Program on Forest Conservation: A Case Study from a Wild Coffee Forest in Ethiopia. Journal of Environmental Management, 130, 48-54.
http://dx.doi.org/10.1016/j.jenvman.2013.08.025
[35] Gebrehiwot, K. and Hundera, K. (2014) Species Composition, Plant Community Structure and Natural Regeneration Status of Belete Moist Evergreen Montane Forest, Oromia Regional State, Southwestern Ethiopia. Momona Ethiopian Journal of Science, 6, 97-101.
[36] Exelis Visual Information Solutions (2010) ENVIv. 4.8, Boulder, Colorado.
[37] USGS. SLC-Off Products: Background. 2007.
http://landsat.usgs.gov/data_products/slc_off_data_products/slc_off_background.php
[38] Lillesand, T.M., Kiefer, R.W. and Chipman, J.W. (2004) Remote Sensing and Image Interpretation. 5th Edition, John Wiley & Sons, Inc., Hoboken.
[39] Zhao, H. and Chen, X. (2005) Use of Normalized Difference Bareness Index in Quickly Mapping Bare Areas from TM/ETM+. Proceedings of 2005 IEEE InternationalGeoscience and Remote Sensing Symposium, 3, 1666-1668. [40] Pal, M. and Mather, P. (2005) Support Vector Machines for Classification in Remote Sensing. International Journal of
Remote Sensing, 26, 1007-1011. http://dx.doi.org/10.1080/01431160512331314083
[41] Mountrakis, G., Im, J. and Ogole, C. (2011) Support Vector Machines in Remote Sensing: A Review. ISPRS Journal of Photogrammetry and Remote Sensing, 66, 247-259. http://dx.doi.org/10.1016/j.isprsjprs.2010.11.001
[42] Ben-Hur, A. and Weston, J. (2010) A User’s Guide to Support Vector Machines. In: Ben-Hur, A. and Weston, J., Eds.,
Data Mining Techniques for the Life Sciences, Humana Press, New York, 223-239.
[43] Pal, M. (2005) Random Forest Classifier for Remote Sensing Classification. International Journal of Remote Sensing,
26, 217-222. http://dx.doi.org/10.1080/01431160412331269698
[44] Pal, M. and Mather, P.M. (2005) Support Vector Machines for Classification in Remote Sensing. International Journal of Remote Sensing, 26, 1007-1011. http://dx.doi.org/10.1080/01431160512331314083
[45] Lek, S. and Guégan, J.-F. (2012) Artificial Neuronal Networks: Application to Ecology and Evolution. Springer Science & Business Media, Berlin.
[46] Michie, D., Spiegelhalter, D.J. and Taylor, C.C. (1994) Machine Learning, Neural and Statistical Classification.
[47] Lu, D., Mausel, P., Brondizio, E. and Moran, E. (2004) Change Detection Techniques. International Journal of Remote Sensing, 25, 2365-2401.http://dx.doi.org/10.1080/0143116031000139863
[48] METI/NASA, M.o.E. Trade and Industry (METI) of Japan and the United States National Aeronautics and Space Ad-ministration (NASA). Release Version 2 ASTER Global DEM (2011).
http://gdem.ersdac.jspacesystems.or.jp/search.jsp
[49] Congalton, R.G. and Green, K. (1999) Assessing the Accuracy of Remotely Sensed Data: Principles and Practices. Lewis Publishers, Boca Raton, London, New York.
[50] Yuan, D., Elvidge, C.D. and Lunetta, R.S. (1999) Survey of Multispectral Methods for Land Cover Change Analysis. In: Lunetta, R.S. and Elvidge, C.D., Eds., Remote Sensing Change Detection: Environmental Monitoring Methods and Applications, Taylor & Francis, London.
[51] Getahun, K., Van Rompaey, A., Van Turnhout, P. and Poesen, J. (2013) Factors Controlling Patterns of Deforestation in Moist Evergreen Afromontane Forests of Southwest Ethiopia. Forest Ecology and Management, 304, 171-181.
http://dx.doi.org/10.1016/j.foreco.2013.05.001
[52] Potapov, P.V., Turubanova, S.A., Hansen, M.C., Adusei, B., Broich, M., Altstatt, A., Mane, L. and Justice, C.O. (2012) Quantifying Forest Cover Loss in Democratic Republic of the Congo, 2000-2010, with Landsat ETM+ Data.
Remote Sensing of Environment, 122, 106-116. http://dx.doi.org/10.1016/j.rse.2011.08.027
[53] Margono, B.A., Potapov, P.V., Turubanova, S., Stolle, F. and Hansen, M.C. (2014) Primary Forest Cover Loss in In-donesia over 2000-2012. Nature Climate Change, 4, 730-735. http://dx.doi.org/10.1038/nclimate2277
[54] Petursson, J.G., Vedeld, P. and Sassen, M. (2013) An Institutional Analysis of Deforestation Processes in Protected Areas: The Case of the Transboundary Mt. Elgon, Uganda and Kenya. Forest Policy and Economics, 26, 22-33.
http://dx.doi.org/10.1016/j.forpol.2012.09.012
[55] Islam, K. and Sato, N. (2012) Deforestation, Land Conversion and Illegal Logging in Bangladesh: The Case of the Sal (Shorea robusta) Forests. iForest-Biogeosciences and Forestry, 5, 171-178.
[56] Armenteras, D., Rodríguez, N., Retana, J. and Morales, M. (2011) Understanding Deforestation in Montane and Low-land Forests of the Colombian Andes. Regional Environmental Change, 11, 693-705.
http://dx.doi.org/10.1007/s10113-010-0200-y
[57] Htun, N.Z., Mizoue, N. and Yoshida, S. (2013) Changes in Determinants of Deforestation and Forest Degradation in Popa Mountain Park, Central Myanmar. Environmental Management, 51, 423-434.
http://dx.doi.org/10.1007/s00267-012-9968-5
[58] Robalino, J.A. and Pfaff, A. (2012) Contagious Development: Neighbor Interactions in Deforestation. Journal of De-velopment Economics, 97, 427-436. http://dx.doi.org/10.1016/j.jdeveco.2011.06.003
[59] Vanderhaegen, K., Verbist, B., Hundera, K. and Muys, B. (2015) REALU vs. REDD+: Carbon and Biodiversity in the Afromontane Landscapes of SW Ethiopia. Forest Ecology and Management, 343, 22-33.
http://dx.doi.org/10.1016/j.foreco.2015.01.016
[60] Woldemariam, T. (2003) Vegetation of the Yayu Forest in SW Ethiopia: Impacts of Human Use and Implications for
in Situ Conservation of Wild Coffea arabica L. Populations.University of Bonn, Bonn.
[61] Berecha, G., Aerts, R., Vandepitte, K., Van Glabeke, S., Muys, B., Roldán-Ruiz, I. and Honnay, O. (2014) Effects of Forest Management on Mating Patterns, Pollen Flow and Intergenerational Transfer of Genetic Diversity in Wild Ara-bica Coffee (Coffea arabica L.) from Afromontane Rainforests. Biological Journal of the Linnean Society, 112, 76-88.
http://dx.doi.org/10.1111/bij.12274
[62] Gamfeldt, L., Snäll, T., Bagchi, R., Jonsson, M., Gustafsson, L., Kjellander, P., Ruiz-Jaen, M.C., Fröberg, M., Stendahl, J. and Philipson, C.D. (2013) Higher Levels of Multiple Ecosystem Services Are Found in Forests with More Tree Species. Nature Communications, 4, Article No. 1340. http://dx.doi.org/10.1038/ncomms2328