Journal of Chemical and Pharmaceutical Research, 2014, 6(11):117-128
Research Article
CODEN(USA) : JCPRC5
ISSN : 0975-7384
3D-QSAR studies for some pyrazolones against a pathogen
Kishor Arora
Department of Chemistry, Govt. P. G. College (Autonomous), Datia (M.P.), India
_____________________________________________________________________________________________
ABSTRACT
3D QSAR viz. 3 descriptor quantitative structure and activity relationship studies for a series of compounds i.e. pyrazolone derivatives using their semi-empirical quantum chemical descriptors and their laboratory reported activities against a pathogen viz. . Ralstonia solanacearum (ITCC – B1-0002) have been carried out and reported in the present paper. Graphs between observed and predicted activities, both in the terms of p(MIC)cal and p(MIC)obs. are also being reported on the basis of which this may be concluded that some parameters/descriptors effect towards the activity. The method has been proved to be useful tool for such type of studies.
Key words: Semiempirical, 3D-qsar, Ralstonia solanacearum, Pyrazolone compounds
_____________________________________________________________________________________________
INTRODUCTION
Medicinal chemists are trying out their best to speed up the drug discovery process for finding the lead molecule by using different techniques which includes QSAR (Quantitative Structure and Activity Relationship), 3D-QSAR, CADD (Computer Aided Drug Design), Molecular Modeling, Combinatorial Chemistry and Microwave assisted synthesis. The use of these techniques has reduced the time required for primary screening of the molecule to locate the lead molecule.
QSAR (Quantitative Structure and Activity Relationship) technique has been developed as a recent and finest technique in the field of drug designing. This technique has its foundation on the statistical analysis particular regression analysis of structural descriptors of compounds under studies with their lab. reported activities. In some of the recent references scientists have even utilized electronic properties or parameters of compounds/ drugs computed on the basis of Quantum Chemical Calculation viz. ab initio or semi-empirical studies as descriptors for QSAR studies and correlated these descriptors with activities of the compounds against a certain micro-organism, which has been proved as a step ahead in the related field.
______________________________________________________________________________
Literature survey carried out in the proposed field (1-29) revealed that on one side the workers/ scientists have tried many naturally occurring and synthetic compounds to check their activities against various microorganisms while on the other QSAR studies of various series of compounds have also been carried out successfully. Some of the workers have also tried to correlate activities with 2 descriptors and 3 descriptors of the compounds pertaining to 2D- QSAR and even 3D- QSAR studies(1-25).
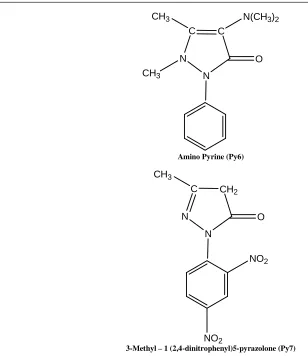
Keeping above discussion in mind, in this present paper QSAR precisely 3D-QSAR studies which have been carried out on a new series of compounds i.e. pyrazolone compounds shown in figure 1 with their activities against
Ralstonia solanacearum (ITCC – B1-0002) are reported.
EXPERIMENTAL SECTION
Preparation of pyrazolone compounds:-
Some of the Pyrazolone compounds were prepared in the laboratory while some were obtained from standard sources as E Merck, C.D.H. and B.D.H. etc. and were used as such for further work. Processes of synthesis of synthesized pyrazolones are given below:-
3- Methyl -5- pyrazolone (MeP):-
Hydrazine hydrate (50%solution, approx. 4 ml) was taken in a beaker with diethyl ether (20 ml) and ethyl acetoacetate (8 ml) was added to it drop wise in order to avoid the vigorous reaction. White crystalline solid separated out within one minute. It was then filtered and washed with diethyl ether, 3 to 4 times. On exposing to air surface oxidation of the compound may take place and compound becomes pink (yield ~95%).
3- Methyl-4-Nitroso-5- pyrazolone (MNP):-
Above procured pyrazolone (2g) was dissolved in minimum amount of (1:1) acetic acid in a conical flask. This was then kept in an ice bath for about 15 minutes, so that the temperature of the solution was brought down to 100C. Solid sodium nitrite (4g) was added in portions to this solution. Precipitate was obtained immediately but the reaction mixture was kept in the ice bath with stirring for 1 hour. The product was then filtered and washed with dilute acetic acid followed by water and was re- crystallized from (1:1) aq. Methyl alcohol and yellow product was obtained( yield ~70%).
3- Methyl- 1-(2,4-di nitrophenyl)-5-pyrazolone:-
A mixture of phenyl hydrazine/ 2,4-dinitrophenyl hydrazine (0.01 mol) and thylacetoacetate (0.01 mol) were taken in absolute alcohol (30 mL) and refluxed for 12 hrs. After completion of the reaction, excess of solvent was distilled off and the resultant residue was poured on crushed ice to obtain the yellow/ orange long needle shaped crystals. Solids precipitated were filtered and re-crystallized using ethanol (yield~70%).
Compounds i.e. pyrazolones (Py1-Py7) are shown in the figure 1. Analytical studies were also carried out for the synthesized pyrazolone compounds under study. These are given in the tables 1 along with their melting points.
C
N
N C CH
H
O CH3
______________________________________________________________________________
C
N
N C CH2
O CH3
3-Methyl-l-phenyl-5-Pyrazolone (PY2)
C
N
N C CH
H
O
CH3
3-Methyl-4-nitroso-5-pyradolone (Py3)
C
N
N C C
O
CH3 H
CH3
Antiprine (Py4)
N
N
O
CH3 NH2
CH3
______________________________________________________________________________
C
N
N C
O
CH3 N(CH3)2
CH3
Amino Pyrine (Py6)
C
N
N
CH2
O
CH3
NO2
NO2
3-Methyl – 1 (2,4-dinitrophenyl)5-pyrazolone (Py7)
[image:4.595.87.395.94.450.2]Figure-1: Pyrazolone Compounds under study
Table 1:- Analytical studies for the Pyrazolone compounds under study
Compound M. Pt. (0C)
C Found (Calcd.)
H Found (Calcd.)
N Found (Calcd.)
Py-1 224-226 49.85
(49%)
6.04 (5.1%)
28.20 (28.8%)
PY-2 124-126 (69%) 71.59 (5.7%) 5.65 (16.0%) 16.32
PY-3 229-231 39.88
(42.0%) 2.899 (4.0%)
32.97 (33.0%)
PY-4 110-115 71.50
(70.2%) 6.43 (6.3%)
14.73 (14.8%)
PY-5 105-110 (65.0%) 66.97 (6.4%) 6.32 (20.69%) 19.64
PY-6 107-108 67.59
(67.5%) 7.24 (7.3%)
17.52 (18.1%)
PY-7 81-88 (48.0%) 57.49 (4.9%) 6.35 (20.0%) 20.04
______________________________________________________________________________
I.R. spectral studies:-
Assignments of peaks are given in the table -2 for pyrazolone compounds. I.R. spectral analysis shows that (C=O) Stretching is the predominant peak in the case of pyrazolone compounds under study. It appears ca 1660-1610 cm-1 . Apart from these peaks some other notable peaks are ring stretching of 5 membered ring, Ring stretching, CH out of plane deformation of pyrazolone ring, C=O in plane bending and out of plane bending etc. These are reported in the table 2.
NMR spectral studies:-
NMR spectral studies are of less interest for the compounds under study. However, these spectra were also recorded for some representative compounds on NMR spectrometer Bruker DRX-300 with due acknowledgement to C.D.R.I. Lucknow. Some notable peaks in these spectra are listed below:-
Py1: 1.150-1.105 (t);2.430-2.011 (q); 3.997-3.974 (d);5.140-(s);6.005 (s); 10.277(s).
Py2:- 2.110 (s); 2.500 (s); 3.329 (s); 3.327-3.696 (d); 5.349 (s); 7.817-7.174 (multiplet).
Py5:-2.083 (S); 2.723-2.489( d); 3.333(s); 3.842 (s); 7.4445-7.219 (q).
MASS spectral studies:-
Mass spectral studies of some representative Schiff base compounds have been carried out. Notable peaks in different compounds are:- base peaks at , Py-1:- 79, Py-2 :-175, Py-3:- 127 and Py-5:-203 with parent ion peaks at Py-1:- 98, Py-2 :-174, Py-3:- 127 and Py-5:-203.. These parent peaks confirm the mol. weights of the compounds under study
Antimicrobial activities of the compounds under study:-
Procurement of pathogen:-ITCC certified Pathogen viz. Ralstonia solanacearum (ITCC – B1-0002) was procured
from plant pathology division, I.A.R.I., New Delhi with due acknowledgement. Their sub- cultures have been made and the anti-microbial studies of the compounds under study were carried out against these pathogens at Birla Institute of Professional Studies with due acknowledgements. MIC (minimum inhibitory concentration) have been recorded which is then subjected to further studies to get QSAR equations. Experimental procedures that have been adopted for anti microbial studies are mentioned below:
Experimental procedure for Anti bacterial studies:-
Pure cultures that were obtained from IARI were revived. Fresh inoculation of Ralstonia solanacearum was done by taking a loopful from IARI culture tube and streaking was done on sterile nutrient agar petri plate and slant and incubated at 280c for 48 hrs to revive the culture. After 48 hrs on revival of test organism, a loopful this has been taken and dispensed in 50 mL of medium in a conical flask and kept for further 48 hrs for the preparation of inoculum. Culture media were autoclaved at 1210c for 15 lbs pressure for 15 minutes. Plates were made by dispensing the media approx 15-20 mL in each plate. Plates were kept inverted in the incubator at 280c overnight for sterility checking. Whatmann 1 filter paper discs of 6 mm diameter were punched out from barge sheet and were autoclaved for 15 minutes. About 100µL of actively growing pathogen inoculated nutrient broth was used to inoculate sterile nutrient agar plates through spread plate method. The whatmann paper discs were dispensed on glass plates and each was loaded with about 5 µL. Volume of pre designated dilutions were used for analysis. The discs were left air dried in the laminar air flow and were then carefully transferred to inoculated positions. The plates were then inoculated at 280c for 48 minimum hrs.
Table-3:-Antibacterial analysis of pyrazolone compounds under study against Ralstonia solanacearum (ITCC NO –B1- 0002)
Compounds under study Concentrations Of compounds/10 ml 10 mg 20 mg 30 mg 40 mg
PY1 34mm 38 mm --- ---
PY2 --- --- --- 03 mm
PY3 --- --- --- 02 mm
PY4 --- --- 13 mm 14 mm
PY5 --- 29 mm 30 mm 31 mm
PY6 --- 28 mm 16 mm 22 mm
______________________________________________________________________________
Computational Details for the computational work:-
The AM1 Hamiltonia on Hyperchem 8.0 professional version were used to calculate the QSAR related descriptors such as Hydration energy (Hyd E), log P (log P), Refractivity (REF), Polarizability (POL). mass (mass), Surface area approx (SAA), Surface area Grid (SAG), volume (Vol), Heat of formation (HF) , Zero point energy (ZPE), HOMO energy (HOMO), LUMO energy ( LUMO) and dipole moment ( DM).
All these computations were carried out on Pentium core -2 duo machine having configuration
Intel (R ) core (™) 2 Duo CPU T 5450@ 1.66 GHz.
982 MHz, 896 MB RAM 150 GB HDD
with windows – Microsoft windows XP software as an operating system.
These descriptors and the activities of the compounds against specified microbes, mentioned in the tables, were taken into consideration in terms of p (MIC) and were subjected to statistical analysis/ regression analysis to get QSAR equations. All these statistical calculations were carried out on the same machine mentioned above using EXCEL software.
RESULTS AND DISCUSSION
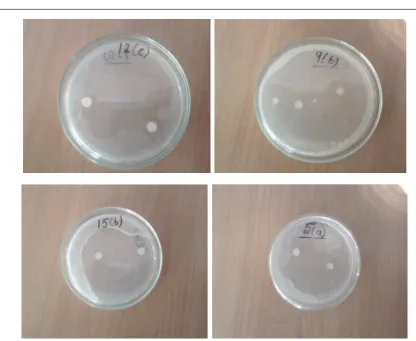
The in-vitro anti bacterial studies of the pyrazolone compounds were carried out as per experimental procedure mentioned in the experimental section at Birla Institute of Professional Studies, Gwalior with due acknowledgement. The activities of the compounds were recorded in terms of Minimum Inhibitory Concentration (MIC). Some of the compounds have shown notable activities against the specified pathogen under study while other do not show any activity. The activities are recorded and reported here in the table 3. Photographs of some of the plates were also taken showing growth of the pathogens, (figure 2).
The lab. reported activities of the pyrazolone compounds under study in terms of p(MIC) have been subjected to QSAR studies with Semi-empirical quantum chemical based certain parameters of the compounds. These parameters/ descriptors are hydration energy (HE), logP (logP), Refractivity(RF), Polarizaility (POL), Mass(Mass), Surface area approx(SAA), Surface area Grid( SAG), Volume (VOL), Heat of formation (HF), Zero point Energy (ZPE), HOMO energy(HOMO), LUMO energy (LUMO) and dipole moment( DM).
These parameters are computed on HYPERCHEM 8.0 version software after geometry optimization of the compounds under study as mentioned in the experimental section above. The computed parameters/ descriptors are reported in the tables 4-7. The correlation matrices are also computed using Excel software and are reported in tables 8-11.
The methods adopted here in this project are AM1, PM3, MNDO and ZINDO respectively. All methods are proved to be good to give optimized geometry and minimized energy for the compounds under study. This fact can also be proved as IR studies which are observed experimentally for the compounds under study match well with the computed IR spectral frequencies using Hyperchem 8.0 professional software especially on the basis of AM1 and PM3 method. The fact of authenticity of AM1 and PM3 may prove to be appropriate in this study, so far as software is concerned (26-33).
Table-4 : Semi- Empirical AM1 based Computed properties of the Compounds (Py1-Py7) under study and their antibacterial results p(MIC) on Ralstonia solanacearum (ITCC NO –B1- 0002 )
Compd MIC P(MIC)Obs. SAA SAG HE Log P RF
Py-1 50 -1.699 231.64 256.11 -5.19 0.2 24.82
Py-2 50 -1.699 310.59 365.51 -2.13 0.94 54.3
Py-3 50 -1.699 258.75 274.11 -11.31 0.17 29.75
Py-4 50 -1.699 339.82 385.49 -1.84 -0.4 61.23
Py-5 25 -1.3979 336.88 399.17 -6.51 -1.99 64.85
Py-6 15 -1.1761 448.38 474.55 -1.58 -1.22 74.92
______________________________________________________________________________
POL Mass VOL HF ZPE HOMO LUMO DM
9.71 98.1 351.97 4.99398 64.831 -9.5347 0.19945 2.617
19.37 174.2 565.04 44.6349 117.65 -8.6403 0.09622 2.781
10.92 127.1 391.94 19.26134 641.09 -0.1633 0.8305 2.298
21.4 188.23 608.04 63.6532 135.458 -0.1844 0.48155 4.438
22.78 203.24 640.43 60.5788 161.421 -0.0912 0.4694 3.423
26.45 231.3 770.61 73.3708 179.1184 -0.04307 0.44813 10.224
24.86 278.22 730.57 146.1111 139.8278 -0.1687 0.1007 10.819
The software Hyperchem 8.0 version was quite fast and provides reasonably good results regarding all parameters viz. physical parameters, spectroscopic parameters and SAR related parameters.
Table-5 : Semi- Empirical PM3 based Computed properties of the Compounds (Py1-Py7) under study and their antibacterial results p(MIC) on Ralstonia solanacearum (ITCC NO –B1- 0002 )
Compd MIC P(MIC)Obs. SAA SAG HE Log P RF
Py-1 50 -1.699 231.61 253.25 -5.27 0.2 24.82
Py-2 50 -1.699 311.61 367.05 -2.12 0.94 54.3
Py-3 50 -1.699 260.44 275.75 -11.48 0.17 29.75
Py-4 50 -1.699 341.81 393.51 -1.85 -0.4 61.23
Py-5 25 -1.3979 338.91 403.98 -6.64 -1.99 64.85
Py-6 15 -1.1761 450.08 479.24 -1.53 -1.22 74.92
Py-7 20 -1.301 392.41 453.99 -10.28 -2.03 73.66
POL Mass VOL HF ZPE HOMO LUMO DM
9.71 98.1 349.99 10.0348 61.83218 -0.0272 1.0386 2.46
19.37 174.2 565.41 20.69754 112.6618 -0.1096 0.1388 2.607
10.92 127.1 392.83 11.62258 61.7474 -0.3937 0.3769 2.112
21.43 188.23 613.4 22.7265 130.4475 -0.2538 0.2318 4.053
22..78 203.24 644.42 21.3358 141.3387 -0.2158 0.2368 3.336
26.45 231.3 770.89 51.0475 173.459 -0.0148 1.1074 10857
24.36 278.22 737.64 1.2.26173 133.1422 -0.2813 0.04362 10.665
Table-6 : Semi- Empirical MNDO based Computed properties of the Compounds (Py1-Py7) under study and their antibacterial results p(MIC) on Ralstonia solanacearum (ITCC NO –B1- 0002 )
Compd MIC P(MIC)Obs. SAA SAG HE Log P RF
Py-1 50 -1.699 231.86 255.82 -5.15 0.2 24.82
Py-2 50 -1.699 312.51 367.73 -2.01 0.94 54.3
Py-3 50 -1.699 260.81 278.31 -11.36 0.17 29.75
Py-4 50 -1.699 340.57 398.37 -1.84 -0.4 61.23
Py-5 25 -1.3979 339.38 414.33 -6.4 -1.99 64.85
Py-6 15 -1.1761 454.12 483.23 -1.58 -1.22 74.92
Py-7 20 -1.301 386.92 458.83 -9.7 -2.03 73.66
POL Mass VOL HF ZPE HOMO LUMO DM
9.71 98.1 352.87 18.9028 67.243 -9.7772 0.0215 2.153
19.37 174.2 569.02 16.0375 121.0237 -0.0345 0.14629 2.261
10.92 127.1 395.23 7.4868 66.9777 -0.3169 0.6199 1.963
21.43 188.23 621.48 28.7572 139.841 -0.2134 0.1405 3.706
22.78 203.24 658.47 28.6354 151.104 -0.2951 0.0574 2.868
26.45 231.3 784.55 70.6098 184.9554 -0.4308 0.36126 10.653
24.86 278.22 753.34 118.9328 143.7598 -0.07829 0.01692 9.536
Table-7 : Semi- Empirical ZINDO based Computed properties of the Compounds (Py1-Py7) under study and their antibacterial results p(MIC) on Ralstonia solanacearum (ITCC NO –B1- 0002 )
Compd MIC P(MIC)Obs. SAA SAG HE Log P RF
Py-1 50 -1.699 231.39 252.79 -5.33 0.2 24.82
Py-2 50 -1.699 306.03 360.91 -2.13 0.94 54.3
Py-3 50 -1.699 229.25 264.75 -7.42 0.17 29.75
Py-4 50 -1.699 333.51 377.65 -1.85 -0.4 61.23
Py-5 25 -1.3979 332.91 392.87 -6.54 -1.99 64.85
Py-6 15 -1.1761 368.17 438.18 -4.37 -1.22 74.92
______________________________________________________________________________
POL Mass VOL HF ZPE HOMO LUMO DM
9.71 98.1 349.67 -2425.099 89.403 -6.7886 6.9301 3.918
19.37 174.2 557.74 -4915.264 160.01 -6.063 6.84 4.398
10.92 127.1 372.98 -2738.509 89.95 -6.8543 6.1565 6.832
21.43 188.23 592.26 -5450.551 184.983 -5.8917 6.6588 7.057
22.78 717.28 626.64 -5727.0466 199.149 -5.5803 6.6033 5.953
26.45 231.3 717.28 -6723.9806 248.19 -5.3664 7.3694 7.905
24.86 278.22 689.05 -6433.8554 193.0471 -3.2596 4.1054 19.919
This final equation was used to get predicted activities for all the series of compounds and against the microorganism under study. The final 3D-QSAR equations are reported as under:-
AM1/Pyrazolones compounds (Py1-Py7)/Antibacterial Ralstonia solanacearum (ITCC NO –B1- 0002 ) /3D-equation
P(MIC) = -0.008249159(SAG)+0.004708556(VOL)+0.039448387(DM)-1.390975381 N = 7, SD = 0.14823059, r = 0.886988475, F test = 3.68929998
PM3/Pyrazolones compounds (Py1-Py7)/Antibacterial Ralstonia solanacearum (ITCC NO –B1- 0002 ) /3D-equation
P(MIC) = -0.05576(SAG)+0.025894(VOL)+0.010351(SAA)+0.887878 N = 7, SD = 0.0839842, r = 0.9651652, F test = 13.60791163
MNDO/Pyrazolones compounds (Py1-Py7)/Antibacterial Ralstonia solanacearum (ITCC NO –B1- 0002 /3D-equation
P(MIC) = -0.083211294(LogP)-0.090069921(POL)+0.015433871(ZPE)-1.761162134 N = 7, SD = 0.139293742, R = 0.900936838, F test = 4.31013
ZINDO/Pyrazolones compounds (Py1-Py7)/Antibacterial Ralstonia solanacearum (ITCC NO –B1- 0002 /3D-equation
P(MIC) = -0.076530237(POL)+0.000604852(MASS)+0.010056714(ZPE)-1.872914629 N = 7, SD = 0.097346524, r = 0.952904817, F test = 9.872825978
[image:8.595.181.416.536.702.2]Graphs were also drawn between observed activities and predicted activities, both in the terms of p(MIC) form 3 D-QSAR equations for this series of compounds. These trend line graphs are shown in figure 3-6.
Figure -3 Trend line Graph between p(MIC) observed and AM1 computed p(MIC) calculated for the pyrazolone compounds (Py1-Py7)under study for their antibacterial activities on Ralstonia solanacearum (ITCC NO –B1- 0002
Graph between p(MIC) obsercved and p(MIC) caculated
-1.37 -1.36 -1.35 -1.34 -1.33 -1.32 -1.31 -1.3 -1.29 -1.28 -1.27 -1.26
-1.8 -1.6 -1.4 -1.2 -1 -0.8
p(MIC) Observed
p
(M
IC
)
c
a
lc
u
la
te
______________________________________________________________________________
p(MIC) Observed p(MIC) calculated
-1.699 -1.358
-1.699 -1.347
-1.699 -1.359
-1.699 -1.332
-1.398 -1.339
-1.176 -1.276
[image:9.595.167.432.224.504.2]-1.301 -1.273
Figure 4 Trend line Graph between p(MIC) observed and PM3 computed p(MIC) calculated for the pyrazolone compounds (Py1-Py7)under study for their antibacterial activities on Ralstonia solanacearum (ITCC NO –B1- 0002)
p(MIC) Observed p(MIC) calculated
-1.699 -1.774
-1.699 -1.714
-1.699 -1.621
-1.699 -1.634
-1.398 -1.445
-1.176 -1.216
[image:9.595.160.437.538.727.2]-1.301 -1.266
Figure -5 Trend line Graph between p(MIC) observed and MNDO computed p(MIC) calculated for the pyrazolone compounds (Py1-Py7)under study for their antibacterial activities on Ralstonia solanacearum (ITCC NO –B1- 0002)
Graph between p(MIC) observed and p(MIC) caculated
-2 -1.8 -1.6 -1.4 -1.2 -1 -0.8
-1.8 -1.6 -1.4 -1.2 -1 -0.8
p(MIC) observed
p
(M
IC
)
c
a
lc
u
la
te
d
Graph between p(MIC) observed and p(MIC) calculated
-2 -1.9 -1.8 -1.7 -1.6 -1.5 -1.4 -1.3 -1.2 -1.1 -1 -1.8 -1.7 -1.6 -1.5 -1.4 -1.3 -1.2 -1.1 -1
p(Mic) observed
p
(M
IC
)
c
a
lc
u
la
te
______________________________________________________________________________
p(MIC) Observed p(MIC) calculated
-1.699 -1.581
-1.699 -1.56
-1.699 -1.697
-1.699 -1.566
-1.398 -1.646
-1.176 -1.39
[image:10.595.114.484.220.673.2]-1.301 -1.95
Figure -6 Trend line Graph between p(MIC) observed and ZINDO computed p(MIC) calculated for the pyrazolone compounds (Py1-Py7)under study for their antibacterial activities on Ralstonia solanacearum (ITCC NO –B1- 0002 )
p(MIC) Observed p(MIC) calculated
-1.699 -1.658
-1.699 -1.641
-1.699 -1.727
-1.699 -1.539
-1.398 -1.18
-1.176 -1.261
-1.301 -1.666
Graph between p(MIC) observed and p(MIC) caculated
-1.8 -1.7 -1.6 -1.5 -1.4 -1.3 -1.2 -1.1 -1
-1.8 -1.7 -1.6 -1.5 -1.4 -1.3 -1.2 -1.1 -1
p(MIC) observed
p
(M
IC
)
c
a
lc
u
la
te
______________________________________________________________________________
Figure 2 : Some notable photographs for anti bacterial studies of compounds under study
CONCLUSION
This method has once again proved to be useful for this type of studies. The parameters/ descriptors which contribute positively to p (MIC) in final 3D QSAR equations are listed below:-
AM1/ Pyrazolones (Py1-Py7)/ Ralstonia solanacearum (ITCC NO –B1- 0002) : - SAG, VOL and DM PM3/ Pyrazolones (Py1-Py7)/ Ralstonia solanacearum (ITCC NO –B1- 0002) : - SAG, VOL and SAA MNDO/ Pyrazolones (Py1-Py7)/ Ralstonia solanacearum (ITCC NO –B1- 0002) : - Log P, POL and ZPE ZINDO/ Pyrazolones (Py1-Py7)/ Ralstonia solanacearum (ITCC NO –B1- 0002) : - POL, MASS and ZPE
In conclusion this may be said that these parameters / descriptors have more impact on (MIC) over all other descriptors computed and reported.
Acknowledgements
Author sincerely acknowledges M.P. Council of Science and Technology, Bhopal for financial assistance in the form of Research Project sanctioned to him. {Endlt. No. 6051/CST/R&D/2011 Dated 31-03-2011}
REFERENCES
[1]Hedi Schraf, Marina Steele, Bruce MaNab, Josef Odummaru and Mansel W. Griffiths, Application and
Environmental microbiology,62(11), 4229-4232, (1996).
______________________________________________________________________________
[4] R.W. Read, Canadian J. of Microbiology, 1(1), 3035 (1955).
[5]Fabienne Mourgues, Marie-Noelle Brisset and Elisabeth C.H., Plant Science, 139(1), 83-91,(1998). [6]Igna Odenholt, Ingegerd, Gustafsson and Elisabeth Lowdin, Chemotherapy, 49,287-293, (2003).
[7]Xu GF, Song BA, Bhadury PS, Yang S. Zhang PQ, Jin LH, Xue w, Hu DY, Lu P, Bio org med . Chem. 15(11), 3768-74 (2007).
[8]Crowley PJ, Lamberth C, Muller U, Wendeborn S, Nobel K, Williams J, Sageot OA, Carter N, Mathie T, Kempf HJ, Godwin J, Schneiter P, Dobler MR, Pest Manag. Sci, 66(2), 178-185 (2010).
[9]Kishor Arora and K.P. Sharma, Synth. And React. In Inorg. And Met.-Org. Chem.. 32, 913 (2002).
[10] Zoctonia solani and Sclerotium rolfsii”, Lakshman BA, Gupta RL, Indian J. of Chemistry, 44(B), 152-157, (2005).
[11]Leeja L, Thoopil JE, Journal of Environmental Biology, 28(1), 145-146 (2007).
[12]CaO X, Li F, Hu M, Lu W, Yu GA, Liu SH, Agric. Food Chem., 56(23),11367-75 (2008).
[13]Zhao PL, Wang F, Zhang MZ, Liu ZM, Huang W, Yang GF, , J Agric. Food Chem., 56(22), 10767-73 (2008). [14]Hansong Chen,ZhengmingLi and Yufeng Han, J. Agirc. Food Chem., 48(11), 5312-5315, (2000).
[15]Ghorab MM, Zeinab H Ismail, Soad M Abdel Gawad and Anhar Abdel Aziem, Heteroatom chem.., 15(1), 57-62, (2004).
[16]Zwning Liu, Guangfu Yang and Xianghua Qin, J. Chem. Technol. Biotechnol, 76, 1154-1158, (2001).
[17]Yu Z, Shi G, Sun Q, Jin H, Teng Y, Tao K, Zhou G, Liu W, Wen F, Hou T, Eur. J. of Med. Chem., 44(11), 4726-33, (2009).
[18]Chandra S, Jain D, Sharma AK, Sharma P, Molecules, 14(1),174-90 ,(2009). [19]Bojja Rajeshwar Rao, Indian J. Chem., 41(B), 1697-1701, (2002).
[20]Pradassani RT, Paradosani P, Agarwal MM, Mathur G, Indian J Chem., 40(B), 518-521,(2001).
[21]Hanumanthrao P, Sambasivrao SV, Soni LK, Gupta AK, Kaskhedikar SG, Indian J. Chem., 44(B), 1481-1486,(2005).
[22]Vinod Kr. Sewariya, Richa Srivastava, GBKS Prasad and Kishor Arora, Biosciences and Biotechnology Asia, 8(1),231-239 (2011).
[23] Vinod Kr. Sewariya, Richa Srivastava, GBKS Prasad and Kishor Arora, Research journal of Pharmaceutical
biological and Chemical sciences, 3(3), 360, (2012).
[24] Vinod Kr. Sewariya, Richa Srivastava, GBKS Prasad and Kishor Arora, International Journal of Pharma and
Biosciences, 3(1),B, 441-453, (2012).
[25] Vinod Kr. Sewariya, Richa Srivastava, GBKS Prasad and Kishor Arora, International Journal of Pharma and
Biosciences,3(3)B, 910-920, (2012).
[26] Kishor Arora and Veena Nathani, Asian J. Chem., 24(12),5803-5805, (2012).
[27] Kishor Arora and Veena Nathani, Research journal of Pharmaceutical biological and Chemical sciences, 3(4), 1423, (2012).
[28] Kishor Arora and Veena Nathani, International Journal of Pharma and Biosciences, 4(1), 657-671, (2013). [29]Kishor Arora, International journal of Pharma and Bopsciences, , 4(2), 244, (2013).
[30] Puntaambedkar DS, Girdhar R, Yadav MR, Acta Pharm., 56, 157-174, (2006). [31]Kishor Arora, Int J Pharm Bio Sc.,5 (3) : 138 – 148, (2014).