Evaluation of Torque Ripple of an Optimal Designed
3-Phase Induction Motor Using Uncertainty
Ho-Hyun Lee
1, Kyung-Il Woo
1,*, Han-seok Park
1, Dae-Kyong Kim
21Department of Electrical Engineering, Pukyong National University, Republic of Korea 2Department of Electrical Control Engineering, Sunchon National University, Republic of Korea
Copyright©2019 by authors, all rights reserved. Authors agree that this article remains permanently open access under the terms of the Creative Commons Attribution License 4.0 International License
Abstract
Background/Objectives: This paper aims to reliably evaluate the torque ripple of an optimal designed 3-phase induction motor using the measurement uncertainty theory. Methods/Statistical analysis: The measurement uncertainty theory is statistically applied to the actual test. To apply the measurement uncertainty theory to the simulation result such as torque ripple, the type-A standard uncertainty can be calculated through the periodical calculation of torque ripple and the type-B standard uncertainty expressing non-statistical factors such as measurement environment, instrument or method is regarded as 0 in the uncertainty evaluation process. Findings: The general expression of torque ripple of an optimal designed 3-phase induction motor is not dependable because of the fluctuating torque at steady state. Therefore, in this paper, the uncertainty of the torque ripple is evaluated by using the type-A and the type-B standard uncertainty which is regarded as 0. As a result, the torque ripples before and after the optimal design are reliably evaluated in a specific confidence level. Also, it is known that the uncertainty can be easily applied to the torque ripple as well as other motor parameters such as power loss, output power density and so on. Improvements/Applications: Since this paper deals with evaluation method of torque ripple of a 3-phase induction motor with respectively low torque ripple, it could be applied to motors with large torque ripple.Keywords
Induction Motor, Optimal Design, Periodical Calculation, Torque Ripple, Uncertainty1. Introduction
Recently, many papers and studies have dealt with the optimal design to reduce the torque ripple of motor [1, 2]. The reduced torque ripple is the evaluation factor of the optimal design, and usually may not be same in the repeated measurement. Thus, it is not known which torque
ripple is most reliable as the result of the optimal design. So, additional index is needed to ensure the reliability of expressing the torque ripple. For this purpose, the measurement uncertainty theory is applied in this paper. The measurement uncertainty theory is means of ensuring the reliability of measurement results by taking into account all uncertain factors affecting the output quantity [3, 4]. The measurement uncertainty theory has been used in the chemical and test fields, but it has recently been expanded to the electro-magnetic and machinery field. As an example, there have been studies using the measurement uncertainty theory to reliably evaluate the motor efficiency [5-7]. The optimal design of the motors is usually performed using the FEM, and the torque ripple in the FEM also may not be same as in the actual test. Therefore, this paper presents a method to reliably evaluate the torque ripple of an optimal designed motor by applying the measurement uncertainty theory to the FEM. First, the 3-phase induction motor is selected to perform the optimal design for minimum torque ripple. And then, a method for applying the measurement uncertainty theory to the FEM is presented. Finally, the torque ripple of the optimal designed 3-phase induction motor is evaluated using the presented method.
2. Optimal Design of 3-Phase Induction
Motor
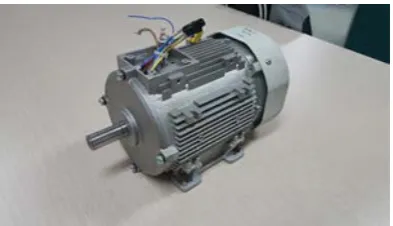
Figure 1. The Selected 3-Phase Induction Motor
Figure 2. The 2-D Section of the 3-Phase Induction Motor
Table 1. The Set-Up for the Optimal Design
Set-up Details
Objective function Minimum torque ripple
Design variable(s) Stator slot shape (presented in Figure 3.)
Constraint condition(s)
Be set according to the motor design and manufacturing process
Figure 3. The Parameters of the Stator Slot Shape
The optimal design was performed using the RSM based on the above-mentioned set-up, and the result is shown in
table 2. And, figure 4 compares the stator slot shape before and after the optimal design. As a result of the optimal design, the overall height has been shortened, and the width increased.
Table 2. Physical Parameters of the Stator Slot Shape before and after Optimal Design
Details Before optimal design After optimal design
Hs0 [mm] 0.8 0.8
Hs1 [mm] 0.6 0.6
Hs2 [mm] 12.5 11.5
Bs0 [mm] 2.4 2.2
Bs1 [mm] 3.6 3.7
Bs2 [mm] 5.2 5.6
Figure 4. Comparison of Stator Slot Shape before and after the Optimal Design
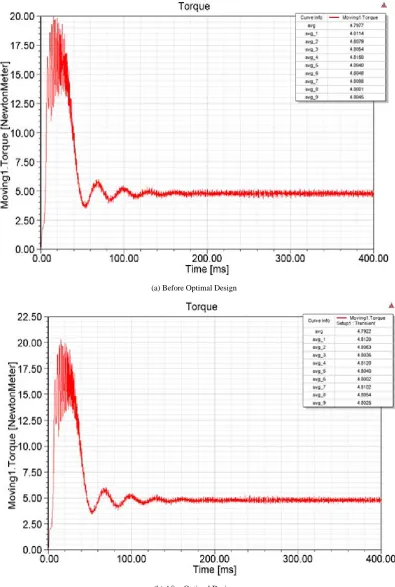
Figure 5 compares the torque waveforms before and after the optimal design. From these waveforms, the torque ripple can be calculated. In the FEM, the motor torque can be obtained by calculating the mean-value for one period in the torque waveform [11-12]. In this study, the selected period for motor torque calculation is based on the period of the stator current after reaching the steady-state. So, the period for calculating the torque is eq. (1).
𝑇=60 [1Hz]= 16.6667 [sec] (1)
Here T is a period of the stator current after reaching the steady-state.
[image:2.595.308.536.155.409.2] [image:2.595.91.256.214.378.2] [image:2.595.59.289.404.642.2]
(a) Before Optimal Design
[image:3.595.103.499.80.668.2]
(b) After Optimal Design
3. Measurement Uncertainty Theory
The measurement uncertainty is a non-negative parameter characterizing the dispersion of the quantity values being attributed to a measurand, based on the information used [3,4]. The uncertainty is reported as eq. (2).
output value ± expanded uncertainty (confidence level 95[%],𝑘= 2) (2) In this case, the output values are the torque ripples before and after the optimal design and are evaluated by 3.4827 and 3.2201 respectively. And, these values are obtained by calculating the average of the torque ripples as shown in Table 3. The measurement uncertainty theory has been used in the chemical and test fields, but it has recently been expanded to the electro-magnetic and machinery field.
Table 3. Calculation of the Torque and Torque Ripple on 10 Times
Time period for calculating the torque
Before the optimal design After the optimal design
Torque [N·m] Torque ripple [%] Torque [N·m] Torque ripple [%]
200 ~ 216.6667 [msec] 4.7970 3.3498 4.7922 3.0845
220 ~ 236.6667 [msec] 4.8114 3.2587 4.8120 2.9710
240 ~ 256.6667 [msec] 4.8079 3.9875 4.8063 3.4929
260 ~ 276.6667 [msec] 4.8054 3.8744 4.8036 3.6812
280 ~ 296.6667 [msec] 4.8150 3.5754 4.8120 3.3489
300 ~ 316.6667 [msec] 4.8040 3.3803 4.8040 3.2044
320 ~ 336.6667 [msec] 4.8048 3.5318 4.8002 3.3730
340 ~ 356.6667 [msec] 4.8098 3.2639 4.8102 2.9287
360 ~ 376.6667 [msec] 4.8081 3.1736 4.8054 2.9172
380 ~ 396.6667 [msec] 4.8045 3.4320 4.8025 3.1993
Average value 4.8068 3.4827 4.8048 3.2201
Using the uncertainty theory, it is possible to reliably evaluate the results from repeated measurement or a priori information without additional algorithms or equipment. The uncertainty can be confused with the measurement error. The measurement error is the value obtained by subtracting the true value from the measured value, but it is impossible to obtain the true value because the measurand includes some error. Thus, the uncertainty is distinguished from the measurement error in that it considers all uncertain factors affecting the output quantity [13].
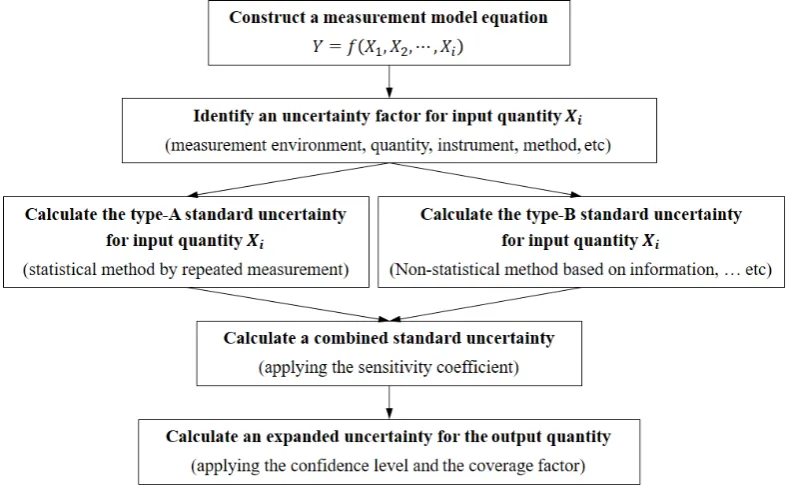
[image:4.595.70.531.216.407.2] [image:4.595.101.497.488.731.2]Figure 6 shows how to evaluate the measurement uncertainty. First, construct a measurement model equation of the output quantity for which the uncertainty is to be evaluated. In the case of the motor, the model equation may be efficiency, loss, current, torque and so on. Then, identify the uncertain factors that affect the model equation. The uncertain factors include dispersion of input quantities, measurement environment, measurement equipment, measurement method and so on. The dispersion resulting from repeated measurement is expressed statistically as a type-A standard uncertainty. On the other hand, other experimental or priori factors are expressed non-statistically as a type-B standard uncertainty [14]. Then, type-A and type-B standard uncertainties are synthesized by applying the sensitivity coefficient and this is defined as the combined standard uncertainty. Finally, the expanded uncertainty is calculated by applying the confidence level and the coverage factor.
4. Evaluation of Torque Ripple Using
Uncertainty
Obviously, since the uncertainty is experimental, a specific method is needed to apply the measurement uncertainty theory in the FEM. The model equations in the actual tests or the FEM are the same. Thus, in the FEM, the type-A standard uncertainty is estimated from 𝑛 times calculated value as shown in table 3. However, in the FEM, type-B standard uncertainty can be regarded as 0 because accuracy of program is indubitable and there are no uncertain factors affecting the motor analysis except for dispersion of torque ripple, which is expressed by the type-A standard uncertainty.
Table 4 shows the torque ripple values and uncertainties before and after the optimal design. The torque ripple uncertainties are calculated based on the table 3. According to the table 4, the torque ripples before and after the optimal design are evaluated by eq. (3) and eq. (4), respectively. This means that 95 times of the torque ripple before and after the optimal design appear between about 3.28 ~ 3.68 [%] and 3.04 ~ 3.40 [%] out of the 100 times respectively.
torque ripple =
3.4827 ± 0.1980 [%] (confidence level 95[%],𝑘= 2) (3) torque ripple =
3.2201 ± 0.1822 [%] (confidence level 95[%],𝑘= 2) (4)
5. Conclusions
In this study, the torque ripple of the optimal designed 3-phase induction motor was evaluated reliably using the uncertainty. To apply the measurement uncertainty theory
in the FEM, the type-A standard uncertainty is calculated by 𝑛 times output value as in the actual test, but the type-B standard uncertainty is regarded as 0. As a result, it is known that torque ripple can be evaluated reliably using the uncertainty and the expanded uncertainty decreased after the optimal design. Since this study dealt with 3-phase induction motor with respectively low torque ripple, the proposed method could be applied to the IPMSM or the BLDCM with large torque ripple. Also, it is considered that the uncertainty can be easily applied to the torque ripple as well as other motor parameters such as power loss, output power density and so on.
Table 4. Torque Ripple Values and Uncertainties before and after the Optimal Design
Details Before optimal
design
After optimal design Torque ripple (output
quantity) [%] 3.4827 3.2201
Type-A standard
uncertainty [%] 0.0876 0.0806
Type-B standard
uncertainty [%] 0
Combined standard
uncertainty [%] 0.0876 0.0806
Expanded uncertainty [%] 0.1980 0.1822
Acknowledgements
This work was supported by a Research Grant of Pukyong National University (2019 year)
REFERENCES
[1] Jikai Si, Suzhen Zhao, Haichao Feng, Ruiwu Cao, Yihua Hu. Multi-objective optimization of surface-mounted and interior permanent magnet synchronous motor based on Taguchi method and response surface method. Chinese Journal of Electrical Engineering. 2018;4(1):67-73.
[2] Choi JH, Kim S, Shin JM, Lee J, Kim ST. The multi-object optimization of switched reluctance motor. Institute of Electrical and Electronics Engineers. 2003 Nov;1:195-98.
[3] ISO. Guide to the Expression of Uncertainty in Measurement(GUM). 1995.
[4] ISO/IEC Guide 98-2. Guide to the Expression of Uncertainty in Measurement. 2008.
[5] Jun HD, Park HS, Kim DK, Woo KI. Study on the evaluation of uncertainty for the efficiency of 0.75[kW] class three phase induction motor. The Transactions of the Korean Institute of Electrical Engineers. 2015;64(4):653-59.
[6] Lee HH, Park HS, Jun HD, Woo KI. Evaluation of efficiency uncertainty for three-phase induction motor using finite element analysis. The Transactions of the Korean Institute of Electrical Engineers. 2017;66(4):163-68.
(2018). Survey of Image Processing Based Applications in AMR. Review of Computer Engineering Research, 5(1), 12-19.
[8] Kumar, B. S., & Cristin, R. A Survey on Efficient Power Management Using Smart Socket and IoT. Review of Computer Engineering Research. 2018; 5(2): 25-30.
[9] Kumar, P. S. Role of Library and Information Science Professionals in the Knowledge Society. Journal of Information. 2016; 2(2):10-17.
[10]Luong, N. D., Long, H. V., Tuan, N. K., & Thai, N. D. Properties of Concrete Containing Rubber Aggregate Derived From Discarded Tires. Asian Review of Environmental and Earth Sciences. 2017; 4(1): 12-19.
[11]Lee HH, Park HS, Jun HD, Kim DK, Woo KI. Evaluation of the efficiency uncertainty for an inverter-fed three phase induction motor. The Transactions of the Korean Institute of Electrical Engineers. 2018;67(6):724-29.
[12]Park SJ, Lee JH. Optimum design on reduction of torque ripple for a synchronous reluctance motor with concentrated winding using response surface methodology. The Transactions of the Korean Institute of Electrical Engineers. 2006;55(2):69-75.
[13]Kim YH, Lee JH, Kim NH, Koo BS, Kim CH. Optimum design criteria for maximum torque density & minimum torque ripple of flux switching motor using RSM & FEM. The Transactions of the Korean Institute of Electrical Engineers. 2010;59(3):549-54.