Subsurface Profile Mapping using 3-D
Compressive Wave Imaging
Z A M Hazreek1,2, T B M Faizal1, M Aziman1, A T S Azhar1, S Rosli1, M I M Ashraf3and S M Hafizan1
1Faculty of Civil and Environmental Engineering, Universiti Tun Hussein Onn Malaysia, 86400 Batu Pahat Johor, MY (E-mail: [email protected];
[email protected];[email protected];[email protected];
2School of Physics, Universiti Sains Malaysia, 11800 USM Penang, MY
(E-mail: [email protected]
3School of Civil Engineering, Universiti Sains Malaysia, 14300 Nibong Tebal Penang, MY (E-mail: [email protected])
Abstract
Geotechnical site investigation related to subsurface profile mapping was commonly performed to provide valuable data for design and construction stage based on conventional drilling techniques. From past experience, drilling techniques particularly using borehole method suffer from limitations related to expensive, time consuming and limited data coverage. Hence, this study performs subsurface profile mapping using 3-D compressive wave imaging in order to minimize those conventional method constraints. Field measurement and data analysis of compressive wave (p-wave, vp) was performed using seismic refraction survey (ABEM Terraloc MK 8, 7 kg of sledgehammer and 24 units of vertical geophone) and OPTIM (SeisOpt@Picker & SeisOpt@2D) software respectively. Then, 3-D compressive wave distribution of subsurface studied was obtained using analysis of SURFER software. Based on 3-D compressive wave image analyzed, it was found that subsurface profile studied consist of three main layers representing top soil (vp = 376 – 600 m/s), weathered material (vp = 900 – 2600 m/s) and bedrock (vp > 3000 m/s). Thickness of each layer was varied from 0 – 2 m (first layer), 2 – 20 m (second layer) and 20 m and over (third layer). Moreover, groundwater (vp = 1400 – 1600 m/s) starts to be detected at 2.0 m depth from ground surface. This study has demonstrated that geotechnical site investigation data related to subsurface profiling was applicable to be obtained using 3-D compressive wave imaging. Furthermore, 3-D compressive wave imaging was performed based on non destructive principle in ground exploration thus consider economic, less time, large data coverage and sustainable to our environment.
Keywords
INTRODUCTION
The main purpose of the site investigation is to determine sub-surface profile which required the information of soil, rock and groundwater. Generally, site investigation consists of two methods based on conventional and alternative method. Conventional method referred to drilling method such as boreholes, test pit and probes (in-situ test). In the past, several limitations of conventional method were due to time consuming, expensive, limited data coverage and less environmental sustainability. Past researcher has reported that conventional method limitation was due to the expensive, time consuming [1, 2] as well as limited data coverage [3, 4, 5, 6]. Conventional method efficiency may reduce particularly when working on large and difficult sites due to difficulty of equipment mobilization and operational process. Information obtained from drilling methods only provides information on exact drilling point location (1-D) thus promoting to questionable results due to its uncertainties of interpolation approach. Information obtained from drilling method was a single point data (1D) and common interpolation technique between large boreholes spacing can lead to increase the degree of uncertainties of subsurface profile investigated [5, 6]. Cost of site investigation may be increased proportional to the drilling number in order to obtained accurate results. In addition, conventional method requires drilling process which consider as destructive method thus may not be sustainable to our environment during extensive exploration. As reported by [7], problems which may occur during the exploration at difficult sites always related to time and cost consumption due to rugged topography, large coverage area, sophisticated equipment and manpower. According to [8], conventional method particularly invasive technique provide more reliable results but suffering from laborious, time consuming and results reliability turn difficult involving large scale of area. The solutions to these challenges will require multidisciplinary research across the social and physical sciences and engineering [9].
Hence, alternative method related to geophysical method was introduced in order to minimize conventional method constraints. Geophysical method offers the chance to overcome some of the problems inherent in more conventional ground investigation techniques [10]. Geophysical techniques contributes several advantages such as it can be performed fast and low cost and has the ability to cover greater areas more thoroughly [11, 7, 2, 12, 5]. Geophysical studies are measurements of physical quantities (resistance, speed of propagation of sound, density, magnetism, conductivity, etc.) aimed at identifying comprehensively the rock mass structure and lithology characteristics to be used in geotechnical studies, water investigations, etc. [13]. Geophysical method consists of several techniques including seismic, electrical resistivity, ground penetrating radar, gravity and magnetic method. Geophysical methods offer some advantages related to low cost, fast and
greater data coverage. As reported by [14], geophysical techniques are non-destructive, non-invasive, relatively fast and cheap.
Geophysical method with particular reference to seismic refraction method was suitable to be adopted in site investigation particularly on characterization purposes. Seismic refraction method was suitable in determination of near surface of geotechnical characterization [15, 16, 17, 18, 19]. The principle of seismic refraction exploration is measuring time taken for a wave to travel from one location to another location. The time taken is a function of elastic modulus of the material through which the wave travels. Layers below the earth surface was investigated using seismic wave (Body wave: Primary & Secondary wave or Surface wave: Rayleigh
and Love wave) based on Snell’s law. Reflection and refraction of seismic wave will be produced when waves propagate in a medium (geo-materials)
follow the elastic characteristic through all directions. The motion of wave’s
particle will be recorded as a time function at a certain distance. Consequently, layers and structures in the subsurface will be determined. Hence, seismic refraction method was able to determine depth of soil over rock by measuring the first arrival time of wave (Compressive wave: P-wave) at different points along a line. Seismic refraction field measurement can be performed fast with less manpower. Field equipment mobilization and setup was easy due to its portable, lighter weight and can be dismantle into few components. Moreover, seismic refraction method able to provide large data coverage based on compressive wave distribution of 2-D and 3-D imaging. Furthermore, seismic refraction method was performed based on indirect test (non-destructive method) which explore the subsurface profile non-invasively thus consider sustainable to our environment. According to [20], lithology, porosity and interstitial fluids of geo-materials can influenced the success of interpretation of subsurface profile based on the seismic P-wave velocity contrast. Furthermore, the reliability performance of any individual geophysical methods will always depends on fundamental physical constraints, e.g. penetration, resolution, and signal to-noise ratio [6] and [21]. Hence, this study focused on 3-D compressive wave imaging via seismic refraction method to investigate subsurface profile at Parit Seri Mendapat, Batu Pahat, Johor Malaysia.
METHODOLOGY
of sedimentary rocks (Interbedded sandstone, siltstone and shale). Regional geology map of study area was given in Figure 2. Field observation founds that study area consist of sediment material such as sand, silt and clay.
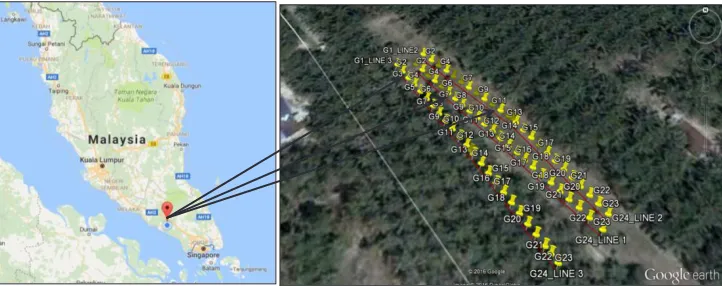
3-D compressive wave imaging was obtained based on seismic refraction method. Three (3) seismic spread lines (total length of each line = 115 m) was performed in parallel direction according to west-east alignment as shown in Figure 1. Basically, seismic refraction method consists of three (3) main components related to source, receiver and record. Source, receiver and record were performed using ABEM Terraloc MK-8 seismograph, 24 channels of 28 Hz vertical geophone, and 7 kg sledgehammer respectively. All spread lines configuration was based on 5 m of geophone spacing, 50 m
of offset distance and 10 – 12 m of spread line parallel spacing. In order to
[image:4.482.63.424.384.527.2]obtained adequate seismic wave, seismograph sampling interval (200 µs) and number of sample (4096) was selected based on site condition suitability. Seven (7) numbers of shot points for all spread lines was performed based on 5 in line shot point and 2 offset shot point. 20 to 30 seismic data stacking was performed for all shot point location in order to procedure good seismic wave particularly compressive wave (primary wave, vp). Finally, seismic raw data obtained from field measurement was analyzed using OPTIM and SURFER software to produce 3-D compressive wave imaging.
of sedimentary rocks (Interbedded sandstone, siltstone and shale). Regional geology map of study area was given in Figure 2. Field observation founds that study area consist of sediment material such as sand, silt and clay.
3-D compressive wave imaging was obtained based on seismic refraction method. Three (3) seismic spread lines (total length of each line = 115 m) was performed in parallel direction according to west-east alignment as shown in Figure 1. Basically, seismic refraction method consists of three (3) main components related to source, receiver and record. Source, receiver and record were performed using ABEM Terraloc MK-8 seismograph, 24 channels of 28 Hz vertical geophone, and 7 kg sledgehammer respectively. All spread lines configuration was based on 5 m of geophone spacing, 50 m
of offset distance and 10 – 12 m of spread line parallel spacing. In order to
obtained adequate seismic wave, seismograph sampling interval (200 µs) and number of sample (4096) was selected based on site condition suitability. Seven (7) numbers of shot points for all spread lines was performed based on 5 in line shot point and 2 offset shot point. 20 to 30 seismic data stacking was performed for all shot point location in order to procedure good seismic wave particularly compressive wave (primary wave, vp). Finally, seismic raw data obtained from field measurement was analyzed using OPTIM and SURFER software to produce 3-D compressive wave imaging.
[image:5.482.102.384.64.272.2]Figure 1. Study area and seismic spread lines performed at site studied.
Figure 2. Study area and seismic spread lines performed at site studied [19].
RESULT AND DISCUSSION
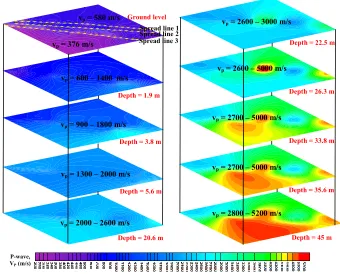
3-D compressive wave imaging (3-DCWI) obtained on site studied was given in Fig. 1. According to Figure 3, study area consist of three (3) main layer due to the obvious different contrast of compressive wave (p-wave) representing three (3) types of geo-materials with different characteristics. First layer was found to be thin surface layer with a thickness of 2 m which
characterized by low compressive wave (p-wave) value ranging from 376 –
600 m/s. Thickness of second layer was varied from 2 – 20 m depth from
ground surface with compressive wave (p-wave) value ranging at 900 –
2600 m/s. Third layer of subsurface profile studied was detected at 20 m depth from ground level based on compressive wave (p-wave) value of 3000 m/s and above. All layers interpretation has been verified based on previous established compressive wave (p-wave) of earth materials. Soil which considers as subsurface overburden materials has p-wave value (vp) of 250
– 600 m/s [23]. Second layer was interpreted as weathered zone which
possibly consist of a mixture of highly weathered to moderately weathered
zone. Weathered rock may be interpreted by p-wave value of 457 – 3657
m/s [24]. Then, third layer of subsurface profile studied was interpreted as bedrock which possibly derived from slightly weathered to fresh rock. P-wave velocity value of bedrock was 3000 m/s and over [25]. Moreover, groundwater was interpreted occurred at 2.0 m depth and over due to its
p-wave velocity value which ranging from 1400 – 1600 m/s. P-wave velocity
value for water was varied from 1400 – 1600 m/s [26]. In addition to
verification purposes, all geo-materials interpreted from 3-DCWI have
shown some good correlation based on geological map as explained previously together with field observation.
[image:6.482.71.411.237.511.2]3-DCWI was able to present the subsurface profile model in a global perspective which able to contribute for planning related to suitable drilling number and location. 3DCWI was able to obtain image cross-sectional area in wider coverage thus able to compliment drilling results. However, suitable seismic spread line spacing need to be carefully decided in order to obtained best possible of 3-DCWI representing accurate subsurface profile studied. General consideration of suitable spread line spacing was relative to complexity of geological study area and specific target interest (e.g. thickness and layers, boulder, bedrock, etc).
Figure 3. 3-Dcompressive wave (p-wave, vp) imaging.
CONCLUSION
Subsurface profile mapping at Parit Seri Mendapat, Batu Pahat, Johor Malaysia was successfully being performed using 3-D compressive wave (p-wave) imaging (3-DCWI). The geometry and geo-materials of subsurface profile studied has been determined by analyzing seismic compressive wave data and the result has shown some good correlation based on previous references. This finding has proved that 3-DCWI technique was applicable as an alternative method in geotechnical site investigation. Moreover,
3-Spread line 1 Spread line 2 Spread line 3
Ground level
vp = 580 m/s
vp = 376 m/s
vp = 600 – 1400 m/s
vp = 900 – 1800 m/s
Depth = 1.9 m
Depth = 3.8 m
Depth = 5.6 m
Depth = 20.6 m
vp = 2000 – 2600 m/s
vp = 1300 – 2000 m/s
vp = 2600 – 3000 m/s
vp = 2600 – 5000 m/s
vp = 2700 – 5000 m/s
vp = 2700 – 5000 m/s
vp = 2800 – 5200 m/s
Depth = 22.5 m
Depth = 26.3 m
Depth = 33.8 m
Depth = 35.6 m
Depth = 45 m
shown some good correlation based on geological map as explained previously together with field observation.
3-DCWI was able to present the subsurface profile model in a global perspective which able to contribute for planning related to suitable drilling number and location. 3DCWI was able to obtain image cross-sectional area in wider coverage thus able to compliment drilling results. However, suitable seismic spread line spacing need to be carefully decided in order to obtained best possible of 3-DCWI representing accurate subsurface profile studied. General consideration of suitable spread line spacing was relative to complexity of geological study area and specific target interest (e.g. thickness and layers, boulder, bedrock, etc).
Figure 3. 3-Dcompressive wave (p-wave, vp) imaging.
CONCLUSION
Subsurface profile mapping at Parit Seri Mendapat, Batu Pahat, Johor Malaysia was successfully being performed using 3-D compressive wave (p-wave) imaging (3-DCWI). The geometry and geo-materials of subsurface profile studied has been determined by analyzing seismic compressive wave data and the result has shown some good correlation based on previous references. This finding has proved that 3-DCWI technique was applicable as an alternative method in geotechnical site investigation. Moreover,
3-Spread line 1 Spread line 2 Spread line 3
Ground level
vp = 580 m/s
vp = 376 m/s
vp = 600 – 1400 m/s
vp = 900 – 1800 m/s
Depth = 1.9 m
Depth = 3.8 m
Depth = 5.6 m
Depth = 20.6 m
vp = 2000 – 2600 m/s
vp = 1300 – 2000 m/s
vp = 2600 – 3000 m/s
vp = 2600 – 5000 m/s
vp = 2700 – 5000 m/s
vp = 2700 – 5000 m/s
vp = 2800 – 5200 m/s
Depth = 22.5 m
Depth = 26.3 m
Depth = 33.8 m
Depth = 35.6 m
Depth = 45 m
P-wave, VP (m/s)
DCWI via seismic refraction method was able to mapped subsurface profile thus extending surface information observed during the surface physical mapping. The application of 3-DCWI via seismic refraction in conjunction with other records (borehole data, geological information, established resistivity values of geo-materials, etc) was applicable in evaluation of subsurface mapping due to its ability to differentiate various properties of earth materials based on compressive wave analyzed. Geophysical method with particular reference to 3-DCWI is suitable for our sustainable site investigation due to its ability to reduce time, money and compliment others conventional drilling method.
ACKNOWLEDGEMENTS
Thank are due to all research members for their tremendous work and cooperation. Many thanks go to Research and Innovation Fund and IGSP from Vot. U258, Universiti Tun Hussein Onn Malaysia for the sponsor and financial support throughout this research activity.
REFERENCES
Osman, F. I. S. and Osman, S. B. A. S. (2012) Integrating geo-electrical and
geotechnical data for soil characterization, Int. J. of Appl. Phys. and
Maths, 2.
Liu, C. and Evett J. B. (2008) Soils and Foundation. Pearson Prentice Hall, 2008.
Hazreek, Z. A. M., Aziman, M. Azhar, A. T. S., Chitral, W. D., Fauziah, A. and Saad, R. (2015) The Behaviour of Laboratory Soil Electrical
Resistivity Value under Basic Soil Properties Influences, IOP
Conference Series: Earth and Environmental Science, 23.
Abidin, M. H. Z., Ahmad, F., Wijeyesekera, D. C., Saad, R. and Baharuddin, M. F. T. (2013) Soil Resistivity Measurements to Predict
Moisture Content and Density in Loose and Dense Soil, Applied
Mechanics and Materials, 353-356.
Godio, A., Strobbia, C. and De Bacco, G. (2006) Geophysical
Characterisation of a Rockslide in an Alpine Region, Engineering
Geology, 83.
Mauritsch, H. J. Seiberl, W. Arndt, R. Römer, A. Schneiderbauer, K. and Sendlhofer, G. P. (2000) Geophysical Investigations of Large Landslides
in the Carnic Region of Southern Austria, Engineering Geology, 56.
Khatri, R., Shrivastava, V. K. and Chandak, R. (2011) Correlation between Vertical Electric Sounding and Conventional Methods of Geotechnical
Site Investigation, International J. of Adv. Eng. Scie. and Tech, 4.
Geomorphology, 145–146.
Fragaszy, R., Santamarina, J., Amekudzi, A., Assimaki, D., Bachus, R., Burns, S., Cha, M., Cho, G., Cortes, D., Dai, S., Espinoza, D., Garrow, L., Huang, H., Jang, J., Jung, J., Kim, S., Kurtis, K., Lee, C., Pasten, C., Phadnis, H., Rix, G., Shin, H., Torres, M. and Tsouris, C. (2011)
Sustainable development and energy geotechnology — Potential roles
for geotechnical engineering, KSCE Journal of Civil Engineering, 15.
Clayton, C. R. I. Matthews M. C. and Simons N. E. (1995) Site Investigation. Blackwell Science Ltd, UK, 1995.
Hazreek, Z. A. M., Rosli, S., Chitral, D. C., Fauziah, A., Azhar, A. T. S., Aziman, M. and Ismail, B. (2015) Soil Identification using Field
Electrical Resistivity Method, Journal of Physics: Conference Series,
622.
Cosenza, P., Marmet, E., Rejiba, F., Jun Cui, Y., Tabbagh, A. and Charlery, Y. (2006) Correlations between geotechnical and electrical data: A case
study at Garchy in France, Journal of Appl. Geophys, 60.
Lukić, I., Barać, D. and D. Zovko (1974) Seismic Refraction Method –
Review, Geoexploration, 12.
Kowalczyk, S., Maślakowski, M. and Tucholka, P. (2014) Determination of
the correlation between the electrical resistivity of non-cohesive soils
and the degree of compaction, Journal of Appl. Geophys, 110.
Nadia, R., Saad, R., Muztaza, N. Saidin, N. A. and Ismail, M M. (2016) Geotechnical parameters study using seismic refraction tomography,
Jurnal Teknologi, 78,
Aziman, M., Hazreek, Z. A. M., Azhar, A. T. S. and Haimi D. S. (2016) Compressive and Shear Wave Velocity Profiles using Seismic
Refraction Technique, Journal of Physics: Conference Series, 210,
Tajudin, S. A. A., Abidin, M. H. Z., Madun, A. and Zawawi. M. H. (2015) Compressive and Shear Wave Velocity Profiles using Seismic
Refraction Technique, IOP Conference Series: Materials Science and
Engineering, 136.
Azwin, I. N., Saad, R. and Nordiana, M. (2013) Applying the Seismic
Refraction Tomography for Site Characterization, APCBEE Procedia, 5.
Abidin, M. H. Z., Saad, R., Ahmad, F., Wijeyesekera, D. C. and Baharuddin, M. F. T. (2012) Seismic Refraction Investigation on Near
Surface Landslides at the Kundasang area in Sabah, Malaysia, Procedia
Engineering, 50.
Israil, M. and Pachauri, A. K. (2003) Geophysical characterization of a
landslide site in the Himalayan foothill region, Journal of Asian Earth
Sciences, 22.
McCann, D. M. and Forster, A. (1990) Reconnaissance geophysical
methods in landslide investigations, Engineering Geology, 29.
Malaysia, M. G. D. (1985) Geological Map of Peninsular Malaysia, 8th Ed.
Lee, T. S. 2002 Slope Stability and Stabilization Methods: Geologic Site Investigation. John Wiley & Sons, Inc. 2002.
Cornforth, D. H. 2005 Landslides in Practice: Investigation, Analysis and Remedial/Preventative Option in Soils. John Wiley & Sons, Inc. New Jersey 2005.
Blyth F. G. H. and Freitas, M. D. (1974) A Geology for Engineers. Hodder & Stoughton Educational, London, 1974.
![Figure 2. Study area and seismic spread lines performed at site studied [19].](https://thumb-us.123doks.com/thumbv2/123dok_us/8758554.893445/5.482.102.384.64.272/figure-study-area-seismic-spread-lines-performed-studied.webp)