FUZZY RANDOM REGRESSION TO IMPROVE COEFFICIENT ESTIMATION FOR MALAYSIAN AGRICULTURAL INDUSTRY
HAMIJAH BINTI MOHD RAHMAN
A dissertation submitted in partial
fulfillment of the requirement for the award of the Degree of Master of Computer Science (Soft Computing)
Faculty of Computer Science and Information Technology Universiti Tun Hussein Onn Malaysia
ABSTRACT
ABSTRAK
CONTENTS
TITLE i
DECLARATION ii
DEDICATION iii
ACKNOLEDGEMENT iv
ABSTRACT v
ABSTRAK vi
CONTENTS vii
LIST OF TABLES x
LIST OF FIGURES xi
LIST OF ABBREVIATIONS xii
LIST OF APPENDICES xiii
CHAPTER 1 INTRODUCTION
1.1 Background Study 1
1.2 Problem Statement 2
1.3 Objective 3
1.4 Scope 3
1.5 Significance of the Study 4
1.6 Dissertation Overview 4
CHAPTER 2 LITERATURE REVIEW
2.2 Uncertainties 5
2.2.1 Fuzzy Theory 5
2.2.2 Random/ Probability Theory 6
2.2.3 Fuzzy Random Variable 6
2.3 Prediction Model 7
2.4 Regression Analysis 8
2.4.1 Fuzzy Regression 9
2.4.2 Fuzzy Random Regression 11
2.5 Production Planning 14
2.6 Application to Industrial Sector 15
2.6.1 Rubber Industry 15
2.6.2 Paddy Industry 16
2.7 Chapter Summary 17
CHAPTER 3 RESEARCH METHODOLOGY
3.1 Overview 18
3.2 Terminology and Notations 18
3.3 Research Activity 18
3.3.1 Data Collection and Data Preparation 19 3.3.2 Estimating Model Coefficient 21
3.3.3 Result and Analysis 22
3.4 Application of Methods 22
3.4.1 Fuzzy Regression 23
3.5 Implementation of the Proposed Method 24 3.6 Data Preparation for Coefficient Estimation 27
3.7 Estimating the Coefficient 29
3.7.1 Regression Model for Rubber Production 30 3.7.2 Regression Model for Paddy Production 31
3.8 Chapter Summary 31
CHAPTER 4 RESULT AND DISCUSSION
4.1 Overview 32
4.2 Result from Coefficient Estimation 33
4.3 Development of Linear Model 35
4.4 Measurement of Errors 37
4.5 Chapter Summary 41
CHAPTER 5 CONCLUSIONS
5.1 Overview 42
5.2 Summary 42
5.3 Future Work 43
REFERENCES 45
LIST OF TABLES
3.1 Selected parameter for the rubber and paddy dataset 20
3.2 Sample of rubber dataset 20
3.3 Sample of paddy dataset 20
3.4 Data of rubber production 26
3.5 Data of paddy production 26
3.6(A) The dry production 27
3.6(B) The latex production 28
3.6(C) The total production 28
3.6(D) The paddy production 29
3.6(E) The rice production 29
3.6(F) The total production 29
4.1 Definition of notations 32
4.2 Coefficient result for the rubber production 33 4.3 Coefficient result for the paddy production 34
4.4 Predicted rubber production 37
4.5 Predicted paddy production 38
4.6 Error measurement for rubber 40
LIST OF FIGURES
3.1 Flowchart of the research methodology 19
4.1 Prediction graph for rubber production 38
4.2 Prediction graph for paddy production 39
4.3 Residuals plots for rubber FRR model 40
LIST OF ABBREVIATIONS
FRRM Fuzzy Random Regression Model
FRM Fuzzy Regression Model
MRB Malaysian Rubber Board
MREPC Malaysian Rubber Export Promotion Council MIDA Malaysia Investment Development Authority DOA Department of Agriculture
MAE Mean Absolute Error
MSE Mean Square Error
LIST OF APPENDICES
APPENDIX TITLE PAGE
A Fuzzy random data 50
B Dataset of other criteria in rubber model 52
C Dataset of other criteria in paddy model 55
CHAPTER 1
INTRODUCTION
This chapter explains the background of the study which involves the estimating coefficient values from historical data whereby fuzzy random information coexist. A fuzzy random regression analysis is introduced to estimate coefficient of a linear programming from a statistical data which contain fuzzy random data. The problem statement, objectives, scope and significance of the study are also presented in this chapter.
1.1 Background study
Coefficient or weight value is a constant that represents the rate of change of one variable as a function of changes in the others. The coefficient value is used to explain the relation between dependent and independent variables. Equation 1.1 (Montgomery et al., 2012) shows the example of coefficient used in linear regression analysis.
(1.1)
regression analysis is a statistical technique for modeling the relationship between variables (Montgomery et al., 2012). This technique is supported by effective statistical analysis dealing with numeric precise data. In other words, the obtained statistical model is not considering the imprecision or uncertainty in the data. However, in real life application, there exists uncertainty fuzzy data in which subjective human estimation play a main role. As a result, a fuzzy regression models was introduced to handle with the fuzzy uncertainty input-output data (Tanaka et al., 1982).
On the other hand, it is a common situation in real life problem where the uncertainty is occurring simultaneously fuzzy with random data. Fuzziness is comes from the vague or imprecise information when mistakes can come from man, machine or the expert himself. Meanwhile, the randomness occurs when the observed data is collected randomly.The fuzzy random situation is explained as follows. Assume that an expert is responsible to evaluate the production of two sample products. Randomness occurs because it is not known which product may produce higher quantity, and vice versa. Meanwhile, fuzziness originates from the lingual notion such as ‗sufficiently larger‘, ‗is about‘ etc. used by the decision maker to express the preference instead of the precise figures.
When such simultaneous uncertainties occur in the data, an appropriate mathematical programming model is necessary to handle these uncertainties. Hence, the fuzzy random regression is introduced to deal with the hybrid uncertainty where the fuzziness and randomness are the central roles (Watada et al., 2009). The fuzzy random regression uses confidential interval to include more possibility in its prediction strategies.
1.2 Problem statement
The difficulties occurred as the decision maker difficult to decide the exact coefficient values. The decision also, might vary from one decision maker to another. The differences among decision maker can be treated statistically, but each fuzzy term should be treated by considering the formalism of fuzzy set. Therefore, it is important to ensure that the tool to estimate the coefficient value is sufficiently can handle the explained situation.
Additionally, the historical data which is captured from the real situation may contain simultaneous fuzzy random information whereby the collective data which is collected randomly contain imprecision. Moreover, the real life application is commonly include the state of randomness and fuzziness. The classical regression analysis is unable to deal with the uncertainties. Besides, the existence of random data is beyond the scope of fuzzy regression approach. Motivated by the above-mentioned problems, a fuzzy random regression method is proposed to be applied to estimate the model‘s coefficient value in the fuzzy random environment.
1.3 Objectives
The main objective of this study is to implement the fuzzy random regression approach to determine the fuzzy random based coefficient value under fuzzy random uncertainties. Specifically, the objectives of this study are:
1. to estimate the coefficient value from statistical data which contain fuzzy random information
2. to develop linear programming model for selected parameter in agricultural industrial application
3. to compare the fuzzy random regression with the fuzzy regression approach.
1.4 Scope
is dry and latex. The selected rubber historical data is for 13 year interval beginning 2000 until 2012. Meanwhile, two kinds of products of Malaysian paddy industry is selected which are paddy and rice. Six years of paddy historical data is been selected beginning 2006 until 2011.
1.5 Significance of the study
In real practice, a decision maker provides the coefficient information. However, the coefficient value sometime is not easy to obtain or determine beforehand which makes the relevant coefficient value is unavailable on the time it is required. Therefore, the fuzzy random regression method is beneficial to estimate the coefficient value especially when the information is not available.
Conventionally, in mathematical programming, the coefficient is assumed as a constant and precise value. However, in real practical application, the presence of uncertainties (e.g. fuzzy and random information) in the real data could not be ignored. It is important to remain the uncertainties in the modeling of real situation to avoid misleading result.
The methodology presented in this study is able to assist coefficient values extraction from statistical data with the treatment of fuzziness and randomness. Hence, at one particular point of view, the fuzzy random regression method is important to facilitate the decision maker to decide the coefficient value and further modeling the real situation problem mathematically. Thus, the difficulties of decision maker to decide the coefficient value can be reduced and uncertainties situation can be treated sufficiently.
1.6 Dissertation overview
CHAPTER 2
LITERATURE REVIEW
2.1 Overview
This chapter is focuses in explaining a review on prediction model, classical regression approach; fuzzy regression approach fuzzy random regression approach and also production planning. The review on the Malaysian rubber industry and paddy industry is also presented as a background.
2.2 Uncertainties
Uncertainty theory is a branch of mathematics where it is used to model the human uncertainty (Liu, 2012). Generally, the uncertainty can be defined as that which is precisely known (Booker and Ross, 2011). The phenomenon of uncertainty is a common feature in real world whereby it happened when some situation can be quantified by uncertain measure. The concept of uncertainty was introduced by Zadeh where he defined the fuzzy set concept as a class of objects encountered in the real physical world do not have precisely defined criteria of membership (Zadeh, 1965). Uncertainty in the data is not only occurring in fuzzy situation, as the data may exist randomly. Moreover, uncertainty may exist simultaneously fuzzy with random data. In this section, the fuzzy theory, random and also concept of fuzzy random variable are explained.
2.2.1 Fuzzy theory
conventional mathematical operation. Crisp Logic is a classical logic which is valid for ideal cases with more precision.
More specifically, fuzzy logic may be viewed as an attempt at formalization of two remarkable human capabilities to converse, reason and make rational decision in an environment of imprecision, uncertainty, incompleteness of information, conflicting information and partiality of truth (Zadeh, 2008). The main motivation to apply fuzzy logic is because the algorithm can manipulate vague, imprecise and uncertainty concepts. It also has the capability to operate on perception-based information in which come from human natural language.
2.2.2 Random/ probability theory
Random theory or probability is a quantity that is measured in connection with random experiment. The probability theory comprises mathematically based theories and methods for investigating random phenomena (Beichelt, 2006). Commonly, random phenomena occur in connection with random experiment in which outcomes of the random experiment could not be predicted with certainty. An example of random experiment is like counting the number of vehicle arriving at a filling station a day (Beichelt, 2006).
The probability theory is different from fuzzy theory where this theory is lacking in capability to operate perception-based information (Zadeh, 2002). The perception-based information is based on the human natural language-proposition which describes one or more perception. However, this probability theory has limitation whereby it unable to operate on perception-based information (Zadeh, 2002).
2.2.3 Fuzzy random variable
data has some element of uncertainties (Kwarkenaak, 1979). Since then, various extensions of these variables had been studied. Puri and Ralescu (1986) define a concept of fuzzy random variables and the expectation of these variables by investigating some of their properties.
Moreover, Lopez-Diaz and Gil (1997) discussed the constructive definition of fuzzy random variables that would play an essential role in the constructive definition of their integrals, which will be especially valuable to perform practical computations and to develop further results concerning the integration of these variables. Furthermore, Gil et al., (2006), analysed the interpretation, modelling and impact of the fuzzy random variables. Yang and Gao (2010) investigate the fuzzy random variables by their own characteristic and uniqueness. In all of these works, a fuzzy random variable is defined as a function that assigned a fuzzy subset in order to find the possible output of a random experiment. The different definitions in the literature disagree on the measurability condition imposed to the mapping, and in the properties of the output space, but all of them intend to model situations that incorporates fuzziness and randomness (Cousco et al., 2007).
Based on the explanation, it is apparently realized that the uncertain information are originated from many resources. Even though the solution which uses precise value is satisfactorily good, retaining the uncertainties in the developed model is necessarily important to remain the underlying intention and to address some limitation.
2.3 Prediction model
prescribed. Besides that, the quality testing also used data in order to identify whether any product that the company produced will pass the quality test.
In order to accomplish a prediction, an appropriate method is necessary as a tool in assisting to predict accurately. Several methods for prediction have been suggested and implemented such as Kalman filters, Artificial Neural Network and also regression analysis. The Kalman filter is taken from control theory and is used to resolve the statistical error. However, this method has done little to replace forecast using human judgement by people knowledgeable in their filed (Cave, 2011). Meanwhile, the Artificial Neural Network is suitable been applied when there is huge data provided. Besides that, a regression analysis is a well-known method applied in prediction problem when the statistical historical data still intact.
2.4 Regression analysis
Regression analysis is one of the techniques uses in statistical data for coefficient estimation. This technique is supported by effective statistical analysis dealing with precise crisp data. The importance of this regression approach is to investigate and model the relationship between variables. Regression analysis is used in evaluating the functional relationship between the dependent and independent variables and also in determining the best-fit model for describing the relationship (Yang and Ko, 1997).
This technique is widely used in forecasting and prediction and had been used over a decades. There also a study of regression where the researchers identified the algebraic relationship between classical regression and total least square estimation (Huffle and Vandewall, 1987). Furthermore, regression also had been used in medical problem where the equation was used to estimate the total body water for diabetes‘s patient (Chertow et al., 1997). The applications of regression are numerous and occur in almost every field such as engineering, chemical science, economic and others (Montgomery et al., 2012). Thus, the regression analysis have a significant role in finding relationship between variables and apparently useful for various application.
is useful to make the method capable to solve the limitation in the traditional regression method.
2.4.1 Fuzzy regression
Fuzzy regression is a regression analysis on fuzzy data in dealing with the fuzziness environment (Yang and Ko, 1997). The first linear of regression analysis with fuzzy model was proposed by Tanaka et al., (1982). This method was introduced as to cope with the imprecise data coming from fuzzy environments where human subjective estimates play a main role. Fuzzy regression has been studied and applied widely in the fuzzy environment. The concept of fuzzy regression related to Tanaka approach has been discussed including a consideration of fuzzy least- squares regression models (Shapiro, 2005).
The study of fuzzy regression technique is continues by improve the fuzzy regression proposed by Tanaka et al., (1982) with the introducing fuzzy input-output data using shape-preserving fuzzy arithmetic operation the fuzzy partition (Song et al., 2005). Moreover, new method for computation of fuzzy regression was proposed where the approach is depends on the entropy‘s properties to rectify previous problems in fuzzy linear regression with crisp input and fuzzy output (Pasha et al., 2007). The fuzzy regression also applied as to solve problem in agricultural industry where it used to decide the fuzzy weight based on the criteria of oil palm fruit (Nureize and Watada , 2010). Meanwhile, different approach has also been proposed for computation of fuzzy linear regression based on the goal programming technique to estimate upper and lower fuzzy band with fuzzy output and crisp inputs (Abdollahzadeh et al., 2010).
Classical fuzzy regression is written as follows:
n j x x A x A x A Y j t j jn n j j j , 2 , 1 ; 1 ] [ ] [ 1 2 2 1 1 Ax (2.1)
where regression coefficient Ai is a triangular-shaped fuzzy number Ai ai,hi
Equation (2.1) can be written as Equation 2.2 which referring to the extension principle: t j t j t j j
Y Ax ax ,h|x |
(2.2) where|xj |(|xj1|,|xj2 |,,|xjK |). The output of the fuzzy regression (2.1) results in fuzzy number, whose coefficients are fuzzy numbers.
The regression model with fuzzy coefficients can be described using the lower boundary axjt h|xj |t, centre axjtand upper boundaryaxjt h|xj |t. A sample(yj,xj), j1,2,,n is defined for the total evaluation with centreyj, spread dj as a fuzzy numberyj yj,dj . The inclusion relation between the model and the samples should be written as Equation 2.3:
t j t j j j t j t j j j L d L y L d L y | ) ( ) ( | | ) ( ) ( 1 1 1 1 x | h ax x h ax (2.3)
In other words, the fuzzy regression model is built to contain all samples in the model. This problem results in a linear program.
Using the notations of observed data(yj,xj),yj yj,dj , ]
, , ,
[ j1 j2 jK j x x x
x for j 1,2,,n and fuzzy coefficients Ai ai,hi for
, , , 2 , 1 K
i the regression model can be mathematically written as the following
linear programming problem:
. 0 , , , 2 , 1 , | , , , 2 , 1 , | subject to | | min 1 h x | h ax x | h ax x h h a, n j d j y n j d y t j t j j t j t j j j t j n j
(2.4)
2.4.2 Fuzzy random regression
Fuzzy random regression is a regression technique that was proposed in coping with the fuzzy random data. In real world regression analysis, statistical data may be linguistically imprecise or vague where the real data cannot be characterized by using only the formalism of random variables as there is existence of stochastic and fuzzy uncertainty (Watada et al., 2009). Statistical inference with fuzzy random data transfers the fuzziness into parameter estimators and it may be necessary to defuzzify the vague parameter at level decision making (Nather, 2006).
Regression based on fuzzy random data is widely been used and many researcher study this technique to solve problem with these fuzzy random data (Rodriguez et al., 2009). The study of this fuzzy regression analysis is based on fuzzy random variables with confidence intervals in the fuzzy multi attribute decision making was been proposed, as to enable decision makers to evaluate and find the importance weight (Watada, 2011). Determining weight in multi-attribute decision making is important, so a fuzzy random regression to estimate attribute importance in total evaluation within the bound of hybrid uncertainty is proposed (Nureize and Watada, 2011). Moreover, the fuzzy random regression method also has been proposed as an integral component of regression models in handling the existence of fuzzy random information (Nureize and Watada, 2011).
The expected value of a fuzzy variable is presented as follows:
Definition 2.1: Let Y be a fuzzy variable. Under the assumption that the two
integrals are finite, the expected value of Y is defined as follows in (Watada et al., 2009): 0 ) ( ) (
0 2 1 sup sup
1 ) ( sup ) ( sup 1 2 1 ]
[Y t t dr dr
E Y t
r t t Y r t Y r t Y r t (2.5)
Following from Equation (3.1), the expected value of Yis defined as
4 2 ] [ r l a c a Y
Definition 2.2: Let us assume that
,,Pr
is a probability space and Fv is a collection of fuzzy variables defined on possibility space
,P
,Pos
. A fuzzy random variable is a map X:Fv such that for any Borel subsetBof,
X ω B
Pos is a measureable function of
.Let V be a random variable on probability space
,,Pr
. It makes
V
2,V
2,V
6
X a triangular fuzzy variable for every on
some possibility space
,P
,Pos
. As a result, X is a triangular fuzzy randomvariable.
The expected value of the fuzzy variable X is denoted by Ε
X
ω
forany fuzzy random variable X on, (Liu and Liu, 2003). Thus, the expected value of the fuzzy random variable X is defined as the mathematical expectation of the
random variable Ε
X
ω
.Definition 2.3: Let X be a fuzzy random variable defined on a probability space
,,Pr
. The expected value of X is defined as follows in (Watada et al., 2009):
dr dr d
X E t Z r t Z r t t Z r t t Z r t
t sup Pr
sup 1 2 1 sup sup 1 2 1 ]
[
0 0 (2.6)
Definition 2.4: Let X be a fuzzy random variable defined on a probability space
,,Pr
with expected value e. The variance of X (Watada et al., 2009) is defined as Equation 2.7.
2varX E X-e (2.7)
where eE[X] given by Definition 2.3.
The preliminary of fuzzy random regression is explained through fuzzy random variable whereby two main components which develop the model were expected value and variance.
In fuzzy random regression method, the confidence intervals are expressed through the expectations and variances of fuzzy random variables. Fuzzy random data Yj (output) and Xjk (input) for all j1,,Nand k1,,K are defined as
j Y M t t j Δ t,r j t,l j t jj Y ,Y ,Y ,p ,
Y
1
(2.8)
jk X M t t jk Δ t,r j t,l j t jjk X ,X ,X ,q ,
X
1
(2.9)
That means all values are given fuzzy variables with probabilities, where fuzzy variables
Y
jt,
Y
jtl,,
Y
jt,r
and
X
tj,
X
tjl,,
X
tj,r
are obtained with probabilityp
tj andt jk
q
for j1,,n, k1,,K and t1,,M ort
1
,
,M
Xjk,
respectively. The fuzzy random data is shown in Appendix A.Let us denote a fuzzy linear model with fuzzy coefficients A*k,,A*K as follows:
,
X
X
j *K jK *k *
j
A
A
Y
1
(2.10)where each
Y
*j denotes an estimate of the output andΔ *r k *l k *r k *l k *
k ,A ,A
A A 2 A
are symmetric triangular fuzzy coefficients when triangular fuzzy random data Xik are given for j = 1,… n, k = 1,…, K as shown in the table of fuzzy random data.
Based on the expected value and variance of fuzzy random variable, the one-sigma confidence (1) interval is shown in the following:
e ,σ Δ
E X var X ,E X var X
I X X (2.11)
Hence, the fuzzy random regression model with confidence intervals is described as follows:
, 1 ; 1 , , A , A Y , ) ( ~ * K * j * j 1 A 1 1 ,K , k ,n , j e I e I e I A A A A A J j j jK jK jj X X X h Y Y
X l k r k K k l k r k
min (2.12)The solution of the fuzzy random regression model with confidence interval can be rewritten as a problem of n samples with one output and K input interval
values (Watada et al., 2009). In other words, it means that when a larger number of n
2.5 Production planning
By definition, production-planning models include decisions on production and inventory quantities; however in addition, there might be resource acquisition and allocation decision, such as adding to the work force and upgrading the training of the current work force (Graves, 1999). In the other words, production planning is a procedure to fix the production goals and to estimate the resources which are required to achieve the goals. The production planning and scheduling involves different complicated task dealing with a hierarchy of decision making problem in the manufacturing environment which require cooperation among multiple function unit such as production, accounting and marketing in an organization (Torabi et al., 2010).
Furthermore, this planning is an important method to improve and achieve the goals of any production process and also help the decision maker to deal with forecasting, planning, scheduling and executing the required production work (Messac et al., 2002). Today, production planning has become very important part of production management because companies have to react to dynamic market conditions and rising customer requirements for shorter delivery times, lower prices and better quality of services (Denisa, 2012). One of the main objectives in production planning is to maximize the production rate of the produced products by choosing appropriate methods and raw materials (Messac et al., 2002).
The importance of production planning influenced many studies on this planning and a lot of methods are applied as to make this planning process become more effective. Messac et al., (2002) proposed an optimization-based model for production planning, and physical programming as an effective method to optimize the production planning process where the model seek to minimize cost and manufacturing time, while maximizing production rate. Pastor et al., 2008 proposed mixed-integer linear programming in a case of production planning in a woodturning company as to achieve the goal to meet the demand at minimum cost, which include the cost of any overtime plus that of any subcontracting.
value of all total gains according to the probabilities. Besides that, Haneveld and Stegeman (2005) proposed a method to write crop succession requirements as constraint in a linear programming model for agricultural production planning. This crop succession requirement has important implication for production planning as to maintain the high yielding of crop production. From the previous studies, it is shown that the production planning has its important role especially in decision making whereby it can be used to improve many parameters such as production rate, profit, etc.
2.6 Application to industrial sector
This study is applied in the industrial sector in Malaysia which is the agricultural industry. Two kinds of Malaysian agricultural industries were selected which are the rubber sector and paddy sector. In this section, these two kinds of industries were explained.
2.6.1 Rubber industry
In the last seventeen years (1990 – 2007), the rubber consumption increased from 187,592 tonnes to 579 248 tonnes where the natural rubber was the main material used (Malaysian Rubber Board). This industry has been evolved through the years and transformed into a more integrated industry and also have gained a multi-billion ringgit. The natural rubber industry is one of Malaysia‘s economic contributors where this industry contributed almost RM36.4 billion in export earnings in 2012 (Market Watch 2012).
Meanwhile, currently there are 120 companies in the tyre and tyre-related products sub sector. There are nine companies as tyre producer, while the other companies produce retread, tyre treads for retreading, valves and other accessories. In addition, the industrial and general rubber product sub sector comprises 185 companies producing various types of rubber products including hoses, tubing, electrical and electronic, machinery and equipment and many more. The rapid growth of the industry would enable Malaysia to become the world‘s largest consumer of natural rubber latex and also the other rubber products.
Nowadays, Malaysia rubber industry is in the recovery stage due to the slow production of the commodity. Malaysia is currently the fourth largest consumer of natural rubber in the world after Thailand, Indonesia and Vietnam (Malaysian Rubber Export Promotion Council). Malaysia aims to become the world's largest producer of natural rubber compete with Thailand, Indonesia and Vietnam. Therefore, a strategic planning should be applied in order to maintain the rubber industry competitiveness.
In order to achieve the national goal, a production planning model is necessary whereby a fuzzy random tool is utilized to find coefficient values for the development of the production planning. The production planning is then used to assist decision making on determining the factor that would give higher impact to the production and further realize the industry aspiration to contribute RM52.9 billion to the Gross National Income by 2020.
2.6.2 Paddy industry
The importance of rice industry is not only as the country‘s staple food, but the industry also provides the main livelihood to about 300 000 farmers who rely on paddy farming as their main source of income. The paddy in Malaysia is mainly grown by smallholders with farm size of about 2.0 hectares. Land utilization for paddy production is currently at 674,928 hectare which is 76% in Peninsular Malaysia (515,657 ha) while Sarawak and Sabah accounted for 18% (118,919 ha) and 6% (40,352 ha) of the total hectarage respectively (Nadia et al., 2012).
Now, rice remains as the country‘s most important crop in terms of cultivation, being the principle staple food for most of the populace (Dano and Samonte, 2005). In fact, for the past fifty years, the Malaysian government has allocated billions of Ringgit in order to increase rice production including R & D, credit facilities, subsidized retail price, guaranteed minimum price, extension support, fertilizer subsidies and irrigation investment (Fahmi et al., 2013). Thus, a good strategy is necessary as to remain the production of rice in Malaysia. One of the strategy that could be applied to improve the existing strategies is production planning. This production planning can be used in decision making level whereby the decision maker will examine the factors that would be effect the rice production. Exploring such option is beneficial as to maintain the higher production of rice in Malaysia.
2.7 Chapter summary
CHAPTER 3
METHODOLOGY
3.1 Overview
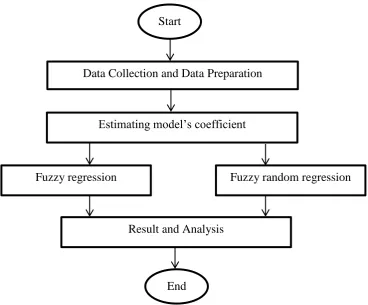
In this chapter, the research methodology is explained. The explanation is including the steps involved in the research activities such as collection data, preparation data, coefficient estimation and comparative study of two methods that applied in this study. Furthermore, the explanations on the steps that included in the methods which are the fuzzy regression and fuzzy random regression is provided.
3.2Terminology and notations
In this study, the following notation is used to define the models: : decision variable
: attribute weight vector or coefficient
ik : expected value of attribute j for sample i
ik : variance of attribute j for sample i
] , [ak ak
: interval number
3.3 Research activity
Figure 3.1.Flowchart of the research methodology
3.3.1 Data collection and data preparation
This study used a real statistical data of Malaysian rubber industry which has been collected from the Malaysian Rubber Board. The Malaysian Rubber Board was established as to assist in the development and modernisation of the Malaysian rubber industry in all aspect. It also provides Malaysian rubber historical data which is published to public. As for this study, 13 years of statistical rubber data is been selected from the year 2000 until 2012.
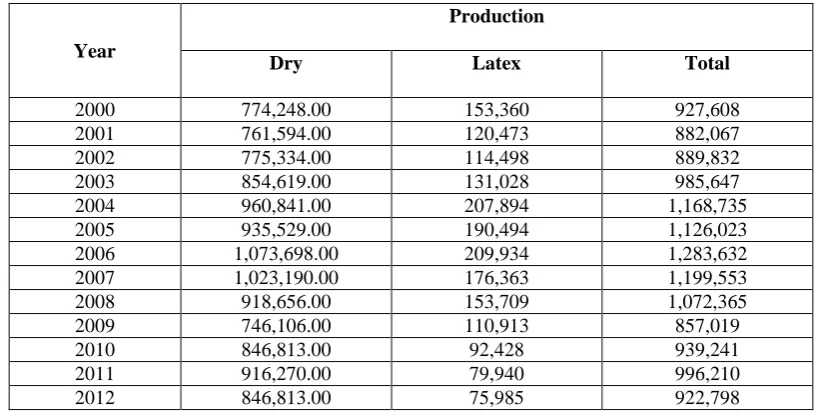
Other than rubber data, this study also uses Malaysian paddy data as second dataset. The statistical data Malaysian paddy industry is acquired from the Malaysian Department of Agriculture. The data that is been selected is from the year 2006 until 2011. Table 3.1 shows the selected parameter for the rubber dataset and paddy dataset. The two datasets were selected to demonstrate the applicability of fuzzy random regression approach to simultaneously improve coefficient estimation and treat fuzzy random uncertainties. The sample of rubber and paddy dataset is shown in Table 3.2 and Table 3.3, respectively.
Data Collection and Data Preparation
Estimating model‘s coefficient
Result and Analysis Start
Fuzzy regression Fuzzy random regression
Table 3.1: Selected parameter for the rubber dataset and paddy dataset
Datasets Industry
Rubber Paddy
Parameter Natural rubber production Planted area
Number of companies provided Employment in the rubber sector Natural rubber consumption.
Paddy production Rice production Planted Area
[image:30.595.123.533.306.514.2]Average yield of paddy Total apparent consumption
Table 3.2: Sample of rubber dataset (Malaysian Rubber Board, www.lgm.gov.my)
Year
Production
Dry Latex Total
2000 774,248.00 153,360 927,608
2001 761,594.00 120,473 882,067
2002 775,334.00 114,498 889,832
2003 854,619.00 131,028 985,647
2004 960,841.00 207,894 1,168,735
2005 935,529.00 190,494 1,126,023
2006 1,073,698.00 209,934 1,283,632 2007 1,023,190.00 176,363 1,199,553
2008 918,656.00 153,709 1,072,365
2009 746,106.00 110,913 857,019
2010 846,813.00 92,428 939,241
2011 916,270.00 79,940 996,210
[image:30.595.126.533.566.687.2]2012 846,813.00 75,985 922,798
Table 3.3: Sample of paddy dataset (Department of Agriculture, www.doa.gov.my)
Year
Production
Paddy Rice Total
3.3.2 Estimating model coefficient
The main purpose in this dissertation methodology is to estimate the coefficient values for the selected statistical data. The dataset for the respective parameters were listed in Table 3.1. For the rubber industry, data were collected for rubber production, number of companies, planted area, number of employment and natural rubber consumption. Meanwhile, the data collected in paddy industry are paddy and rice production, planted area, average yield and number of consumption.
Even though the data containing in the table (i.e. Table 3.2 and Table 3.3) is presented in crisp and precise value, however it may inherently contain fuzziness and randomness. Fuzziness in the data is captured whenever the crisp values may represent some interval; shows flexibility. The data entry errors may also contributes to the fuzzy information, whereby the entered data has some imprecision. On the other hand, the statistical industrial data is presenting cumulative value of national level yield. The data is actually a collection from a city, district, state and so on. It makes the distribution of the data is randomly obtained from several sources to form the collective figures. The above mentioned situation explains that the statistical data in contains simultaneous fuzzy random information. A treatment to this situation of data is necessary to retain the actual meaning of those imprecision and the treatment is sufficiently performed.
Determining coefficient or weight value is important to set up the programming model for production planning and to ensure the developed model will not produce misleading result. However, the difficulties in obtaining the model attribute‘s coefficient may cause problem and the decision of coefficient or weight value is crucial to the model‘s result. Furthermore, the existence of fuzzy random variable in the statistical data also should be considered due to the incapability of conventional method to handle these uncertainties. Therefore, the fuzzy random regression is proposed in this study as to estimate the model‘s coefficient under a hybrid fuzzy random environment. The calculation of fuzzy random regression as to estimate the coefficient is based on the model (3.1).
3.3.3 Result and analysis
The proposed method fuzzy random regression in this study is demonstrated to determine the coefficient values from the statistical data. The process of analysis is been done to analyse the outcome from the fuzzy random regression model. The coefficient values deduced from fuzzy random regression is a confidential interval which is in the form of close interval[ak,ak]where a is the weight attribute. Meanwhile, the coefficient value deduced from fuzzy regression is in the form of
] ,
[ai hi where ai is the central value andhi is the spread of the weight attribute. The outcomes from the demonstration was now analysed in order to determine the decision factor or attribute which has higher coefficient; shows the significant. The larger value of coefficient shows the more significant of the factor towards the evaluation. On the other hand, the estimated coefficient also is useful to develop production planning model and to predict the future outcome of the rubber and paddy production.
3.4 Application of methods
3.4.1 Fuzzy regression
Fuzzy regression algorithm to estimate the coefficient is as follows:
Step 1: Developing fuzzy regression model for estimation 1.1 Eliciting the lower boundary and upper boundary
Determine the lower boundary axjt h|xj |t, centre axjtand upper boundaryaxjt h|xj |t. A sample(yj,xj),
n
j 1,2,, is defined for the total evaluation with centreyj, spread dj as a fuzzy numberyj yj,dj based on Equation (2.2).
1.2 Estimating the attribute‘s coefficient
Set regression model as the Equation (2.4) to estimate coefficient.
Step 2: Decision-making and analysis
The estimated coefficient will be deduced by fuzzy regression. The coefficients is in the form of [ai,hi] are obtained (2.4) where a is the centre and h is the spread. Whenever the spread is 0, it is understood that the non-fuzzy value is concerned. The larger value of coefficient shows the more significant of the factor towards the total evaluation.
3.4.2 Fuzzy random regression
Fuzzy random regression algorithm to estimate the coefficient is as follows:
Step 1: Eliciting the confidence interval
Compute the confidence interval of each fuzzy random by inducing the expected value and variance of fuzzy random variable to construct the one-sigma confidence interval, I[eX ,X ].
1.1 Calculate the expected value E[X] of triangular fuzzy random variable X according to the Definition 2.3 and Equation (2.6).
Step 2: Estimate the coefficient
Construct fuzzy random regression analysis to estimate the coefficient. Let
A
k denote an attribute for k1,...,K and Y*j is thetotal evaluation for j1,...,n, where n is the number of candidate alternatives to be evaluated. A fuzzy random regression model is described as follows:
,K , k ,n , j e a e y e a e y a a a a A J K k X X k Y Y l j K k X X k Y Y r j k k K k k k j j j j j j j j ; 1
1 , ) ( , ) ( , : subject to 1 1 1 A 1 1 1 1
min (3.1)Step 3: Decision-making and analysis
The coefficients [ak,ak] are obtained from fuzzy random regression model (3.1). The lower boundary ak and upper boundary ak shows the flexibility of the coefficient values which is included during estimation.
From the stated algorithm, regression approach is structured in two common steps which is data model preparation and result analysis for both fuzzy and fuzzy random situation. The weight estimated by both model was then useful to develop forecasting model for fuzzy and fuzzy random circumstances.
3.5 Implementation of the proposed method
REFERENCES
Abdollahzadeh, S., Rezaei, M., Dabbaghian, M., & Norouzi, A. (2010). A goal programming model for computation of fuzzy linear regression with least error.In Computer Engineering and Technology (ICCET), 2010 2nd International Conference on, 493.
Nureize, A. and Watada, J. (2008). A fuzzy regression approach to
hierarchical evaluation model for oil palm grading. In Industrial Engineering and Engineering Management, 2008. IEEM 2008. IEEE International
Conference on, 486-490.
Nureize, A. and Watada, J. (2010). A fuzzy regression approach to a hierarchical evaluation model for oil palm fruit grading. Fuzzy Optimization and Decision Making, 9(1), 105-122.
Nureize, A. and Watada, J. (2011). Multi-level multi-objective decision
problem through fuzzy random regression based objective function. In Fuzzy Systems (FUZZ), 2011 IEEE International Conference on, 557-563.
Beichelt, F. (2010). Stochastic processes in science, engineering and finance. CRC Press.
Booker, J. M., & Ross, T. J. (2011). An evolution of uncertainty assessment and quantification. Scientia Iranica, 18(3), 669-676.
Chang, O. & Ayyub, M. (2001). Fuzzy regression methods–a comparative assessment. Fuzzy sets and systems, 119(2), 187-203.
Couso, I., Dubois, D., Montes, S., & Sánchez, L. (2007). On various definitions of the variance of a fuzzy random variable. In Fifth International Symposium on Imprecise Probabilities: Theory and Applications (ISIPTA 07) Prague (Czech
Republic),135-144.
Daño, E. C., & Samonte, E. D. (2005). Public sector intervention in the rice industry in Malaysia. State intervention in the rice sector in selected countries: Implications for the Philippines.
Fahmi, Z., Samah, B. A., & Abdullah, H. (2013). Paddy Industry and Paddy Farmers Well-being: A Success Recipe for Agriculture Industry in Malaysia. Asian Social Science, 9(3), 177.
Chertow, G. M., Lazarus, J. M., Lew, N. L., Ma, L., & Lowrie, E. G. (1997).
Development of a population-specific regression equation to estimate total body water in hemodialysis patients. Kidney international, 51(5), 1578-1582. Van Huffel, S., & Vandewalle, J. (1987). Algebraic relationships between classical
regression and total least-squares estimation. Linear Algebra and its Applications, 93, 149-160.
Haneveld, W. K., & Stegeman, A. W. (2005). Crop succession requirements in agricultural production planning. European Journal of Operational Research,
166(2), 406-429.
Höppner, F., & Klawonn, F. (2003). Improved fuzzy partitions for fuzzy regression models. International journal of approximate reasoning, 32(2), 85-102. Itoh, T., Ishii, H., & Nanseki, T. (2003). A model of crop planning under uncertainty
in agricultural management. International Journal of Production Economics, 81, 555-558.
Jackson, J. R., & Grossmann, I. E. (2003). Temporal decomposition scheme for nonlinear multisite production planning and distribution models. Industrial & Engineering Chemistry Research, 42(13), 3045-3055.
Kwakernaak,(1978). Fuzzy random variables—I. Definitions and theorems.
Information Sciences, 15(1), 1-29.
Kwakernaak,(1979). Fuzzy random variables—II. Algorithms and examples for the discrete case. Information Sciences, 17(3), 253-278.
Liu, B. (2012). Why is there a need for uncertainty theory. Journal of Uncertain Systems, 6(1), 3-10.
López-Diaz, M., & Gil, M. A. (1997). Constructive definitions of fuzzy random variables. Statistics & probability letters, 36(2), 135-143.
Gil, M. Á., López-Díaz, M., & Ralescu, D. A. (2006). Overview on the development of fuzzy random variables. Fuzzy sets and systems, 157(19), 2546-2557. Sakawa, M., & Yano, H. (1992). Fuzzy linear regression analysis for fuzzy input-
Messac, A., Batayneh, W. M., & Ismail-Yahaya, A. (2002). Production planning optimization with physical programming. Engineering optimization, 34(4), 323-340.
Montgomery, D. C., Peck, E. A., & Vining, G. G. (2012). Introduction to linear regression analysis (821). Wiley.
Näther, W. (2006). Regression with fuzzy random data. Computational Statistics & Data Analysis, 51(1), 235-252.
Pasha, E., Razzaghnia, T., Allahviranloo, T., Yari, G., & Mostafaei, H. R. (2007). Fuzzy linear regression models with fuzzy entropy. Applied Mathematical Sciences, 1(35), 1715-1724.
Puri, M. L., & Ralescu, D. A. (1986). Fuzzy random variables. Journal of mathematical analysis and applications, 114(2), 409-422.
Ramli, N. N., Shamsudin, M. N., Mohamed, Z., & Radam, A.(2012). Impact of Price Support Policy on Malaysian Rice Industry.
Wang, R. C., & Fang, H. H. (2001). Aggregate production planning with multiple objectives in a fuzzy environment. European Journal of Operational Research, 133(3), 521-536.
González-Rodríguez, G., Blanco, Á., Colubi, A., & Lubiano, M. A. (2009).
Estimation of a simple linear regression model for fuzzy random variables.
Fuzzy Sets and Systems, 160(3), 357-370.
Pastor, R., Altimiras, J., & Mateo, M. (2009). Planning production using
mathematical programming: the case of a woodturning company. Computers & Operations Research, 36(7), 2173-2178.
Graves, S. C. (1999). Manufacturing planning and control. Handbook of applied optimization, 728-746.
Shapiro, A. F. (2005). Fuzzy regression models. Article of Penn State University. Song, K. B., Baek, Y. S., Hong, D. H., & Jang, G. (2005). Short-term load
forecasting for the holidays using fuzzy linear regression method. Power Systems, IEEE Transactions on, 20(1), 96-101.
Griffiths, T.L., and Tenenbaum, J.B. (2011) Predicting the future as Bayesian
inference: People combine prior knowledge with observations when estimating duration and extent. 140(4), 725-743.
Watada, J., Wang, S., & Pedrycz, W. (2009). Building confidence-interval-based fuzzy random regression models. Fuzzy Systems, IEEE Transactions on, 17(6), 1273-1283.
Watada, J. (2011, April). Building models based on environment with hybrid
uncertainty. In Modeling, Simulation and Applied Optimization (ICMSAO), 2011 4th International Conference on, 1-10.
Cave, W.C. (2011). Prediction Theory for Control System.
Yang, M. S., & Ko, C. H. (1997). On cluster-wise fuzzy regression analysis. Systems, Man, and Cybernetics, Part B: Cybernetics, IEEE Transactions on, 27(1), 1-13.
Yang, L., & Gao, J. (2010, May). Characteristic Functions of Fuzzy Random
Variables. In Computational Science and Optimization (CSO), 2010 Third International Joint Conference on (145-149).
Zadeh, L. A. (2002). Toward a perception-based theory of probabilistic reasoning with imprecise probabilities. Journal of statistical planning and inference, 105(1), 233-264.
Zadeh, L. A. (2008). Is there a need for fuzzy logic?Information Sciences, 178(13), 2751-2779.
Natural Rubber Statistic. Retrieved September 1, 2013 from http://www.lgm.gov.my
Rubber-based industry. Retrieved on October 10, 2013 from http://www.mida.gov.my
Malaysian Rubber Export Promotion Council. Retrieved on October 10, 2013 from http://www.mrepc.gov.my
Market Watch 2012. The Rubber Sector in Malaysia Retrieved October 22, 2013 from http://www.malaysia.ahk.de
Rubber Journal Asia. Malaysian rubber industry in competitive mode. Retrieved on October 22, 2013 from http://rubberjournalasia.com
Department of Agriculture. Paddy Statistic. Retrieved on October 24, 2013 from http://www.doa.gov.my
Rubber industry in recovery stage. Retrieved on November 1, 2013 from http://www.btimes.com.my