© 2017, IRJET | Impact Factor value: 5.181 | ISO 9001:2008 Certified Journal | Page 1265
Smart City Based on IoT
C.M.Gaikwad¹, A.A.Jadhav², N.N.Suryawanshi³, P.P.Farakate
4Assistant Professor, SETI, Panhala11
UG Student, SETI PANHALA 2, 4, 3
---***---Abstract
- Population increasing day to day due to increasing population creates many problems like air pollutions, water pollution, traffic congestion, and continuous use of non renewable energy sources (petrol, LPG gas) .The main objective of the system to save the environment. To reduce above problems and to save the environment describes the specific characteristics of smart city IoT. Such that the system manages traffic congestion, water management, air pollution. In propose system develop by using Raspberry pi, image processing, VB, sensors. In traffic congestion system will observe LIVE road situation, pit detection, traffic monitoring, accident detection, and CO2 level in air and display the message to citizen and government authority. Use renewable energy sources like (Solar, Wind, and Biogas) for generates pollution free energy .This energy utilize for street light, traffic signal and in garden. By using waste material produce biogas. It utilize for the apartment for cooking and many other thing.Key Words: Raspberry Pi, GSM,
1.INTRODUCTION
The proposed system design by using Raspberry pi, image processing, sensors, GSM, SQL Server and VB software. Raspberry pi is a heart of a system. Which interfacing between sensors and data base. Raspberry pi camera module to take high definition video as well as stills photography. The camera module will capture the snap of LIVE situation update to data base (image processing).
The temperature sensors (LM35) and CO2 (MCQ6) sensors are placed on the poll of traffic signal and it gives updates of temperature and CO2 level to database through the GSM. The Raspberry pi gives this information to the mobile app and data base through GSM(SIM900).
In database management systems are in charge of storing the large amount of information produced by IoT peripheral nodes such as sensors.
Street light: It is the leaf part of the system where IoT nodes are placed. Each streetlight is geographically localized on the city map and uniquely associated to the IoT node attached to it, so that IoT data can be enhanced with context information. The monitoring of the correct operation of the bulbs is performed through photometer sensors.
2. PROPOSED SYSTEM
2.1 Technical Details:
Chart -1: -System Block Diagram
The chart-1 gives the general description of system block diagram in which each block has following description. This system divided into main 3 sections as follows:
INPUT: In which all the sensors are present and senses the appropriate value .This sensed value is then passed to the main processing unit i.e. Raspberry pi.
MAIN PROCESSING UNIT: Which includes Raspberry pi .Raspberry pi having the more rang of memory. it also having extra onboard features on board. It’s a mini computer.
OUPUT: In this section two part consist are
o VB DATA BASE
o MOBILE ANDROID APP
© 2017, IRJET | Impact Factor value: 5.181 | ISO 9001:2008 Certified Journal | Page 1266
2.1.1Camera
In this section camera will capture the snap of recent conditions of congestion and pits on the street. Then send captured snap to raspberry pi for further operation
2.1.2Temperature sensors
We will measure the temperature in the atmosphere by using the temperature sensors. Its ranges from -0.50c to
+0.50c.Temperature sensors will sense the temperature on
the street. If temperature goes below +0.50cthen it will
inform to raspberry pi for further operation.
2.1.3Water level sensors
In this section two conductor pipes as a water level sensors. One conductor is placed at the lower side and another at higher side of street, When water level goes above the higher side of conductor then it will generate some amount of electricity due to this conductor acts as a switch and it will inform to raspberry pi.
2.1.4Raspberry pi:
The Raspberry pi is a series of credit cared –sized single-board computers. Which includes an ARM compatible central processing unit (CPU)and an on chip graphics (GPU,a VideoCore IV).CPU speed ranges from 700MHz to 1.2GHz for the Pi3 and on board memory range from 256 MB to1GB RAM. Secure Digital SD cards used to store the operating system. Most boards have between one and four USB slots and composite video output, and a3.5 mm phone jack for audio, In this project raspberry pi is used to processing the data.
2.1.5Display:
LCD (liquid crystal display) screen is an electronic display model and find a wide range of applications. A 16*2 LCD displays is very basic module and is very commonly used in various devices and circuits. A 16*2 LCD means it can display 16 characters er line and there are 2 such lines. In this display is used to show the current condition of road to peoples who present there.
2.1.6GSM:
GSM is a mobile communication modem; it is stand for global system for mobile communication (GSM).It is widely used for mobile communication system in the world ,GSM is an open and digital cellular technology used for transmitting mobile voice and data services operates at the 850MHz.900MHz,1800MHz and 1900MHz frequency bands, GSM system was developed a a digital system using time division multiple access (TDMA) technique for communication purpose. In this project GSM is used to communicate wirelessly with the VB server of computer
2.1.7VB based server:
The server has the all the data related to air pollution and traffic condition with time and area
information. The server can be used to the enquiry done by the server.
2.1.8Android Mobile App:
Here we are developing an android app. This is a user node, which is used to upload as well as download the data from server. The user can upload information such as Traffic density high/Low/Medium),Road closed or Blocked, traffic Jams etc. Along with time and his name and Area name via SMS.The server has Visual Basic software with a access Database. The VB software will update the database sent by the user via Android APP. When someone sends an enquiry, SMS he just has to type the area name and he will get all the info uploaded to the server.
2.1.9MATLAB based PIT detection:
Here we are using image processing to detect the road condition .s soon as the MATLB software detects any pits the users are informed via SMS.
3 SYSTEM REQUIREMENT ANALYSIS
The main aim of the purposed system is save the environment. System is based on IoT. In IoT implements various ideas and applications. All those various ideas and application built in single app. This app is useful for every citizens and government authority. This purpose system mobile app is maintain all data like water level ,air pollution, traffic congestion, road conditions for the specific area. In Fig.3.1 shows, the exact flow of the system .When system is starts initialization of the system is started then data is collected from different sensors .This collected data then start compare with the pervious data collect from different sensors .When rang changes data base is updates and informs to respective authorized person and the also requesting citizens through android app.
Waste Management: Waste management is a primary issue in many modern cities. The use of intelligent waste containers, which detect the level of load and allow for an optimization of the collector trucks route, can reduce the cost of waste collection and improve the quality of recycling. To realize such a smart waste management service, the IoT shall connect the end devices, i.e., intelligent waste containers, to a control center where optimization software processes the data and determines the optimal management of the collector truck fleet.
Traffic Congestion: IoT consists in monitoring the traffic congestion in the city. Even though camera-based traffic monitoring systems are available. Traffic monitoring may be realized by using the sensing capabilities and GPS installed on modern vehicles and adopting a combination of air quality and acoustic sensors along a given road. This information is of great importance for city authorities and citizen.
© 2017, IRJET | Impact Factor value: 5.181 | ISO 9001:2008 Certified Journal | Page 1267 pollution sensors be deployed across the city and that the
sensor data be made publicly available to citizens. This is helpful for increase in the use of renewable.
Noise Monitoring: Noise can be seen as a form of acoustic pollution as much as carbon oxide (CO) is for air. In that sense, the city authorities have already issued specific laws to reduce the amount of noise in the city centre at specific hours. An urban IoT can offer a noise monitoring service to measure the amount of noise produced at any given hour in the places that adopt the service.
Fig.3.1sensors changes value flow graph
The market springs from the synergic interconnection of key industry and service sectors, such as smart governance, smart mobility, smart utilities, smart buildings and smart environments. The services provided like water level controller, temperature sensors, pollution sensors, image processing these services have number of application .The water level controller it is a single application use in various way at the time of rainy season due to heavy rain fluid condition are possible that time water level controller alert system about the water level. We can also used in underground water tunnels, water tanks, drange pipes ,water pipeline system and also we can use water level controller as liquid level indicter in food industries. Camera module with image processing gives LIVE situation on the main system which is helpful for traffic management, accident reorganization and pit detection on road. We can also understand the exact situation on road for informing message to citizens. It’s monitoring the traffic congestion in the city. This information is of great importance for city authorities and citizens for the former to disciple traffic and
to send officers where needed and which gives the other road.
The project is based on smart city. The various ides and applications we can used very smarty on only single app. everyone has an updates of data. It’s useful because of single water level can provide no of services. The project is save the environment damage due to human pollution. Solar panels, wind mills, rain water harvesting. The sun is biggest sours of energy; by using the natural resources of energy we can generate the clean energy & reduce pollution.
Water is very essential thing for human. Due to water level controller we can manage the water supply, like when water level above the critical level system will alert to block the road and suggest the other way to travel. Similarly we can use this application in underground water pipe line, when the pipe line is over flow or damage the system will give message to stop the water supply. Because of this we can save the water as well as overcome unpredictable conditions generated in rainy season.
© 2017, IRJET | Impact Factor value: 5.181 | ISO 9001:2008 Certified Journal | Page 1268 images are stored into the database and then compared with
each other. When pit will detected then this will inform to the authorized person like municipal officer, respective area engineer supervisor and respective area representative. Which will able to take action to recover the problem.This stored images on the road, which will also useful for the police to find the thief’s and other respective search. The stored data is useful for defense or police departmental to grab the thief.
4.
SYSTEM DESIGN & IMPLEMENTATION
The system will divided into main three parts that is input section, main processing unit, output section .The sensors at the input side will sense the temperature, water, CO2 and camera will take the snap and gives the LIVE
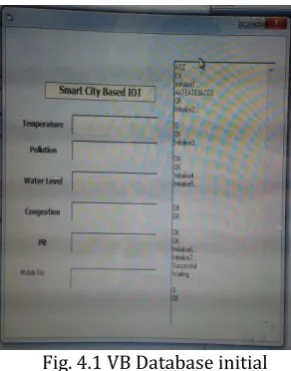
[image:4.595.366.502.247.469.2]updates to the system. The all collected data which will stored into the database. The database is in the VB.
Fig. 4.1 VB Database initial
[image:4.595.89.235.310.496.2]Fig.4.1 shows the VB data base initial satage.they also shows the congestion on the road .The all values which shows in the Fig 4.2
Fig. 4.2 VB Database Update
Fig. 4.3 Mobile app initial
Fig .4.4 Mobile App Update
[image:4.595.85.238.536.705.2]© 2017, IRJET | Impact Factor value: 5.181 | ISO 9001:2008 Certified Journal | Page 1269 Fig.4.5 Image Processing of Normal Road
Fig.4.6 Image Processing of Traffic Congestion
Fig.4.7. Water level, CO2, Temp. on Server
5 CONCLUSION
In this paper, we analyzed the solutions currently available for the implementation of urban IoT. The discussed technologies are close to being standardized, and industry players are already active in the production of devices that take advantage of these technologies to enable the applications of interest. The range of design options for IoT systems is rather wide; the set of open and standardized protocols is significantly smaller. The enabling technologies, furthermore, have reached a level of maturity that allows for the practical realization of IoT solutions and services, starting from field trials that will hopefully help clear the uncertainty that still prevents a massive adoption of the IoT paradigm. Taking everything into account, the Internet of Things is closer to being executed than the normal individual would think. A dynamic methodology has been proposed in this paper to handle the issue of traffic congestion and location also the pits on the road by utilizing the innovations of Internet of Things in most effective way and to minimize the mischance and human misfortunes all things considered. This paper additionally gives brief knowledge into the innovations that can be put to use to decrease holding up time to avert movement blockage and to give the activity control room with the latest data about the movement development.
ACKNOWLEDGMENT
We would like to thank the staffs at Aster Adhar Hospital Kolhapur, India & Dr. Anand Kulkarni (MD) for their help with patient data collection.
REFERENCES
[1] Cisco Visual Networking Index. (2014, Feb.). Global mobile datatraffic forecast update, 2012–2019, CISCO, San
Francisco, CA, USA,White Paper. [Online]. Available: http://www.cisco.com/c/en/us/solutions/collateral/
service-provider/visual-networking-index-vni/white_paper_c11-520862.pdf
[2] L. Varshney, “Transporting information and energy simultaneously,” in Proc. IEEE ISIT, 2008, pp. 1612–1616.
© 2017, IRJET | Impact Factor value: 5.181 | ISO 9001:2008 Certified Journal | Page 1270 [4]IEEE Standard for Local and Metropolitan Area
Networks—Part 15.4: Low-Rate Wireless Personal Area Networks (LR-WPANs), IEEE Standard802.15.4-2011.
[5] IEEE 802.15 WPAN Task Group 4e (TG4e), IEEE Standard 802.15.4b, 2014.
[6] Sahani, M., Rout, S.K., Sharan, A.K., Dutta, S. real time color image enhancement with a high regard for restoration of skin color by using raspberry pi Communications and Signal Processing (ICCSP), 2014 International Conference IEEE.
[7] ] IEEE Communications Society, P1901.2-2013— Standard for Low Frequency(less than 500 kHz) Narrow Band Power Line Communications for Smart Grid Applications, IEEE Standard P1901.2-2013.
BIOGRAPHIES
Chetan Gaikwad received the B.E. degree in Electronics and Telecommunication and M.E. degree in Electronics from Shivaji University, Kolhapur, India. He joined as Assistant Professor in AMGOI Vathar where he taught Network Analysis subject. Presently working in Sanjeevan Engineering and Technology Institute where he handled Microprocessors & Digital Electronics subjects.
Nilesh N. Suryawanshi is Final Year Student of B.E in Electronics and Telecommunication from Sanjeevan Engineering and Technology Institute Panhala Maharashtra India. Also Received Diploma in Electronics & Telecommunication from Y.D. Mane Institute of Technology Kolhapur, Maharashtra INDIA.
Aniket A. Jadhav is Final Year Student of B.E in Electronics and Telecommunication from Sanjeevan Engineering and Technology Institute Panhala Maharashtra India. Also Received Diploma in Electronics & Telecommunication from D.Y. Patil Polytechnic Kolhapur, Maharashtra India.