R E S E A R C H
Open Access
Transcriptome analysis of human tissues and cell
lines reveals one dominant transcript per gene
Mar Gonzàlez-Porta
1, Adam Frankish
2, Johan Rung
1, Jennifer Harrow
2and Alvis Brazma
1*Abstract
Background:RNA sequencing has opened new avenues for the study of transcriptome composition. Significant evidence has accumulated showing that the human transcriptome contains in excess of a hundred thousand different transcripts. However, it is still not clear to what extent this diversity prevails when considering the relative abundances of different transcripts from the same gene.
Results:Here we show that, in a given condition, most protein coding genes have one major transcript expressed at significantly higher level than others, that in human tissues the major transcripts contribute almost 85 percent to the total mRNA from protein coding loci, and that often the same major transcript is expressed in many tissues. We detect a high degree of overlap between the set of major transcripts and a recently published set of alternatively spliced transcripts that are predicted to be translated utilizing proteomic data. Thus, we hypothesize that although some minor transcripts may play a functional role, the major ones are likely to be the main
contributors to the proteome. However, we still detect a non-negligible fraction of protein coding genes for which the major transcript does not code a protein.
Conclusions:Overall, our findings suggest that the transcriptome from protein coding loci is dominated by one transcript per gene and that not all the transcripts that contribute to transcriptome diversity are equally likely to contribute to protein diversity. This observation can help to prioritize candidate targets in proteomics research and to predict the functional impact of the detected changes in variation studies.
Keywords:splicing, transcriptome, gene expression, RNA-seq
Background
Although there are fewer than 22,000 protein coding genes known in the human genome, they are transcribed into over 140,000 different transcripts (Ensembl release 66 [1]), over 65% of which have protein coding potential and thus may contribute to protein diversity. Recently, applications of high throughput sequencing to RNA, known as RNA-seq [2], have opened new avenues for the study of transcriptome composition [3]. RNA-seq is based on sequencing short fragments, thus making the precise reconstruction of full-length transcripts a difficult task; nevertheless, several methods have been developed to deconvolute transcript abundance [4-6]. Significant evidence has accumulated showing that approximately
95% of multiexon genes have more than one alternative splice-form expressed (for example, [4,7-9]) and that transcript expression is regulated [10,11]. On the other hand, focusing on EST data, Taneriet al.[12] predicted that there is a single dominant transcript per gene in pri-mary tissues. Recently, the ENCODE project [13] showed that indeed, in cell lines most genes have a major tran-script, although at the same time noted that‘genes tend to express many transcripts simultaneously, and as the number of annotated transcripts per gene grows, so does the number of expressed transcripts’. However, despite these observations, it is still not clear if and to what extent major transcripts are dominating the transcrip-tome and what proportion of the transcript diversity is likely to contribute to protein diversity. In addition, given the notable differences in gene expression between pri-mary tissues and cell lines [11,14], transcriptome analysis in cell lines can be extended to primary tissues only to some extent.
* Correspondence: [email protected]
1European Molecular Biology Laboratory - European Bioinformatics Institute,
EMBL-EBI, Wellcome Trust Genome Campus, Hinxton, Cambridge, CB10 1SD, United Kingdom
Full list of author information is available at the end of the article Gonzàlez-Portaet al.Genome Biology2013,14:R70 http://genomebiology.com/2013/14/7/R70
Here we intend to characterise the potentially coding transcriptome from a functional perspective. By focusing on protein coding genes, we show that in primary tissues almost 85% of the total mRNA from protein coding loci comes from major transcripts (76% in cell lines). It is important to highlight that these major transcripts are not always the longest possible for the gene (40% of the major transcripts in primary tissues and 30% in cell lines are not the longest annotated), nor always include the longest CDS (Coding DNA Sequence; approximately 50% of the cases in both tissues and cell lines). For instance, we iden-tified theAESgene (amino-terminal enhancer of split), for which we detect a ubiquitous major transcript that is shorter than the current reference. We also show that the ratio of the number of expressed transcripts to genes in primary tissues is on average 1.12 (that is, just over one transcript per gene). We further distinguish between: (1) major transcripts - the transcript with the highest expression level within a given gene; and (2) dominant transcripts - a major transcript that is expressed at a con-siderably higher level than any minor transcripts of the gene. We show that most protein coding genes in most conditions have one dominant transcript, for example, for almost 80% of the expressed genes in primary tissues the major transcript is at least twice as abundant as the next one.
We further observe that about half of the ubiquitously
expressed genes (n= 4,801) have the same major
tran-script across all the 16 tissues studied here. We do, how-ever, detect switch events for approximately 35% of the genes, where the dominant and minor transcripts switch between different tissues, while the total expression level of the gene changes comparatively little. In around 100 genes we observe such a strong change that we can hypothesise that the different transcripts are likely to be translated into different proteins. One example is theMBP gene (Myelin Basic Protein), which is a major protein con-stituent of the myelin sheath. A shorter brain specific form has been detected by this analysis and has been high-lighted recently in the literature [15]. Finally, we observe that for almost 20% of the studied protein coding genes (n= 18,450) the major transcript does not code for a pro-tein, and this percentage is considerably higher in nucleus than in cytosol. Half of the noncoding major transcripts can be explained by a retained intron, typically located towards the 3’-end of the transcript.
We perform the analyses using three different computa-tional methods [4-6], and addicomputa-tionally, where sufficient coverage exists, we assess the alternative transcript abun-dances directly from the reads spanning unique exon junc-tions. We also use simulated data [16] to confirm that the methods can reliably distinguish between two hypothetical alternative scenarios - one dominant transcript per gene vs. several transcripts per gene expressed to similar levels.
All those methods produce a consistent outcome, indicat-ing robustness of the conclusions presented here.
Overall, our results show that, despite of the diversity of the transcriptome, most protein coding genes have one dominant transcript, which, when combined, com-prise most of the potentially coding mRNA transcrip-tome. Correlation between transcriptome and proteome is not straightforward, with the best estimates pointing at a range of 58% to 63% correlation [17]. However, the strong overlap with a set of isoforms that are indepen-dently predicted to be translated into proteins, together with the clear separation in expression levels between major and minor transcripts, add support to the hypoth-esis that the dominant transcripts are likely to be the main contributors to the proteome. Thus, our findings may help proteome analysis by prioritising the candidate proteins that are more likely to be present in a given sample. At the same time, identification of changes in the major transcript across conditions can lead to rele-vant clinical findings (for example, [18]) and may also be used to predict the functional impact of the detected changes in variation studies. Nevertheless, this does not imply that all minor transcripts do not have a biological function, since some may still be translated into proteins [19] or have a regulatory function as mRNAs [20].
Results and discussion
Here we quantify and analyse the overall contribution of major transcripts to the potentially coding mRNA tran-scriptome, in comparison to minor transcripts. The datasets analysed comprise 16 primary human tissues - Illumina Body Map dataset (BM), further referred to as tissue data -and 5 ENCODE cell lines, including different cellular com-partments (whole cell, cytosol and nucleus) - further referred to as cell line data (see Methods).
Most protein coding genes express one dominant transcript
First, examining only the tissue data, and similarly to pre-vious RNA-seq-based transcriptome studies, we detect more than one transcript for approximately 85% of the studied genes (83.70% to 89.95%, SD = 1.84, Additional File 2 - Table S1) and a total of 105,456 different tran-scripts in at least one tissue, which corresponds to
approximately 90% of the studied transcripts (n =
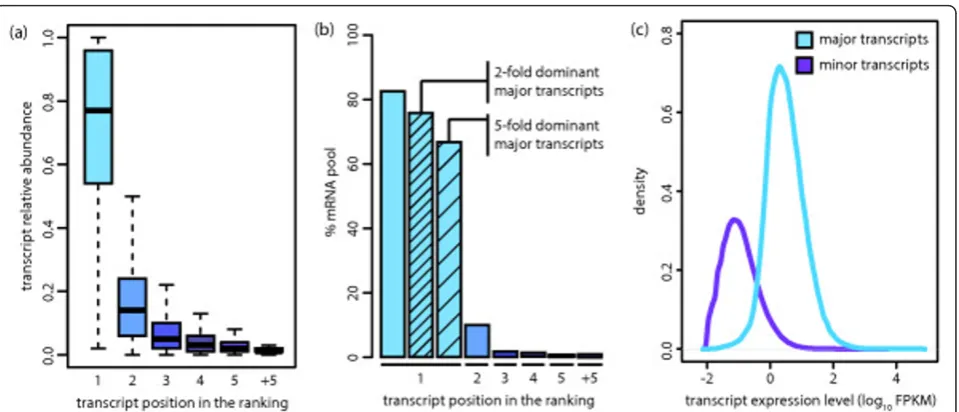
where all the different transcripts are under similar tran-scriptional control and where most differences in their abundance can be attributed to alternative splicing (AS; Additional File 1 - Figure S4). In the same line, we observe that the ratio of the number of expressed tran-scripts to genes in primary tissues is 1.12 (0.98-1.40, SD = 0.11; Additional File 2 - Table S2). Finally, we find that in the studied samples approximately 85% (79.98% to 86.49%, SD = 2.17) of the mRNA pool from protein cod-ing loci is comprised exclusively of major transcripts (Figure 1b and Additional File 2 - Table S3). In order to address the impact of our observations at the protein level, we plotted the distribution of expression levels for both major and minor transcripts (Figure 1c) and observed that minor transcripts tend to be expressed below 1 FPKM, a threshold that has been suggested as the minimum expression required for protein detection [21-23]. In addition, we calculated the overlap of our major/minor transcript predictions with those obtained from an independent study to assess which transcripts are likely to be translated into proteins and detected a higher overlap for major transcripts (see Additional File 4 - Supplementary Results).
We quantified transcript dominance by calculating for every gene the ratio of the expression levels between the major transcript and the second most abundant one (Additional File 1 - Figure S4). Overall, we found that in the studied tissues, 79% of the genes (74.21% to 81.94%, SD = 2.16) have a two-fold dominant major transcript (that is, expressed twice as much as the second most
[image:3.595.60.540.87.293.2]abundant one), and that for 56% of the genes (43.39% to 61.60%, SD = 3.50) the major transcript is five-fold domi-nant (Table 1 and Additional File 2 - Table S4). This indi-cates that for most genes in a given sample there is one dominant transcript. We estimate that dominant transcripts account for most of the studied mRNA pool - 76.69% (70.04% to 80.74%, SD = 3.48) for a two-fold dominance and 67.47% (59.97% to 73.83%, SD = 4.81) for a five-fold dominance (Figure 1b). GO enrichment analysis of genes that consistently express a five-fold dominant transcript across the 16 tissues in the tissue dataset indicated that they are functionally involved in cellular respiration, protein transport, transcription and transcription regulation (Addi-tional File 2 - Table S5). We also calculated the fraction of dominant major transcriptsvs. non-dominant ones for dif-ferent FPKM thresholds on total gene expression. The pro-portion of dominant major transcripts increases with Figure 1Most protein coding genes express one predominant transcript. (a) Relative abundance of the subset of transcripts in each position of the ranking for the primary tissues dataset. For each gene, transcripts were ranked based on their relative abundances. There is generally one predominant transcript over the rest.(b) Percentage of the studied mRNA pool explained by each category of transcripts for the BM dataset. The mean percentage for all samples is represented here. Major transcripts represent approximately85% of the studied mRNA population and were further classified intotwo-fold andfive-fold dominant. (c) Expression distribution for major and minor transcripts in the tissue dataset. We detect a total of 31,902 transcripts expressed above 1 FPKM in at least one tissue and 26,641 different major transcripts.
Table 1 Major transcripts tend to be predominantly expressed.
Expressed genes
Genes with a dominant major transcript
Two-fold dominance
Five-fold dominance
1 FPKM 10,410 56.42% 8,179 78.51% 5,864 56.22% 5 FPKM 4,671 25.32% 3,898 83.64% 3,077 66.27% 10 FPKM 2,486 13.47% 2,146 86.54% 1,794 72.60%
Average number of genes with dominant major transcripts detected in the primary tissues dataset. Different dominance ratios and gene expression thresholds were considered in the quantification.
Gonzàlez-Portaet al.Genome Biology2013,14:R70 http://genomebiology.com/2013/14/7/R70
[image:3.595.306.539.623.705.2]higher FPKM thresholds, thus suggesting that transcrip-tome diversity decreases for highly expressed genes (Addi-tional File 1 - Figure S5). Focusing on genes that tend to express several transcripts at a similar level, we identified 463 genes in the tissue dataset for which the major tran-script was less than five-fold dominant in all the tissues analysed, and only 17 for a two-fold dominance threshold. GO enrichment analysis of those revealed that they are involved in RNA splicing/processing, post-transcriptional regulation of gene expression and regulation of translation (Additional File 2 - Table S6).
We applied the same quantifications in cell line data, including different cellular compartments, and observed that major transcripts constitute approximately 80% of the studied mRNA pool in cytosol (77.20% to 83.66%, SD = 1.98, Additional File 2 - Table S3). Overall, transcript dom-inance was less accentuated than in primary tissues - 69% (63.11% to 71.17%, SD = 2.40) of genes with a two-fold dominant major transcript and 42% (35.16% to 44.76%, SD = 2.90) with a five-fold dominant transcript in cytosol (Additional File 2 - Table S4). These differences could reflect higher transcription and splicing rates in cell lines, although they could also be due to technical variability between the two datasets.
Given that estimating transcript expression from short reads is a challenging task, we performed additional ana-lyses to test the reliability of our observations. First, we simulated different RNA-seq datasets to test whether the method used can distinguish between two hypothesised scenarios - one dominant transcript per genevs. similar expression levels of the different transcripts in each gene (see Methods) - and concluded that our method reliably discriminates between those, even when taking into account different sequencing depths (Additional File 1 -Figure S6). In addition, this analysis reveals that the method is not biased towards the identification of a single transcript per gene (see Additional File 1 - Figure S6) and reproduces our previous findings about transcript domi-nance (Additional File 2 - Table S7). Second, we used alternative methods to estimate transcript expression levels and identify major transcripts, including direct evi-dence from junction reads. All the methods have a strong overlap in the predictions (see Additional File 2 - Table S8 and Methods). Third, we analysed the length distribution of major transcripts to determine whether the identifica-tion of major transcripts is biased towards the longest one for each gene. We observe that the length of the major transcript is distributed widely (Additional File 1 - Figure S7) and that in >50% of the cases (50.98% to 55.46%, SD = 1.53) the major transcript is not the longest one annotated (Additional File 2 - Table S9 and Additional File 3 - File S1). The same trend is observed when taking into account CDS length: we estimate that in approximately 50% of the cases (44.42% to 48.23%, SD = 1.12) the major transcript
does not contain the longest CDS, thus not corresponding to the‘canonical’transcript as annotated in UniProt (Addi-tional File 2 - Table S9 and Addi(Addi-tional File 3 - File S1). For instance, we identified theAES(amino-terminal enhancer
of split) andCD47(CD47 molecule) genes, for which we
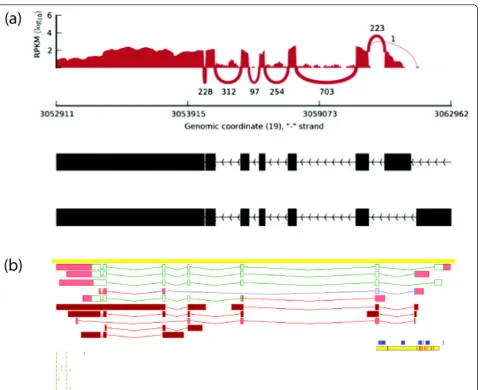
detect a ubiquitous major transcript that is shorter than the current reference (Figure 2 and Additional File 1 -Figure S8). Finally, we addressed the impact of unnano-tated transcripts in our observations by performingde novo transcript identification using Cufflinks (see Methods). As expected, we observe a higher number of transcripts per
gene (6.38 in GENCODE v11vs. 12.84 using Cufflinks),
although the main message still prevails (Additional File 1 - Figure S9 and Additional File 2 - Table S10).
Major transcripts tend to be recurrent across samples
We next sought to quantify how often we detect the same major transcript across different samples. Focusing on the tissue dataset, and taking into account genes that are expressed in at least two different tissues, we estimate that this is the case for 35% of the genes (Figure 3a and Addi-tional File 3 - File S2); while approximately 50% of the genes that are ubiquitously expressed (that is, expressed in all the 16 tissues) have the same major transcript (Figure 3a). For higher expression thresholds the overlap in the major transcript increases to 79% (Additional File 2 -Table S11). In addition, comparison of expression patterns for major and minor transcripts revealed that the former tend to be expressed in a recurrent fashion (Additional File 1 - Figure S10). In the cell line dataset, we detected similar major transcript expression patterns, with substan-tial differences depending on the subcellular fraction analysed (see Additional File 4 - Supplementary Results).
Figure 2Example of non-canonical major transcript common to all the 16 tissues analysed: AES (amino-terminal enhancer of split, ENSG00000104964). Read coverage for the gene (a) and screenshot from the Zmap manual annotation interface (b). UTR exons and splice variants with no annotated CDS are shown in red, coding exons are shown in green and the CDS portion of models annotated as NMD are shown in purple. Clusters containing >8,000 CAGE tags defining transcription start suites are shown as small blue boxes, CpG islands are shown as yellow boxes broken by horizontal red bars representing TSS predictions from EPONINE [59]. The short horizontal green bars represent polyadenylation sites identified by polyAseq [60].
Figure 3Expression patterns for major transcripts. (a) Percentage of genes with recurrent and non-recurrent major transcripts. Changes in the identity of major transcripts across samples were quantified with switch events. (b) Concept of switch event. A gene is considered to be involved in a switch event if we detect two different dominant major transcripts in two different samples. If the dominant transcripts involved in the switch are expressed above 5 FPKM, while the minor ones are expressed below 1 FPKM, we define the event as a strong switch.
Gonzàlez-Portaet al.Genome Biology2013,14:R70 http://genomebiology.com/2013/14/7/R70
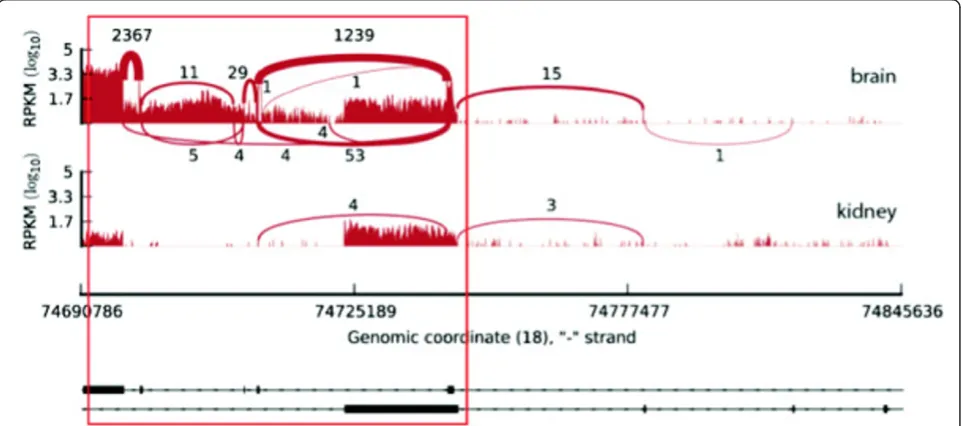
[image:5.595.64.541.550.666.2]switch implied a change in the protein sequence. Tran-script expression profiles for this last subset of events can be visualised in Additional File 1 - Figure S11. One exam-ple is theMBPgene (Myelin Basic Protein), for which we detect a brain specific major transcript (Figure 4 and Addi-tional File 1 - Figure S12).
As our tissue dataset lacks biological replicates, we cannot distinguish which of the switch events are tissue specific, as opposed to individual specific or due to tech-nical or biological noise. Reassuringly, we observed that genes with high variability in splicing across tissues are enriched for transit peptides, among other GO terms (Additional File 2 - Table S13 and Methods), thus sug-gesting that biological variability dominates above tech-nical variability. In addition, in order to estimate to what extent technical variability could influence our estimates, we repeated the same analyses in the cell line dataset, where we observed that the number of switch events detected across cell lines is significantly higher than the one detected across replicates (that is, 10 times higher for fivefold switch events, Additional File 1 -Figure S13). Overall, the proportion of switch events detected in the cell line data is lower than the one observed in the tissue data (Additional File 2 - Table S12 and Additional File 3 - File S5).
Major transcripts do not always code for proteins
Functional classification of major transcripts revealed that for 17% (15.26% to 20.64%, SD = 1.60) of protein coding genes expressed in primary tissues the major transcript lacks an annotated CDS as indicated by GENCODE (see Additional File 4 - Supplementary Methods). Taking into
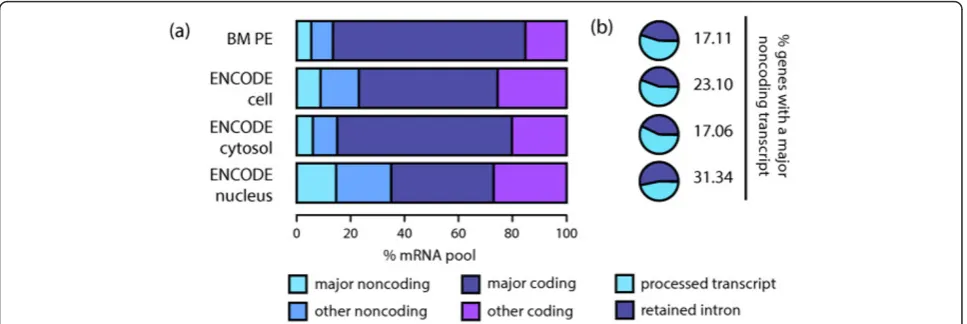
account expression levels, and focusing on cell line data, we observe that major non-coding transcripts are more abundant in the nucleus, where they represent approxi-mately 15% of the studied mRNA pool (12.99% to 16.66%, SD = 1.10, Figure 5a). Genes with major non-coding tran-scripts are expressed at higher levels in the nucleus, com-pared to those with major coding transcripts, while this trend is inverted in the cytosol (Additional File 1 - Figure S14). In addition, non-coding major transcripts are less dominant than coding ones in both compartments (Addi-tional File 1 - Figure S14): 61% (54.80% to 65.57%, SD = 3.07) of major coding transcripts are also five-fold domi-nant, while this number goes down to 27% (15.71% to 35.34%, SD = 5.76) for non-coding major ones. Finally, the annotation revealed that the major non-coding transcripts correspond to retained introns and processed transcripts, which lack an open reading frame (see Supp. Methods). We observe a higher proportion of processed transcripts in the cytosol and retained introns in the nucleus (Figure 5b).
[image:6.595.58.540.486.699.2]In order to evaluate the hypothesis that incomplete spli-cing could explain the higher proportion of major retained introns in the nucleus, we compared intron expression levels across cellular compartments (see Methods for details on the calculation of intron expression). We observe slightly higher intron expression in the nucleus compared to the cytosol (Additional File 1 - Figure S15). We also observe a general trend in the location of major retained introns towards the transcriptional 3’-end (Addi-tional File 1 - Figure S15); moreover this trend is more accentuated in the cytosol than in the nucleus, where it is possibly masked by the higher intronic expression levels. Such 3’intron retention has been previously linked to
nonsense-mediated decay (see Discussion). Alternatively, the prevalence of retained introns as a major transcript could point to a functional mechanism. We observe that genes with retained introns as the major transcript both in nucleus and cytosol are expressed at lower levels in the later (Additional File 1 - Figure S15), which would be con-sistent with a regulatory role for retained introns (see Dis-cussion). We also detect that those genes are associated to transit peptides and ribosomal components, which is con-sistent with previous findings indicating that introns regu-late the expression of ribosomal proteins in yeast (Additional File 2 - Table S14, see Discussion). On the other hand, the term‘processed transcript’constitutes an ambiguous category. Manual inspection of a subset of pro-cessed transcripts that were consistently identified across all samples as the major transcript suggests that potentially they could be re-annotated to protein coding, nonsense mediated decay (NMD) or retained intron (Additional File 2 - Table S15). Together, this seems to suggest that the true proportion of non-coding major transcripts for pro-tein coding genes may be lower than the current annota-tion suggests, and most of these result from retained introns, which can be explained by incomplete splicing or potentially have a regulatory role.
Conclusions
In this study we combine RNA-seq data from different pri-mary tissues, cell lines and cellular compartments to char-acterise the human protein coding transcriptome from a functional perspective. We show that in a given condition most protein coding genes not only express one major transcript, as recently observed by Djebaliet al.[13], but in most cases the major transcripts are dominating the
transcriptome. This observation is accentuated when grouping transcripts by TSS, a scenario in which differ-ences in transcript abundance can be mostly attributed to splicing. We are aware that transcript quantification from short read sequences is not a trivial task, and that the cur-rent annotation is continuously updated to include novel transcripts. However, our findings are supported by several quantification methods, includingde novotranscript dis-covery, they are consistent across all datasets, and are reas-suringly supported by direct evidence from junction reads. In addition, the single transcript dominance becomes stronger for highly expressed genes, for which transcript prediction and quantification have been reported to be more reliable (RNA-seq Genome Annotation Assessment Project - RGASP, J Harrow, T Steijger, F Kokocinski, JF Abril, C Howald, A Reymond, A Mortazavi, B Wold, T Gingeras, R Guigó,et al., in preparation). In the long term, longer reads and single cell sequencing will shed more light on the topic.
[image:7.595.57.541.89.251.2]Changes in alternative splicing across conditions have been widely reported, with many studies focusing on the differences across tissues ([7,8,20], Merkinet al. Science 2012, [24]), where splicing is thought to control the inter-actions of the protein products [25,26]. Here we quantify changes in the major transcript across conditions by look-ing at switch events. We detect a significant number of genes that express several major transcripts across differ-ent conditions. Relevant examples include theMBPgene, PSEN1(presenilin 1) andILF3(interleukin enhancer bind-ing factor 3). However, in many cases the differences are subtle. This would suggest that alternative splicing might be more prevalent in dynamic processes such as develop-ment and differentiation, rather than steady state. On the Figure 5Major non-coding transcripts in protein coding genes. (a)Proportion of the mRNA studied represented by different categories of transcripts. Average proportions were calculated including all the samples from each dataset. Major non-coding transcripts are more abundant in nucleus, where the proportion of major coding ones also becomes reduced. (b) Transcript biotype categories for the major non-coding transcripts. Average proportions were calculated including all the samples from each dataset. Processed transcripts are more abundant in the cytosol, while retained introns represent the major fraction in the nucleus. Other minor categories that represented <1% of the transcripts were also identified, but are not visible in the plots.
Gonzàlez-Portaet al.Genome Biology2013,14:R70 http://genomebiology.com/2013/14/7/R70
other hand, dominant transcripts that are recurrent in many samples are also interesting, given that they can be used to build a catalogue for the reference transcriptome. A closer inspection of a set of recurrent major transcripts revealed cases where they do not contain the longest CDS, a criteria often used in resources like UniProt to define a reference transcript [27], thus exposing some of the limita-tions of the current definilimita-tions and pointing to potential advantages of taking into account functional data. For instance, the major transcripts detected for theAESgene and theCD47gene are ubiquitously expressed and do not correspond to the current reference.
We were surprised to find that for a non-negligible frac-tion of protein coding genes the major transcript is non-coding and can be classified as retained intron or processed transcript, which lack an open reading frame [28]. How-ever, we observe higher prevalence of non-coding major transcripts in the nucleus, specifically retained introns. Evi-dence exists suggesting that unspliced or incompletely spliced mRNAs are confined to the nucleus [29,30]; there-fore we hypothesize that our observation could reflect incomplete splicing, as suggested by the higher expression levels of introns in nucleus. We also observe that retained introns are preferentially located towards the transcrip-tional end of transcripts, which has been previously linked to nonsense mediated decay [31], a control mechanism that leads to the degradation of unspliced transcripts when they are transported to the cytosol [32,33]. Nevertheless, several cases of functionally relevant retained introns have been described, either as a mechanism to target mRNA molecules (for example, [34,35], produce alternate protein products [36] or regulate expression levels [37-39]. We observe that genes with retained introns as the major tran-script in both nucleus and cytosol are expressed at consid-erably lower levels in the later, which could point to a regulatory role. Finally, we also detected that those genes are associated to ribosomal components, which is consis-tent with previous findings indicating that introns regulate the expression of ribosomal proteins in yeast [40]. On the other hand, we were able to re-annotate some of the recur-rent processed transcripts to either coding or retained intron, thus illustrating a potential application of our ana-lyses. For example, we revisited the annotation for one of the transcripts fromPARK7(parkinson protein 7) to pro-tein coding, fromRNF40(ring finger protein 40) to non-sense mediated decay and fromOSBPL2(oxysterol binding protein-like 2) to retained intron.
Overall, it is difficult to predict the impact of our observations at the protein level. There have been several studies addressing the relationship between protein and transcript levels, which in general point at a modest, but not insignificant correlation [17,21,41,42]. Translational efficiency, mRNA and protein turnover rates are likely to have an impact on protein levels [21]. On the other hand,
proteomics studies also show that observing a protein is unlikely unless there are at least a certain number of RNA molecules per cell [21-23]. This may be partly due to insufficient sensitivity of the methods used; neverthe-less this supports the hypothesis that the abundance of proteins corresponding to minor transcripts is likely to be lower than the one corresponding to dominant tran-scripts. We evaluated this hypothesis by overlapping our set of dominant transcripts with a set of transcripts pre-dicted to be translated into proteins by entirely indepen-dent means [43]. We detected a considerably larger overlap for those transcripts that have a tendency to be identified as major, compared to minor ones, suggesting that major transcripts could be preferentially translated. On the other hand, alternative splicing not only has an impact on the proteome repertoire [44-46], but also at the transcriptome level, cooperating in the control of expression levels [20,32,47] and contributing to spatial expression patterns through transcript localisation [46]. This brings in other potential roles for minor transcripts. However, it is also possible that some of those minor transcripts are simply the result from noisy splicing [22,45,48].
The discovery of alternative splicing and many different classes of non-coding RNAs, together with the establish-ment of RNA-seq, revealed that the number of transcripts exceeds many times the number of genes in the human genome. This has been used to argue that alternative spli-cing possibly explains the low number of genes compared to what was believed before it was sequenced [45]. Despite this diversity of transcripts, our findings indicate that most protein coding genes express one dominant transcript in a given condition and that most of the mRNA pool from protein coding loci arises from major transcripts, thus sug-gesting that those could be the main contributors to the proteome. In addition, the ratio of the number of expressed transcripts to genes in primary tissues is on average 1.12 and many of the dominant transcripts are the same across different conditions. Overall, these observa-tions may help proteome analysis by prioritising the candi-date proteins that are more likely to be present in a given sample. At the same time, identification of changes in the major transcript across conditions can lead to relevant clinical findings (for example, [18]) and may also be used to predict the functional impact of the detected changes in variation studies.
Materials and methods Datasets and mapping
Raw fastq files were retrieved from the European Nucleo-tide Archive [50] using the accession numbers indicated in Additional File 2 - Table S16. In addition to the publicly available datasets, we simulated two RNA-seq experiments using the Flux Simulator [16]. Details on the parameters used in the simulation have also been listed in Additional File 2 - Table S16.
Fastq files in the BM dataset were filtered before map-ping by trimming the last five nucleotides of all reads. Raw data were mapped to the human genome and transcrip-tome (Ensembl 66; [1]) using TopHat v1.3.3 [51] and Bow-tie v0.12.7 [52], respectively.
Gene and transcript study sets
Gene and transcript annotations used in the analyses cor-respond to those in GENCODE v11 [28]. We focused on protein coding genes and filtered out those for which at least one of the annotated transcripts was shorter than 300 bp, given that those transcripts would be lost during the size selection step in the RNA-seq experiment. In total, our study set comprises 18,450 protein coding genes, of which 14,902 have more than one transcript annotated.
Counting reads overlapping exonic and intronic regions
Exonic coordinates were retrieved from the annotation and used to define intronic regions. Formally, our defini-tion of intron encompasses those regions that are located inside genic boundaries and are not overlapped by any exon in any annotated transcript. We then computed the number of reads overlapping known exons and introns using dexseq-count (DEXSeq v1.5.5 [53]) and converted read counts to FPKM values with custom scripts.
Estimation of gene and transcript expression levels
For each gene, expression levels were calculated as the average FPKMs of all expressed exons. Independently, transcript abundances were obtained using three different tools: MISO v0.4.1 [6], Cufflinks v1.3.0 [4] and MMSEQ v0.10.0 [5]. MISO and Cufflinks take as input alignments to the genome, while MMSEQ requires mapping to the transcriptome, thus the need to use two different mapping strategies (see above). In all three cases we based the esti-mates on the existing transcript annotation (see above), cancelling any option forde novoinference, and converted those to transcript relative abundances when necessary. In this manuscript we are referring to the results obtained by MISO and we use a default FPKM threshold of 1 to con-sider a gene/transcript as expressed. This threshold has been suggested as the minimum expression required for protein detection [21-23] and is different from lower thresholds that have been suggested to address transcript detectability [54]. In addition, we include higher expres-sion thresholds in the analyses (5 and 10 FPKM), since transcript quantification has been reported to be more
reliable for those (RNA-seq Genome Annotation Assess-ment Project - RGASP, J Harrow, T Steijger, F Kokocinski, JF Abril, C Howald, A Reymond, A Mortazavi, B Wold, T Gingeras, R Guigó,et al., in preparation). Finally, we consider a transcript as detected independently of its expression level, given that the gene is expressed.
mRNA pool estimates were calculated as introduced by [54]. Briefly, the fraction of the studied mRNA pool that can be explained by the expression of major transcripts can be represented as the ratio of the sum of FPKMs for major transcriptsvs. the sum of FPKMs for all the tran-scripts in our study set. All trantran-scripts encoded within protein coding genes were taken into account in the cal-culation, independently of their transcript biotype, and thus we refer to mRNA pool from protein coding loci. Mitochondrial genes in our study set were discarded for this analysis (n= 11 in our study set), since they are pre-sent multiple times in the cell and could bias the quanti-fication (for example, we found that six transcripts arising from mitochondrial genes explain almost 50% of the studied mRNA pool).
Direct evidence from junction reads
Starting with our gene study set (see above), we focused on those genes for which all of the annotated transcripts can be uniquely identified by at least one splice junction
(n= 2,306). We then proceeded to identify major
tran-scripts based on coverage evidence (that is, quantifying the number of reads supporting each junction and taking the average in case of several splice junctions). For each sam-ple we calculated the overlap with MISO (Additional File 2 - Table S8).
De novotranscript discovery using Cufflinks
We used Cufflinks v1.3.0 [4] to discover novel transcripts in each tissue from the BM dataset and merged all the obtained annotations using cuffmerge. We then focused on the subset of transcripts that overlap with known pro-tein coding genes and filtered out those genes with tran-scripts shorter than 300 bp, as mentioned previously (see Gene and transcript study sets). A summary on the num-ber of genes and transcripts identified can be found in Additional File 2 - Table S10.
GO analysis
GO analyses were performed with the DAVID software [55,56]. The reference population was defined by our gene study set (see above) and an adjustedPvalue of 0.05 (Ben-jamini and Hochberg correction [57]) was used as a threshold for the identification of significant GO terms.
Switch events
We performed a pairwise comparison of the samples in each dataset and focused on those cases where we detect
Gonzàlez-Portaet al.Genome Biology2013,14:R70 http://genomebiology.com/2013/14/7/R70
different major coding transcripts. Given a geneG, a pair of transcriptsIkandIland a pair of samplesSiandSj, we
say that geneGundergoes an x-fold switch between tran-scriptsIkandIlin samplesSiandSj, ifGis expressed inSi
andSjand the ratio of the expression ofIito the
expres-sion ofIjis at leastxinSiand no more than 1/xin Sj.
Additionally, we looked at x-fold switch events that are not accompanied by strong change in the overall gene expression, to filter out the cases where the change is lar-gely due to the overall expression change. A switch event was considered to be expression dependent if the differ-ence in the expression level of geneGbetween sampleSi
andSjwas bigger than the mean, and expression
inde-pendent otherwise. Finally, we say that there is a strong switch if the expression ofIkinSiandIlinSjis at least 5
FPKM, whileIkinSjandIlinSiless than 1. The intuition
behind the definition of strong switch is that we want to maximise the chances of obtaining a protein in the first sample and not in the second, andvice versa, and several proteomics studies show that observing a protein is unli-kely unless there are at least a certain number of RNA molecules per cell [21-23]. Finally, given a sample S and a switch (Ik, Il) we can calculate ratio r = expression(Ik)/
expression(Il) and its logarithm lr = log(r). Given a switch
(Ik, Il) and set of samples S1, ..., Sj, the vector (lr1, ..., lrj) of
these values is called the expression profile of the switch.
Variability in splicing across tissues
Variability in splicing relative abundances across tissues was measured using the method introduced by [58].
Additional material
Additional file 1: Supplementary Figures
Additional file 2: Supplementary Tables
Additional file 3: Supplementary Files
Additional file 4: Supplementary Methods and Results
Abbreviations
BM: Illumina Body Map dataset.
Authors’contributions
MGP carried out the analyses and wrote the manuscript. AF and JR participated in the analysis and writing. JH participated in the design and writing. AB conceived the study and wrote the manuscript. All authors read and approved the final manuscript.
Acknowledgements
The authors would like to thank and acknowledge Wolfgang Huber, Jan Korbel, Nicholas Luscombe, Roderic Guigó, Ângela Gonçalves, John Marioni, Simon Tavaré and all the members of Alvis Brazma’s group for the encouraging discussions and helpful comments. The research leading to these results has received funding from the European Community’s FP7 HEALTH grants CAGEKID (grant agreement 241669) and GEUVADIS (grant agreement 261123), as well as the Wellcome Trust grant [098051]; and the National Institutes of Health [5U54HG004555].
Authors’details
1European Molecular Biology Laboratory - European Bioinformatics Institute,
EMBL-EBI, Wellcome Trust Genome Campus, Hinxton, Cambridge, CB10 1SD, United Kingdom.2Wellcome Trust Sanger Institute, Wellcome Trust Genome
Campus, Hinxton, Cambridge, CB10 1SA, United Kingdom.
Received: 17 January 2013 Revised: 24 May 2013 Accepted: 1 July 2013 Published: 1 July 2013
References
1. Flicek P, Amode MR, Barrell D, Beal K, Brent S, Carvalho-Silva D, Clapham P, Coates G, Fairley S, Fitzgerald S, Gil L, Gordon L, Hendrix M, Hourlier T, Johnson N, Kahari AK, Keefe D, Keenan S, Kinsella R, Komorowska M, Koscielny G, Kulesha E, Larsson P, Longden I, McLaren W, Muffato M, Overduin B, Pignatelli M, Pritchard B, Riat HS,et al:Ensembl 2012.Nucleic Acids Res2011,40:D84-D90.
2. Wang Z, Gerstein M, Snyder M:RNA-Seq: a revolutionary tool for transcriptomics.Nat Rev Genet2009,10:57-63.
3. Mortazavi A, Williams BA, McCue K, Schaeffer L, Wold B:Mapping and quantifying mammalian transcriptomes by RNA-Seq.Nat Methods2008, 5:621-628.
4. Trapnell C, Williams BA, Pertea G, Mortazavi A, Kwan G, Baren MJ van, Salzberg SL, Wold BJ, Pachter L:Transcript assembly and quantification by RNA-Seq reveals unannotated transcripts and isoform switching during cell differentiation.Nat Biotechnol2010,28:511-515.
5. Turro E, Su SY, Gonçalves Â, Coin LJM, Richardson S, Lewin A:Haplotype and isoform specific expression estimation using multi-mapping RNA-seq reads.Genome Biol2011,12:R13.
6. Katz Y, Wang ET, Airoldi EM, Burge CB:Analysis and design of RNA sequencing experiments for identifying isoform regulation.Nat Methods
2010,7:1009-1015.
7. Pan Q, Shai O, Lee LJ, Frey BJ, Blencowe BJ:Deep surveying of alternative splicing complexity in the human transcriptome by high-throughput sequencing.Nat Genet2008,40:1413-1415.
8. Wang ET, Sandberg R, Luo S, Khrebtukova I, Zhang L, Mayr C, Kingsmore SF, Schroth GP, Burge CB:Alternative isoform regulation in human tissue transcriptomes.Nature2008,456:470-476.
9. Tang F, Barbacioru C, Wang Y, Nordman E, Lee C, Xu N, Wang X, Bodeau J, Tuch BB, Siddiqui A, Lao K, Surani MA:mRNA-Seq whole-transcriptome analysis of a single cell.Nat Methods2009,6:377-382.
10. Bland CS, Wang ET, Vu A, David MP, Castle JC, Johnson JM, Burge CB, Cooper TA:Global regulation of alternative splicing during myogenic differentiation.Nucleic Acids Res2010,38:7651-7664.
11. Waks Z, Klein AM, Silver PA:Cell-to-cell variability of alternative RNA splicing.Mol Syst Biol2011,7:506.
12. Taneri B, Snyder B, Gaasterland T:Distribution of alternatively spliced transcript isoforms within human and mouse transcriptomes.J OMICS Res2011,1:1-5.
13. Djebali S, Davis CA, Merkel A, Dobin A, Lassmann T, Mortazavi A, Tanzer A, Lagarde J, Lin W, Schlesinger F, Xue C, Marinov GK, Khatun J, Williams BA, Zaleski C, Rozowsky J, Röder M, Kokocinski F, Abdelhamid RF, Alioto T, Antoshechkin I, Baer MT, Bar NS, Batut P, Bell K, Bell I, Chakrabortty S, Chen X, Chrast J, Curado J,et al:Landscape of transcription in human cells.Nature2012,489:101-108.
14. Lukk M, Kapushesky M, Nikkilä J, Parkinson H, Goncalves A, Huber W, Ukkonen E, Brazma A:A global map of human gene expression.Nat Biotechnol2010,28:322-324.
15. Padhi BK, Pelletier G:Perturbation of myelin basic protein (Mbp) splice variant expression in developing rat cerebellum following perinatal exposure to methylmercury.Toxicol Lett2012,213:374-380. 16. Griebel T, Zacher B, Ribeca P, Raineri E, Lacroix V, Guigó R, Sammeth M:
Modelling and simulating generic RNA-Seq experiments with the flux simulator.Nucleic Acids Res2012,40:10073-10083.
17. Lundberg E, Fagerberg L, Klevebring D, Matic I, Geiger T, Cox J, Algenäs C, Lundeberg J, Mann M, Uhlen M:Defining the transcriptome and proteome in three functionally different human cell lines.Mol Syst Biol2010,6:450. 18. Zhao Q, Caballero OL, Davis ID, Jonasch E, Tamboli P, Yung WKA,
19. Ezkurdia I, del Pozo A, Frankish A, Rodriguez JM, Harrow J, Ashman K, Valencia A, Tress ML:Comparative proteomics reveals a significant bias toward alternative protein isoforms with conserved structure and function.Mol Biol Evol2012,29:2265-2283.
20. Lareau LF, Brooks AN, Soergel DAW, Meng Q, Brenner SE:The coupling of alternative splicing and nonsense-mediated mRNA decay.Adv Exp Med Biol2007,623:190-211.
21. Vogel C, Marcotte EM:Insights into the regulation of protein abundance from proteomic and transcriptomic analyses.Nat Rev Genet2012, 13:227-232.
22. Hebenstreit D, Fang M, Gu M, Charoensawan V, van Oudenaarden A, Teichmann SA:RNA sequencing reveals two major classes of gene expression levels in metazoan cells.Mol Syst Biol2011,7:497. 23. Fagerberg L, Oksvold P, Skogs M, Algenäs C, Lundberg E, Pontén F,
Sivertsson A, Odeberg J, Klevebring D, Kampf C, Asplund A, Sjöstedt E, Al-Khalili Szigyarto C, Edqvist P-H, Olsson I, Rydberg U, Hudson P, Ottosson Takanen J, Berling H, Björling L, Tegel H, Rockberg J, Nilsson P, Navani S, Jirström K, Mulder J, Schwenk JM, Zwahlen M, Hober S, Forsberg M,et al: Contribution of antibody-based protein profiling to the human Chromosome-centric Proteome Project (C-HPP).J Proteome Res2013, 12:2439-2448.
24. Licatalosi DD, Darnell RB:RNA processing and its regulation: global insights into biological networks.Nat Rev Genet2010,11:75-87. 25. Buljan M, Chalancon G, Eustermann S, Wagner GP, Fuxreiter M, Bateman A,
Babu MM:Tissue-specific splicing of disordered segments that embed binding motifs rewires protein interaction networks.Mol Cell2012, 46:871-883.
26. Ellis JD, Barrios-Rodiles M, Colak R, Irimia M, Kim T, Calarco JA, Wang X, Pan Q, O’Hanlon D, Kim PM, Wrana JL, Blencowe BJ:Tissue-specific alternative splicing remodels protein-protein interaction networks.Mol Cell2012,46:884-892.
27. The UniProt Consortium:Reorganizing the protein space at the Universal Protein Resource (UniProt).Nucleic Acids Res2011,40:D71-D75. 28. Harrow J, Frankish A, Gonzalez JM, Tapanari E, Diekhans M, Kokocinski F,
Aken BL, Barrell D, Zadissa A, Searle S, Barnes I, Bignell A, Boychenko V, Hunt T, Kay M, Mukherjee G, Rajan J, Despacio-Reyes G, Saunders G, Steward C, Harte R, Lin M, Howald C, Tanzer A, Derrien T, Chrast J, Walters N, Balasubramanian S, Pei B, Tress M,et al:GENCODE: The reference human genome annotation for The ENCODE Project.Genome Res2012,22:1760-1774.
29. Sommer P, Nehrbass U:Quality control of messenger ribonucleoprotein particles in the nucleus and at the pore.Curr Opin Cell Biol2005, 17:294-301.
30. Egecioglu DE, Chanfreau G:Proofreading and spellchecking: a two-tier strategy for pre-mRNA splicing quality control.RNA2011,17:383-389. 31. Kurmangaliyev YZ, Gelfand MS:Computational analysis of splicing errors
and mutations in human transcripts.BMC Genomics2008,9:13. 32. Lewis BP, Green RE, Brenner SE:Evidence for the widespread coupling of
alternative splicing and nonsense-mediated mRNA decay in humans.
Proc Natl Acad Sci USA2003,100:189-192.
33. Hillman RT, Green RE, Brenner SE:An unappreciated role for RNA surveillance.Genome Biol2004,5:R8.
34. Buckley PT, Lee MT, Sul J-Y, Miyashiro KY, Bell TJ, Fisher SA, Kim J, Eberwine J:Cytoplasmic intron sequence-retaining transcripts can be dendritically targeted via ID element retrotransposons.Neuron2011, 69:877-884.
35. Bell TJ, Miyashiro KY, Sul J-Y, McCullough R, Buckley PT, Jochems J, Meaney DF, Haydon P, Cantor C, Parsons TD, Eberwine J:Cytoplasmic BK (Ca) channel intron-containing mRNAs contribute to the intrinsic excitability of hippocampal neurons.Proc Natl Acad Sci USA2008, 105:1901-1906.
36. Li Y, Bor Y-C, Misawa Y, Xue Y, Rekosh D, Hammarskjöld M-L:An intron with a constitutive transport element is retained in a Tap messenger RNA.Nature2006,443:234-237.
37. Yap K, Lim ZQ, Khandelia P, Friedman B, Makeyev EV:Coordinated regulation of neuronal mRNA steady-state levels through developmentally controlled intron retention.Genes Dev2012, 26:1209-1223.
38. Averbeck N, Sunder S, Sample N, Wise JA, Leatherwood J:Negative control contributes to an extensive program of meiotic splicing in fission yeast.
Mol Cell2005,18:491-498.
39. Mansilla A, López-Sánchez C, de la Rosa EJ, García-Martínez V, Martínez-Salas E, de Pablo F, Hernández-Sánchez C:Developmental regulation of a proinsulin messenger RNA generated by intron retention.EMBO Rep
2005,6:1182-1187.
40. Parenteau J, Durand M, Morin G, Gagnon J, Lucier J-F, Wellinger RJ, Chabot B, Elela SA:Introns within ribosomal protein genes regulate the production and function of yeast ribosomes.Cell2011,147:320-331. 41. Foss EJ, Radulovic D, Shaffer SA, Ruderfer DM, Bedalov A, Goodlett DR,
Kruglyak L:Genetic basis of proteome variation in yeast.Nat Genet2007, 39:1369-1375.
42. Fu X, Fu N, Guo S, Yan Z, Xu Y, Hu H, Menzel C, Chen W, Li Y, Zeng R, Khaitovich P:Estimating accuracy of RNA-Seq and microarrays with proteomics.BMC Genomics2009,10:161.
43. Rodriguez JM, Maietta P, Ezkurdia I, Pietrelli A, Wesselink J-J, Lopez G, Valencia A, Tress ML:APPRIS: annotation of principal and alternative splice isoforms.Nucleic Acids Res2013,41:D110-D117.
44. Tress ML, Martelli PL, Frankish A, Reeves GA, Wesselink JJ, Yeats C, Olason PI, Albrecht M, Hegyi H, Giorgetti A, Raimondo D, Lagarde J, Laskowski RA, López G, Sadowski MI, Watson JD, Fariselli P, Rossi I, Nagy A, Kai W, Størling Z, Orsini M, Assenov Y, Blankenburg H, Huthmacher C, Ramírez F, Schlicker A, Denoeud F, Jones P, Kerrien S,et al:The implications of alternative splicing in the ENCODE protein complement.
Proc Natl Acad Sci USA2007,104:5495-5500.
45. Nilsen TW, Graveley BR:Expansion of the eukaryotic proteome by alternative splicing.Nature2010,463:457-463.
46. Stamm S, Ben-Ari S, Rafalska I, Tang Y, Zhang Z, Toiber D, Thanaraj TA, Soreq H:Function of alternative splicing.Gene2005,344:1-20. 47. Skandalis A, Frampton M, Seger J, Richards MH:The adaptive significance
of unproductive alternative splicing in primates.RNA2010,16:2014-2022. 48. Pickrell JK, Pai AA, Gilad Y, Pritchard JK:Noisy splicing drives mRNA
isoform diversity in human cells.PLoS Genet2010,6:e1001236. 49. ENCODE Project Consortium:An integrated encyclopedia of DNA
elements in the human genome.Nature2012,489:57-74. 50. Leinonen R, Akhtar R, Birney E, Bower L, Cerdeno-Tárraga A, Cheng Y,
Cleland I, Faruque N, Goodgame N, Gibson R, Hoad G, Jang M, Pakseresht N, Plaister S, Radhakrishnan R, Reddy K, Sobhany S, Ten Hoopen P, Vaughan R, Zalunin V, Cochrane G:The European Nucleotide Archive.Nucleic Acids Res2011,39(Database):D28-31.
51. Trapnell C, Pachter L, Salzberg SL:TopHat: discovering splice junctions with RNA-Seq.Bioinformatics2009,25:1105-1111.
52. Langmead B, Trapnell C, Pop M, Salzberg SL:Ultrafast and memory-efficient alignment of short DNA sequences to the human genome.
Genome Biol2009,10:R25.
53. Anders S, Reyes A, Huber W:Detecting differential usage of exons from RNA-seq data.Genome Res2012,22:2008-2017.
54. Ramsköld D, Wang ET, Burge CB, Sandberg R:An abundance of ubiquitously expressed genes revealed by tissue transcriptome sequence data.PLoS Comput Biol2009,5:e1000598.
55. Huang DW, Sherman BT, Lempicki RA:Bioinformatics enrichment tools: paths toward the comprehensive functional analysis of large gene lists.
Nucleic Acids Res2009,37:1-13.
56. Huang DW, Sherman BT, Lempicki RA:Systematic and integrative analysis of large gene lists using DAVID bioinformatics resources.Nat Protoc
2009,4:44-57.
57. Benjamini Y, Hochberg Y:Controlling the false discovery rate: a practical and powerful approach to multiple testing.J R Stat Soc Ser B1995, 57:289-300.
58. Gonzàlez-Porta M, Calvo M, Sammeth M, Guigó R:Estimation of alternative splicing variability in human populations.Genome Res2012,22:528-538. 59. Down TA, Hubbard TJP:Computational detection and location of
transcription start sites in mammalian genomic DNA.Genome Res2002, 12:458-461.
60. Derti A, Garrett-Engele P, Macisaac KD, Stevens RC, Sriram S, Chen R, Rohl CA, Johnson JM, Babak T:A quantitative atlas of polyadenylation in five mammals.Genome Res2012,22:1173-1183.
doi:10.1186/gb-2013-14-7-r70
Cite this article as:Gonzàlez-Portaet al.:Transcriptome analysis of
human tissues and cell lines reveals one dominant transcript per gene. Genome Biology201314:R70.
Gonzàlez-Portaet al.Genome Biology2013,14:R70 http://genomebiology.com/2013/14/7/R70