Application of resistant starch in bread: processing,
proximate composition and sensory quality of
functional bread products from wheat flour and
African locust bean (Parkia biglobosa) flour
Abdoulaye Sankhon1,2, Issoufou Amadou1, Wei-Rong Yao1*
1State Key Laboratory of School of Food Science and Technology/School of Food Science and Technology, Jiangnan University,
1800 Lihu, Wuxi 214122, Jiangsu Province, China; [email protected], [email protected]
2Faculte des Sciences de la Nature, Departement de Chimie, Universite Julius Nyerere de Kankan, Guinea;
*Corresponding Author: [email protected]
Received 2013
ABSTRACT
Application of resistant starch prepared from parkia flour was produced by replacement of wheat flour with 0, 5%, 10%, 15%, 20%, 30% and 40% Parkia flour. Processing, proximate com- position, digestibility of resistant starch in bread and sensory quality were evaluated. Resistant starch was significantly (p < 0.05) increased as Parkia flour level increase in all breads. The resistant starch prepared from Parkia flour was 47.21%. However, wheat bread was 1.47% and Parkia bread 18.52% to 22.28% baked of (200℃ at 45 min) with 2.16% wheat bread and 31.74% to 35.05% Parkia bread baked of (130℃ at 90 min). Supplementation of wheat flour with Parkia flour 0 - 40% increased the crude protein content significantly (p < 0.05) from (7.89% - 15.68%), ash from (0.91% - 2.54%) and crude fiber (1.41% - 4.97%). Color of the bread treatments was remarkably affected by addition of different levels of Parkia flour. Therefore, Parkia flour could be added to wheat flour up to 15% without any observed detrimental effect on bread sensory properties. Sensory evaluation results indicated that bread with 5% to15% Parkia flour were rated the most acceptable and there was no significant difference in terms of acceptability compared to the control. This could be used to improve the nutritional quality of bread especially in developing countries were malnutrition is prevalent.
Keywords: Parkia Flour; Resistant Starch; Bread, Proximate Composition; Sensory Evaluation
1. INTRODUCTION
Derivatization of nutrients and formation of cross link- ages during food processing, make the food inaccessible to digestion or/and metabolism. Recently, the research on starch has been focused on its peculiar form, which is indigestible in vitro and in vivo [1]. Resistant starch (RS) includes all starch and starch degradation products that resist small intestinal digestion and enter the large bowel in normal humans. RS in colon appears to play an im- portant role in protection from colon cancer, diverticulitis and hemorrhoids through production of short chain fatty acids [2]. The other beneficial physiological effects of RS include decreased serum cholesterol and triglycerides level, increased fecal bulk [3] and prebiotic effects [4].
During processing of starchy foods, the starch mole- cules undergo several physical modifications depending upon the type of starch and severity of the conditions applied [5, 6] leading to the formation of RS. Attempts to modify RS intake in a mixed diet should thus focus on optimizing the RS content of bread. According to in vitro determinations, common flour based breads contain lim- ited quantities of RS, i.e. below 2% (starch basis) [7,8]. Similarly, the amount of RS (total starch basis) from about 2% to 10% in the corresponding long-time/low- temperature baked products [9]. Baljeet [10] also ob- served that the RS content of bread baked for 45 min was about 49% higher than that of bread baked for 15 min. The product is basically made of hard wheat flour, yeast, fat, sugar, salt and water [11]. It is a cereal product that is naturally low in protein and nutritionally not a balanced diet because it is low in lysine, an essential amino acid [12]. Fortification of wheat flour with high protein mate- rials from plant sources to increase protein and improve the essential amino acid balance of the resultant braved product such as bread has been recognized [12,13]. Al-
though qualitative determination of the chemical and nutritional composition of P. biglobosa seeds revealed
that it is rich in starch, lipids, protein, carbohydrates, soluble sugars, and ascorbic acid [14].
The demand for the application of resistant starch as a functional ingredient is growing, thus, the analysis of its structural, thermal and digestibility properties have great importance. Moreover, the understanding of the relation- ship between structural characteristics and functional as well as nutritional properties of resistant starches can help food producers in optimizing industrial applications. Fur- thermore, no study has been yet to be conducted to applic- ation of resistant starch in bread: processing, proximate composition and sensory quality of functional bread pro- ducts from wheat flour and Africa locust bean (P. biglobosa)
flour. The objectives of this study therefore, were to formulate and develop functional breads from wheat flours composited with different levels Parkia flour and to evaluate the resistant starch content, nutritional, sensory quality and consumer overall acceptability.
2. MATERIALS AND METHODS
Materials. Africa locust bean (P. biglobosa) seeds were
purchased from Madinah local market (Conakry, Guinea) in April 2012. The sample was shipped down to Wuxi, China through TNT® mailing company (No. GD92358- 0841WW). Wheat flour and ingredients as salt (NaCl), sugar, yeast, and shortening butter were purchased from supermarket (Wuxi, China). Water was prepared in a sterilization equipment chamber pot (YXQ-LS-SII shang- hai Boxun, industry and trade Co. Ltd., medical equip- ment factory). Porcine (pancreatic α-amylase, amyloglu- cosidase) were purchased from Sigma Aldrich Co. Ltd (Shanghai, China) and glucose oxidase-peroxidase assay kit (cat. No. K-GLUC) was purchase from magazine in- ternational Ltd. (Bray, Ireland). All other reagents used were of analytical grade.
Processing Techniques of Preparation Resistant Starch from Parkia Seeds. First visible dirt and con-
taminants were removed parkia seeds which were then steeped in distilled water at room temperature 28℃ for 3 h removed yellow-colored in seeds. Second soaking at room temperature 28℃ for 12 h in distilled water (pH = 5.3), citric acid solution (0.1% pH = 2.6) and sodium bicarbonate solution (0.07%, pH = 8.4) and then cooking temperature (90℃) for 3 h in a sterilization equipment chamber pot (YXQ-LS-SII shanghai equipment Boxun, industry and trade CO, Ltd, medical equipment factory). The soaking liquid was drained and the seeds were im- mersed in water and left overnight at ambient temperature. Finally, the seeds were thoroughly washed, manually de- hulled, and the cotyledon was washed repeatedly until the wash pH was neutral and then placed in a refrigerator
4℃ for 72 h. The seeds were dried in oven at 60℃ for 24 h, then dry milled to a fine powder, ground to pass through a 60 mesh sieve and flour was kept into poly- ethylene bags before being stored in desiccators until further analysis.
Production of Wheat Flour and Parka Flour Bread.
The preparation of the bread involves the replacement of part of the wheat flour with 0%, 5%, 10%, 15%, 20%, 30% and 40% Parkia flour. The 0% Parkia flour served as control. For the preparation of bread, all the ingredients (wheat flour, yeast, sugar, shortening and salt) were purchased from local market (Wuxi, China). The substitution of 30% wheat flour with Parkia flour was prepared firstly by making the water-sugar suspension. Then, flour, yeast and salt were mixed with the sugar solution in a mixing bowl and followed with addition of shortening. The dough was optimally mixed using the mixer SINMAG, model: 50, Wuxi Xinmai machinery CO. Ltd ( Wuxi, China) for about 10 to 15 min until the dough became soft and elastic. After mixing, 130 g of the samples was weighed individually and molded into a shape manually, then the fermentation of 30 min at 32 - 35℃. The molded dough was placed on a greased tray for further proofing in a proofer (SINMAG, model: 325, Wuxi xinmai machinery CO. Ltd) at 30℃. After 30 min, the dough was placed on a tray and baking (BOD, model: 102, Shanghai Zaomiao Electric plant) for (45 min, 200℃
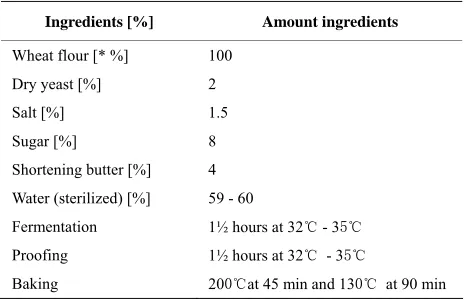
and 90 min, 130 ℃). The formation and baking conditions are given in (Table 1). The amount of water
needed to make the dough was variable. The baking breads were cooled before further testing. The baking test was replicated at least twice.
3. CHEMICAL COMPOSITION OF
COMPOSITE FLOURS AND BREAD
SAMPLES
Composition Analysis. The proximate composition
[image:2.595.307.539.575.725.2](moisture, crude protein, total fat, ash and crude fiber) of
Table 1. Baking formulation* and conditions of wheat flour- -
Parkia flour bread.
Ingredients [%] Amount ingredients
Wheat flour [* %] 100
Dry yeast [%] 2
Salt [%] 1.5
Sugar [%] 8
Shortening butter [%] 4
Water (sterilized) [%] 59 - 60
Fermentation 1½ hours at 32℃ - 35℃
Proofing 1½ hours at 32℃ - 35℃
Baking 200℃at 45 min and 130℃ at 90 min
the wheat flour, Parkia powder, the blends and bread were determined by standard method of [15]. The carbohydrate was obtained by difference (100- moisture, crude protein, total fat, ash and total fiber) with the caloric values of crude protein, total fat and carbohydrate by their physiological fuel values of 4, 9 and 4 respectively and taking the sum of the products. All the experiment was carried out in triplicates.
Evaluation of the Physical Properties of Bread Samples. Weight and volume were measured 2 h after
removal of bread loaves from the oven. Loaf volume was determined by the rapeseed displacement method and specific volume was calculated by dividing volume by loaf weight (cm3/g). At least triplicate measurements
were taken.
Texture Profile Analysis. Texture profile analysis was
performed using a texture analyzer Model TA-XT2i, Stable Micro systems Ltd, (Godalming, UK) with a measure force in compression test selected. The instruments included P1.51 1.5 inches DIA aluminum cylinder probe and grain gage sensitive plat. These instruments were connected to the Texture Expert computer program to analyze the data. The parameters determined were hard- ness, cohesiveness, elasticity, chewiness, adhesiveness and gumminess.
Color Value Measurement. Each loaf of bread was
cut into slices, each 2.5 cm in thickness. The Lightness (L), (Redness (a), and (Yellowness (b) values of the crust and the crumb were measured utilizing color flex spectrocolorimeter Minolta CM-2600D, Minolta camera Co. Ltd (Osaka, Japan).
Determination of Resistant Starch (RS). The RS was
determined using enzymatic method of [5] with some modifications as follow: The samples were deproteinized with pepsin (0.2 ml, 1 g pepsin/10 ml of KCl-HCl buffer, pH 1.5) and the starch was hydrolyzed with pancreatic alpha amylase (1 ml, 40 mg/ml of Tris maleate buffer, 37 ℃ for 16 h). The pellet (containing RS) obtained after centrifugation (15 min, 3000 x g) was washed with distilled water and dispersed with 4M KOH followed by stirring for 30 min at room temperature. The contents (containing alkali solublized starch equivalent to amount of RS) were treated with 80 µl of amyloglucosidase (5 mg/ml of acetate buffer pH 4.75) and kept in a water bath at 60℃for 45 min with constant shaking. The contents were centrifuged (15 min, 3000 x g) and supernatant (containing glucose obtained from hydrolysis of alkali solublized RS) collected in a 500 ml volumetric flask. The amount of glucose was determined using glucose oxidase-peroxidase reagent and content of RS was determined.
Sensory Evaluation. The sensory panel consisted of
students of the school of science and technology, Jiang- nan University, Wuxi, China were used to evaluate
sensory characteristics of the 7 formulated resistant starch content P. biglobosa seeds samples. The 5 point
hedonic scale was used to evaluate appearance, taste, texture, aroma and overall acceptability, where one (1) was “dislike extremely”, two (2) was “dislike”, three (3) was “neither like nor dislike”, four (4) was “ like” and five (5) was “like extremely”.
Statistical Analysis. The test results were processed
using one-way analysis of variance (ANOVA). Differences at p < 0.05 were considered to be significant. SAS software (version 8.1) was used for the analysis.
4. RESULTS AND DISCUSSION
Proceccing of Resistant Starch from Parkia Seeds.
Process conditions (soaking at room temperature for 12 h in distilled water pH = 5.3, citric acid solution 0.1% pH = 2.6 and sodium bicarbonate solution 0.07%, pH = 8.4) and then cooking temperature (90℃) for 3 h and then placed in a refrigerator 4℃ for 72 h affected the RS formation of Parkia seeds. The result of RS for soaking procedure was 47.21%. Similar phenomenon was observed in the work of Siddhuraju and Becker [16] where soaked and boiled legumes had significant (p < 0.05) increase in digestibility. This result was comparable than those re- ported by Ptitchkina et al. [17] the RS contents of banana flour was 56.17% and Tribess et al. [18] report that the resistant starch content of the flour produced varied from (40.9 ± 0.4) g/100 g to (58.5 ± 5.4) g/100 g, on dry basis (db). Soaking affect the starch digestibility, involves entry of water into the legume kernels, wetting and dissolving soluble nutrients. The observed formation in RS may be explained by the relatively slow cooling after gelatinization, starch molecules became less energy active and starch molecules of appropriate sizes rearranged to form orderly crystalline precipitation, which made starch paste retrograde into a gel, as soaking time prolonged, the bundle structure formed between starch chains by hydrogen bonding may dissociate, which is not conducive for the formation of RS but rather favors the formation of slow digestible starch (SDS).
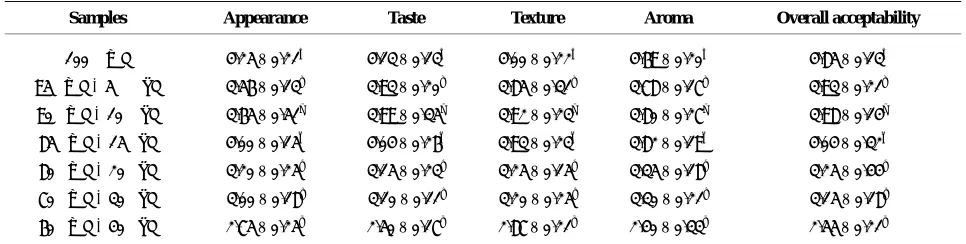
Chemical Composition of Wheat Flour (WF), Parkia Flour (PF) and their Blends (% db). The chemical
compositions of the wheat flour, Parkia flour and their blends are shown in (Table 2). The chemical com-
position of wheat flour and Parkia flour and their blends showed that there were significant (p < 0.05) differences between the wheat flour, Parkia flour and their blends in crude protein, crude ash, crude fiber and carbohydrate contents. It can be observed that the moisture content of flour decreased (11.91% to 10.68%) when the level of Parkia flour in the flour increased 5% to 40%). Low- moisture content is important in the shelf life of food products. Since the protein content of wheat flour was
12.42%, while it was 22.56% in Parkia flour, so Parkia flour was chosen to supplement the wheat flour and produce bread with a high content of protein. The high protein content of Parkia flour used in the fortification of the wheat flour reflected in the high content of protein in the blends. It was observed that wheat flour with 40% Parkia flour inclusion had relatively high protein content (16.79%), 30% Parkia inclusion (15.52%), 20% Parkia inclusion (14.63%), 15% Parkia inclusion (13.12%), 10% Parkia inclusion (12.91%) while 5% Parkia inclusion had the lowest value of protein (11.89%). Also wheat flour had more carbohydrates than Parkia flour, but wheat flour had less amounts of fat, ash and fiber than Parkia flour. Parkia flour contained 1.72% ash and this was the limiting factor for substitution, since the higher content of ash produces a lower grade of flour and a poorer colour of the flour, and that affect the quality of the bread. Similar trends were observed by Noor Aziah et al. [19] with the crude protein, total ash, crude fiber and carbohydrate contents.
Chemical Composition of Bread Supplemented with Parkia Flour. The chemical composition of bread
supplemented with Africa locust been flour is presented in (Table 3). The moisture content of all the bread samples
[image:4.595.57.539.407.547.2]did no differ significantly (p > 0.05) and were in the range (32.56% - 31.89%). The fat content the bread samples did no differ significantly as well and ranged between (1.84%-1.79%). However, there were significant difference (p < 0.05) among the bread samples in crude protein content, the bread with 40% Parkia inclusion was observed to have the highest crude protein content (15.68%), this was followed by 30% Parkia bread (14.47%), while the bread without Parkia inclusion had the lowest protein content (7.89%). Equally, there were significant differences (p < 0.05) among the bread in carbohydrate content. Bread without Parkia inclusion had the highest content of carbohydrate (55.44%) followed by the one with 5% Parkia (52.39%), while the bread 40% Parkia had the lowest carbohydrate content (42.66%). Changes in proximate composition of bread supplemented with grated levels of Parkia flour indicated that addition of Parkia flour to wheat flour increased the crude protein content significantly (p < 0.05) with about 15.68% increase in bread with 40% Parkia addition. Similarly, crude ash and crude fiber contents increased significantly too in the Parkia flour supplemented. The increase in these proximate parameters could be probably due to their quantities in Parkia flour.
Table 2. Chemical composition of wheat flour (WF), Parkia flour (PF) and their blends [% db].
Samples moisture protein Fat Ash Fiber *CHO **Energy
WF 11.53 ± 0.23b 12.42 ± 0.31g 1.35 ± 0.23h 0.83 ± 0.24h 0.89 ± 0.53h 72.98 ± 0.54a 353.75
PF 11.93 ± 0.22a 22.56 ± 0.25a 1.87 ± 1.12b 1.72 ± 0.21c 4.86 ± 0.24a 57.06 ± 0.47h 335.31
(95:5) 11.91 ± 1.09c 11.89 ± 0.21h 1.51 ± 0.23g 1.13 ± 1.12g 2.69 ± 0.32g 70.87 ± 0.32b 344.63
(90:10) 11.87 ± 0.31d 12.91 ± 0.22f 1.58 ± 0.18f 1.35 ± 1.18f 3.08 ± 0.41f 69.21 ± 1.12c 342.27
(85:15) 11.75 ± 0.42e 13.12 ± 0.31e 1.64 ± 0.52e 1.46 ± 0.21e 3.48 ± 1.23e 68.55 ± 0.65d 341.44
(80:20) 10.93 ± 0.25f 14.63 ± 1.09d 1.73 ± 0.17d 1.62 ± 1.15d 3.73 ± 1.19d 67.36 ± 0.42e 343.53
(70:30) 10.81 ± 0.46g 15.52 ± 1.14c 1.84 ± 0.12c 1.83 ± 1.09b 4.03 ± 0.22c 65.97 ± 0.56f 342.52
(60:40) 10.68 ± 1.13h 16.79 ± 0.44b 1.92 ± 0.16a 1.88 ± 0.27a 4.56 ± 0.41b 64.17 ± 1.14g 341.12
WF: Wheat flour; PF: Parkia flour; *CHO: carbohydrate; **Energy [kcal/100 g]. Different letters on same column represent statistically significant (p < 0.05) difference between means.
Table 3. Chemical composition of bread supplemented with Parkia flour.
F:PF Moisture Protein Fat Ash Fiber *COH **Energy
(100:00) 32.56 ± 0.63a 7.89 ± 1.32h 1.79 ± 0.92d 0.91 ± 0.63g 1.4 ± 0.48g 55.44 ± 1.34a 269.43
(95:5) 32.34 ± 0.32b 9.23 ± 0.56f 1.80 ± 0.54c 1.35 ± 0.51f 2.89 ± 0.29f 52.39 ± 0.54b 262.59
(90:10) 31.95 ± 1.23d 11.06 ± 0.36e 1.79 ± 0.61d 1.59 ± 0.73e 3.36 ± 1.24e 50.25 ± 0.94c 261.35
(85:15) 32.28 ± 0.42c 12.23 ± 0.21d 1.82 ± 1.08b 1.78 ± 0.61d 3.38 ± 0.83d 48.51 ± 1.08d 259.34
(80:20) 31.89 ± 0.86e 13.02 ± 0.43c 1.84 ± 0.41a 1.97 ± 0.47c 4.09 ± 0.62c 47.19 ± 1.23e 257.40
(70:30) 31.98 ± 0.65d 14.47 ± 0.67b 1.81 ± 0.59b 2.23 ± 0.81b 4.56 ± 0.49b 44.95 ± 0.87f 253.97
(60:40) 32.35 ± 0.87b 15.68 ± 0.58a 1.80 ± 0.62c 2.54 ± 0.55a 4.97 ± 0.63a 42.66 ± 0.56g 249.56
[image:4.595.57.538.596.715.2]According to Okaka [20] cereals such as wheat flour are lower in protein and lysine deficient but rich in sulphur containing amino acid , Parkia on the other hand is rich in lysine with about 22.56% crude protein and good balance of other essential amino acid, hence the consumption of Parkia flour supplemented bread will mean eating bread with higher protein content and improved protein quality, invariably, a more balanced diet with en- hanced nutritional value that help reduce protein-energy malnutrition. A slight difference in total fat content was observed between the 100% wheat flour bread and 5% - 40% Parkia flour supplemented samples. The fat content also shows a slight change with the addition of Parkia flour, but the ash content increased when the Parkia flour amount in the bread increased. The ash content depends on the quality of the flour and thus corresponds to the higher mineral content, especially potassium [21,22]. On
the other hand, carbohydrate content was reduced as a result of Parkia flour addition. The results were in agree- ment with the report of [23,12,13].
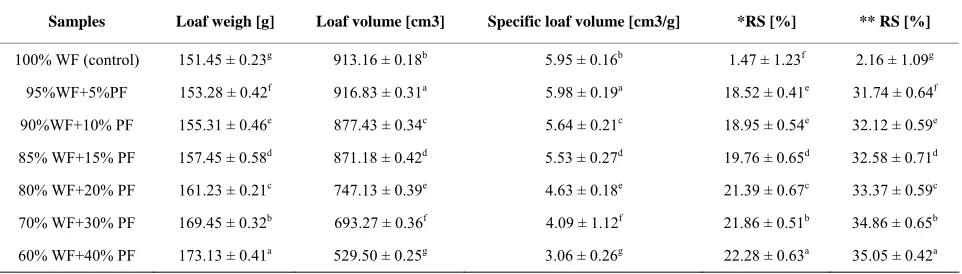
Volume Measurement and Resistant Starch Content ofWheat and Parkia Bread. Increasing levels of Parkia
flour (0 - 40%) significantly (p < 0.05) increased the weight of loaf among samples (Table 4). This might be attributed to the higher fiber content which increased the weight of loaf of the Parkia flour. The 5%, 10% and 15% Parkia flour bread had the highest loaf volume and specific volume as compared to the other samples. A similar observation was reported by Ptitchkina [24] where the addition of 0.5 - 1.0% pumpkin powder showed a massive increase in loaf volume which decreased with further level of pumpkin flour. The moisture content of the breads was a major factor affecting loaf volume. Incorporation of 5%, 10% and 15% Parkia flour in this study resulted in higher specific volume (5.98, 5.64 and 5.53 cm3),
similar observation was reported by Ptitchkina [24] 0.5 - 1.0% Pumpkin powder with values (5.60 and 5.54 cm3).
Resistant starch content of wheat and Parkia bread are presented in (Table 4).The bread baked at 200°C for 45
min and 130℃ for 90 min showed significantly higher RS content of 1.47% to 2.16% wheat bread and 18.52 % to 22.28 % with 31.74 to 35.05% Parkia bread respectively. This corroborate the work reported by Schoenlechner et al. [12]observed an increase from 17.98 to 45.6 percent in wheat breads bakes for 15 to 35 min. [10]alsoobserved that the RS content of bread baked for 45 min was about 49% higher than that of bread baked for 15 min. This explained that long-time/low-temperature baking conditions might also allow endogenous enzymes to remain active over a longer period, compared with conventional baking conditions resulting in possible debranching of amylopectin producing short chains, which may add to the high yield of RS in the long-time/low-temperature baked breads.In high moisture containing starch gels (bread is also a high moisture bakery product), the crytallization of amylose leading to generation of RS, can occur between glass transition temperature (Tg), and melting temperature (Tm of about 150℃). Therefore, During long time/low temperature baking (130℃, 90 min), it is expected that the crumb temperature reaches around 100℃ (well below 150℃) and remains for such a long time, which might favor propagation and crytallinity leading to generation of more RS in bread baked under these conditions. Processing conditions and ingredients may also influence the formation of RS in bread [12,10] present that the longer baking time; however, the lower baking temperature can increase RS formation in breads. However, it is also true that the amylose, that is leaching out of starch granules during gelatinisation could quickly retrograde in the first hours after baking [25,26] which may cause lower digestibility of high amylose containing products.
Color Value Measurement. The colour for the bread
was significantly affected (p < 0.05) by the addition of Parkia flour (Table 5). The colour of the crust showed a
[image:5.595.58.539.579.716.2]significant decrease (p < 0.05) in L value of Parkia flour supplemented bread the colour change occurred from light-brown (control) to darker brown (40% Parkia flour bread). This may be due to additional glucose in the loaves
Table 4. Weight average, volume, specific volume of bread incorporated with different levels of Parkia flour andresistant starch
content of wheat and Parkia bread of (200℃at 45 min and 130℃ at 90 min).
Samples Loaf weigh [g] Loaf volume [cm3] Specific loaf volume [cm3/g] *RS [%] ** RS [%]
100% WF (control) 151.45 ± 0.23g 913.16 ± 0.18b 5.95 ± 0.16b 1.47 ± 1.23f 2.16 ± 1.09g
95%WF+5%PF 153.28 ± 0.42f 916.83 ± 0.31a 5.98 ± 0.19a 18.52 ± 0.41e 31.74 ± 0.64f
90%WF+10% PF 155.31 ± 0.46e 877.43 ± 0.34c 5.64 ± 0.21c 18.95 ± 0.54e 32.12 ± 0.59e
85% WF+15% PF 157.45 ± 0.58d 871.18 ± 0.42d 5.53 ± 0.27d 19.76 ± 0.65d 32.58 ± 0.71d
80% WF+20% PF 161.23 ± 0.21c 747.13 ± 0.39e 4.63 ± 0.18e 21.39 ± 0.67c 33.37 ± 0.59c
70% WF+30% PF 169.45 ± 0.32b 693.27 ± 0.36f 4.09 ± 1.12f 21.86 ± 0.51b 34.86 ± 0.65b
60% WF+40% PF 173.13 ± 0.41a 529.50 ± 0.25g 3.06 ± 0.26g 22.28 ± 0.63a 35.05 ± 0.42a
WF: Wheat flour; PF: Parkia flour; RS: resistant starch content; *RS [%] content in bread at 200°C for 45 min; **RS [%] content in bread at 130°C for 90 min. Different letters on same column represent statistically significant (p < 0.05) difference between means.
containing a darker crust this condition is attributed to maillard browning caused by the reaction between wheat proteins and the added sugar [27] and caramelization which are influenced by the distribution of water and the reaction of added sugars and amino acids [12]. Colour appeared to be a very important criterion for the initial acceptability of the baked product by the consumer. More- over, as the development of colour occurs classically during the later stages of baking, it can be used to judge completion of the baking process. Surface colour depends both on the physico-chemical characteristics of the raw dough (i.e. water content, pH, reducing sugars and amino acid content) and on the operating conditions applied during baking (i.e. temperature, air speed, relative humidity, modes of heat transfer) [12]. It was observed that the colour of the crumb sample significantly (p <
0.05) increased in redness (a* value) and yellowness (b* value) but decreased in L* value with higher percentage of Parkia flour (Table 5). This might be attributed from
the yellow colour imparted by the Parkia flour.
Texture Profile of Breads. Hardness the bread
incorporated with 5%, 10% and 15% of Parkia flour 2.71, 2.78 and 2.93) showed no significantly differences (p > 0.05) (Table 6). High amount of protein and fiber content
[image:6.595.59.542.311.541.2]in Parkia flour (20%, 30% and 40%) bread increased the hardness value of the bread (3.14,3.63 and 3.86) as compared to both 5%, 10% and 15%, which might attributed to the high water absorption of flour. Sangnark et al. [27] reported that high fiber ingredients added into bread formulation increases the hardness of bread. Similar trend was also observed in the adhesiveness where 20%, 30% and 40% (0.07, 0.08 and 0.09) had
Table 5. Bread color analysis of the control and the blends.
Samples crust L* a* b*
100 WF 67.63 ± 0.31a 12.74 ± 0.22g 37.46 ± 0.32a
95% WF + 5% PF 58.95 ± 1.21b 16.53 ± 0.34f 28.86 ± 0.42b
90% WF + 10% PF 53.48 ± 0.18c 17.44 ± 0.51e 23.19 ± 0.34d
85% WF + 15% PF 49.63 ± 0.23d 18.53 ± 0.31d 18.73 ± 0.21e
80% WF + 20% PF 46.87 ± 0.22e 19.73 ± 1.18c 14.03 ± 0.34f
70% WF + 30% PF 43.98 ± 1.15f 20.75 ± 1.16b 10.23 ± 1.13g
60% WF + 40% PF 41.87 ± 0.35g 21.31 ± 0.31a 9.78 ± 1.31h
Samples Crumb
100% WF 73.06 ± 0.32a -0.83 ± 0.18g 11.73 ± 1.19g
95% WF + 5% PF 68.49 ± 1.19b 1.49 ± 0.51f 36.65 ± 0.42f
90% WF + 10% PF 65.93 ± 0.23c 2.16 ± 1.15e 37.63 ± 0.25e
85% WF + 15% PF 59.29 ± 0.21d 3.22 ± 1.19d 38.83 ± 0.32d
80% WF + 20% PF 55.63 ± 0.32e 3.68 ± 0.22c 40.05 ± 0.47c
70% WF + 30% PF 54.95 ± 0.32f 3.81 ± 1.17b 43.87 ± 0.24b
60% WF + 40% PF 51.93 ± 1.18g 4.08 ± 0.42a 44.26 ± 0.23a
WF: Wheat flour; PF: Parkia flour; L*: lightness, higher values indicate lighter colour, a*: redness, b*: yellowness; higher colour intensity is indicated by higher values. Different letters on same column represent statistically significant (p < 0.05) difference between means.
Table 6. Texture profile analysis of breads.
Samples Hardness Cohesiveness Elasticity Chewiness Adheviness
100% WF 2.18 ± 0.12g 0.57 ± 0.27a 0.82 ± 0.16a 1.89 ± 0.13a 0.03 ± 0.35f
95% WF + 5% PF 2.71 ± 1.14f 0.42 ± 1.12f 0.73 ± 1.11d 0.95 ± 1.12d 0.04 ± 1.18d
90% WF + 10% PF 2.78 ± 1.16e 0.46 ± 0.21e 0.63 ± 0.28e 0.88 ± 0.14f 0.07 ± 0.22d
85% WF+15% PF 2.93 ± 0.61d 0.41 ± 0.15f 0.74 ± 0.35d 1.01 ± 0.24b 0.04 ± 1.16e
80% WF + 20% PF 3.14 ± 1.15c 0.51 ± 0.23c 0.76 ± 1.14c 0.97 ± 0.26ca 0.07 ± 0.13c
70% WF + 30% PF 3.63 ± 0.32b 0.53 ± 1.11b 0.81 ± 0.17a 0.93 ± 0.14e 0.08 ± 1.16b
60% WF + 40% PF 3.86 ± 1.18a 0.49 ± 0.24d 0.79 ± 0.53b 0.96 ± 0.26cd 0.09 ± 0.54a
[image:6.595.57.540.589.725.2]Table 7. Sensory score of bread enriched with wheat flour in bread at various amounts.
Samples Appearance Taste Texture Aroma Overall acceptability
100% WF 95%WF + 5% PF 90%WF + 10% PF 85%WF + 15%PF 80%WF + 20%PF 70%WF + 30%PF 60%WF + 40%PF
4.25 ± 0.21a 3.56 ± 0.13d 3.65 ± 0.51c 4.00 ± 0.15b 3.20 ± 0.25e 3.00 ± 0.18f 2.75 ± 0.25g
4.13 ± 0.13a 3.93 ± 0.20d 3.99 ± 0.35c 4.04 ± 0.26b 3.15 ± 0.23e 3.10 ± 0.11f 2.50 ± 0.17g
4.00 ± 0.22a 3.85 ± 0.31d 3.92 ± 0.23c 3.93 ± 0.23b 3.25 ± 0.15e 3.20 ± 0.25f 2.87 ± 0.21g
4.69 ± 0.20a 3.78 ± 0.17d 3.80 ± 0.27c 3.82 ± 0.19b 3.35 ± 0.18e 3.30 ± 0.21f 2.40 ± 0.33g
4.85 ± 0.13a 3.93 ± 0.21d 3.98 ± 0.14c 4.04 ± 0.32b 3.25 ± 0.44e 3.15 ± 0.18f 2.55 ± 0.21g
WF: Wheat flour; PF: Parkia flour; Different letters on same column represent statistically significant (p < 0.05) difference between means.
significantly higher (p < 0.05) adhesiveness than 5%, 10% and 15% (0.03, 0.06 and 0.06). The elasticity of ratio (95:5 to 60:40) 0.63 to 0.98 were significantly higher (p < 0.05) than control wheat flour (0.46). The highest value of the elasticity of bread among the samples can be attributed to the reduction of wheat flour resulting from dilution of Parkia flour structure formation in the ratio. This reduction in Parkia flour structure contributes to the reduction in elasticity. Addition of 5%, 10% and 15% Parkia flour into the bread did not have any effect on the elasticity of bread that 20%, 30% and 40%. It can be concluded that lowest ratio affects the bread and results low elasticity and expansion of the dough. In this study, the cohesiveness and chewiness decreased with substitution of Parkia flour in wheat bread, control (0.57), 5% to 40% (0.42 to 0.53) and control (1.89), 5% to 40% (0.93 to 1.03) respectively. Parkia flour content was also reduced by other components, such as non-wheat flour and dietary fiber, protein which cause an adverse effect on the bread texture.
Sensory Evaluation. Organoleptic properties of the
Parkia supplemented bread are present in (Table 7). No
Significant difference (p < 0.05) was observed between the 0% Parkia bread and those fortified with 5% - 15% Parkia flour in all the quality attributes analyzed. How- ever, very low sensory mean scores was observed in the bread samples with 20%, 30% and 40% Parkia flour, with appearance, taste, texture, aroma and overall acceptability. The result of the sensory evaluation indicated significant (p < 0.05) difference between 100% wheat flour bread (control) and those fortified with 20%, 30% and 40% Parkia flour in all the quality attributes analyzed. Bread 5%, 10%, and 15% Parkia flour did not differ significantly from 100% wheat flour bread in appearance, taste, aroma and overall acceptability, it compared favorably well with the control (100%) bread in all these qualities. Bread with 40% Parkia flour addition had significantly poor appearance, texture and pronounced Parkia taste and aroma. Although, the 5% to 15% Parkia flour fortified bread had low rating in most of the quality
attributes, they were however, acceptable to the panelist. Generally, the Parkia flour gave the bread a unique taste and texture that make them taste and feel like cake-bread particularly the 20%, 30% and 40% Parkia flour formulation. Data of sensory evaluation (Table 7 )
indicated that the consumer preferred the crust color of the 5% to 15% Parkia flour bread and the control samples were not significantly different (p > 0.05).
5. CONCLUSIONS
The investigation shows that there was significant improvement in the bread resistant starch content and nutritional quality on addition of Parkia flour. This was evident in the significant increase of 18.52 - 22.28 (200℃
at 45 min) with 31.74 - 35.05 (130℃ at 90 min) in the resistant starch content of fortified bread samples. The addition of 5%, 10% and 15% Parkia flour resulted in bread with high loaf volume and good overall acceptability. The sensory evaluation also indicated that 5%, 10% and 15% Parkia flour bread was the most acceptable bread. A functional food that combines many nutritional benefits of wheat flour supplemented with Parika flour may be proposed to cater for a set of consumers whose health has been compromised such as those suffering from malnutrition, diabetes and obesity.
6. ACKNOWLEDGEMENTS
This article is supported by 111 project-B07029 and PCSIRT062, China.
REFERENCES
[1] Grabitske, H.A. and Slavin, J.L. (2009) Gastrointestinal
effects of low-digestible carbohydrates. Critical Reviews
in Food Science and Nutrition, 49, 327-360.
doi:10.1080/10408390802067126
[2] Nugent, A.P. (2005) Health properties of resistant starch.
Nutrition Bulletin, 30, 27-54. doi:10.1111/j.1467-3010.2005.00481.x
[3] Cummings, J.H., Beatty, E.R., Kingman, S.M., Bingham,
S.A. and Englyst, H.N. (1996) Digestion and physiologic
al properties of resistant starch in human bowel. British
Journal of Nutrition, 75, 733-747. doi:10.1079/BJN19960177
[4] Amadou, I., Le, G.W., Shi, Y.H., Gbadamosi, O.S.,
Kamara, M.T. and Sun, J. (2011)Optimized Lactobacillus
plantarum Lp6 solid-state fermentation and proteolytic hydrolysis improve some nutritional attributes of soybean
protein meal. Journal Food Biochemistry, 35, 1686-1694.
doi:10.1111/j.1745-4514.2010.00493.x
[5] Goni, L., Garcia-Dia Manas, E. and Saura-Calixto, F.
(1996) Analysis of resistant starch: a method for foods
and food products. Food Chemistry, 56, 445-449.
doi:10.1016/0308-8146(95)00222-7
[6] Puncha-arnon, S. and Uttapap, D. (2013) Rice starch vs.
rice flour: Differences in their properties when modified
by heat–moisture treatment. Carbohydrate Polymers, 91,
85-91.doi:10.1016/j.carbpol.2012.08.006
[7] Aravind, N., Sissons, M., Fellows, C.M., Blazek, J. and
Gilbert, E.P. (2013) Optimisation of resistant starch II and III levels in durum wheat pasta to reduce in vitro digestibility while maintaining processing and sensory
characteristics, Food Chemistry, 136, 1100-1109.
doi:10.1016/j.foodchem.2012.08.035
[8] Liljeberg, H., Bjorck, I.(1994) Bioavailability of starch in
bread products. Postprandial glucose and insulin responses in healthy subjects and in vitro resistant starch content.
European Journal Clinical Nutrition, 48,151-163.
[9] kerberg,A.A., Liljeberg, H., Bjorck, I. (1998)Effects of
amylose/amylopectin ratio and baking conditions on
resistant starch formation and glycaemic indices, Journal
of Cereal Science, 28, 71–80.doi:10.1006/jcrs.1997.0173
[10] Baljeet S.Y.(2011) Effect of frying, baking and storage
conditions on resistant starch content of foods, British
Food Journal. 113, 710-719.
doi:10.1108/00070701111140061
[11] Škrbic´, B., Milovac, S., Dodig, D. and Filipcˇev, B.
(2009) Effects of hull-less barley flour and flakes on bread nutritional composition and sensory properties,
Food Chemistry.115,982-988. doi:10.1016/j.foodchem.2009.01.028
[12] Schoenlechner, R., Szatmari, M., Bagdi, A., Tömösközi,
S. (2013) Optimisation of bread quality produced from
wheat and proso millet (Panicum miliaceum L.) by
adding emulsifiers, transglutaminase and xylanase, LWT
–Food Science and Technology, 51, 361-366. doi:10.1016/j.lwt.2012.10.020
[13] Mubarak, A.E. (2001) Chemical, nutritional and sensory
properties of bread supplemented with lupin seed (Lupinus albus) products. Molecular Nutrition Food﹠ Research, 45, 241-245.
[14] Ihegwuagu, N.E., Omojola, M.O.,Emeje, M.O. and Kunle,
O.O.(2009) Isolation and evalution of some physicochemical properties of parkia biglobosa starch.
Pure and Applied Chemistry, 81, 97-104. doi:10.1351/PAC-CON-08-01-21
[15] AACC,The American Association of Cereal Chemists,
Cereal Laboratory Methods methods 08-12, 15-A, 32-10, 46-13, 61-01, St. Paul. MN, 2000.
[16] Siddhuraju, P. and Becker, K. (2001) Effect of various
domestic processing methods on antinutrients and in vitro protein and starch digestibility of two indigenous varieties of indian tribal pulse, mucuna pruriens Var.
Utilis. Agricultural and Food Chemistry, 49,3058-3067.
doi:10.1021/jf001453q
[17] Ptitchkina, N.M., Novokreschonova, L.V., Piskunova,
G.V. and Morris, E.R. (1998) Large enhancements in loaf volume and organoleptic acceptability of wheat bread by small additions of pumpkin powder: possible role of
acetylated pectin in stabilising gas-cell structure, Food
Hydrocolloids, 12, 333-337. doi:10.1016/S0268-005X(98)00024-1
[18] Tribess, T.B., Hernández-Uribe, J.P., Méndez-Montealvo,
M.G.C. Menezes, E.W., Bello-Perez, L.A. and Tadini, C.C. (2009)Thermal properties and resistant starch
content of green banana flour (Musa cavendishii)
produced at different drying conditions. LWT-Food
Science Technology, 42, 1022-1025.
doi: 10.1016/j.lwt.2008.12.017
[19] Noor Aziah, A.A., Ho, L.H., Noor Shazliana, A.A. and
Rajeev, B. (2012) Quality evaluation of steamed wheat bread substituted with green banana flour, International.
Food Research Journal, 19, 869-876.
[20] Okaka, K.C. (2005) Handing, storage and processing of
plants foods. O C Jianco. Acad. Publish, Enugu, Nigeria. 250-270.
[21] Kim, S.K.(1996) Instant Noodle, In: Kruger, J.E., Matsuo
R.B. and Dick, J.W., EDS., Pasta and Noodle Technology.
American Association of Cereal Chemists, Inc. Saint Paul, MN, USA, 195-225.
[22] Abdel-kader, Z.M. (2001) Enrichment of Egyptian balady
bread part 2. Nutritional values and biological evaluation of enrichment with decortiated cracked broad bean flour (Viaci Faba L), Molecular Nutrition﹠Food Research, 45,
31-34.
[23] Fayle, S.E. and Gerrard, J.A. (2002) Consequences of the
maillard reaction in food. The Maillard Reaction, UK:
Royal Society of Chemistry, 9-19.
doi:10.1039/9781847552105-00009
[24] Ptitchkina, N.M., Novokreschonova, L.V., Piskunova,
G.V. and Morris, E.R. (1998) Large enhancements in loaf volume and organoleptic acceptability of wheat bread by small additions of pumpkin powder: possible role of
acetylated pectin in stabilising gas-cell structure, Food
Hydrocolloids, 12, 333-337.
doi:10.1016/S0268-005X(98)00024-1
[25] Touyarou, P. ,Sulmont-Rossé, C., Gagnaire, A., Issanchou,
S. and Bronde, L. (2012) Monotonous consumption of fibre-enriched bread at breakfast increases satiety and
influences subsequent food intake. Appetite, 58, 575-581.
[26] Kale, C.K., Kotecha, P.M., Chavan, J.K. and Kadam, S.S.
(2002)Effect of processing conditions of bakery products
on formation of resistant starch, Food Science Technology,
39, 520-524.
[27] Sangnark, A. and Noomhorn, A. (2004) Chemical,
physical and baking properties of dietary fibre prepared
from rice straw, Food Research International, 37,
![Table 2. Chemical composition of wheat flour (WF), Parkia flour (PF) and their blends [% db]](https://thumb-us.123doks.com/thumbv2/123dok_us/7790844.725714/4.595.57.538.596.715/table-chemical-composition-wheat-flour-parkia-flour-blends.webp)