Method of Wireless Sensor Network Node Deployment
for the Emergency Environment
https://doi.org/10.3991/ijoe.v13i08.7422
Liang Ge!!"
Sichuan University, Chengdu, China Southwest Petroleum University, Chengdu, China
Qin Wang, Pan Hu, Ze Hu
Southwest Petroleum University, Chengdu, China
JunBi Liao
Sichuan University, Chengdu, China
Abstract—Incidents could not always be avoided, resulting in significant losses for the state property and people's safety. Effective monitoring of inci-dents is becoming more and more important. Wireless sensor networks (WSNs) are widely used in environmental monitoring. On the basis of the existing wire-less sensor network node deployment model, a network node deployment model was proposed, which was used in the monitoring of unexpected accidents. The model area was divided into the core area and the evacuation area, and different monitoring nodes deployment plans were applied in different areas. The simula-tion experiment is carried out by MATLAB, and the simulasimula-tion results of the node coverage are obtained. Results show that the model for the practical appli-cation of the node deployment provides an effective deployment plan, as well as offers a strong basis for real-time monitoring and post-accident emergency evacuation.
Keywords—Sudden accident, WSN node deployment model, PSO algorithm, the virtual force algorithm, MATLAB simulation.
1
Introduction
With the rapid development of logistics industry, some storage items are explosive, burnable, toxic and corrosive, so there will be a great risk of fire. Once the warehouse catches fire, it is hard to get a panoramic view of the fire area. As a consequence, staff cannot be evacuated from the fire spread zone properly and swiftly, and rescue team cannot implement the rescue operations effectively. The main reason is that there is no effective emergency monitoring system.
accident environment monitoring has received more attentions, it is important to ob-tain the real-time information of environment and the sudden accident spots infor-mation. Wireless sensor network technology is widely used in environmental monitor-ing, which has the advantage of low cost, low power consumption, high performance [2]. For the sensor network deployment directly affects node deployment cost and environment monitoring capability, the sensor network node deployment becomes an important part of the sensor network research, as well as the basis application prem-ise. Node deployment optimization strategy can effectively improve the quality of network deployment, as well as the quality of network communication and network lifetime. So it is important to explore the wireless sensor network node deployment for the emergency environment.
2
State of art
At present, many efforts have been made in wireless sensor network nodes de-ployment. Most deployment algorithm studies mainly focus on the incremental algo-rithm node deployment, virtual force algoalgo-rithm, the deployment algoalgo-rithm based on grid nodes, probabilistic detection model algorithm, various groups intelligent algo-rithm and other algoalgo-rithms [3-7]. Incremental algoalgo-rithm node deployment was scribed by Andrew Howard et al. in 2002 [3]. Andrew described an incremental de-ployment algorithm for mobile sensor networks. This algorithm is designed to max-imize network coverage while simultaneously ensuring that nodes retain line-of-sight relationships with one another. This algorithm does not require prior models of the environment yet is able to produce coverage results that are close to those obtained using a greedy model-based algorithm. Virtual force algorithm was described by Yi Zou et al. in 2003 [4]. Yi Zou et al. proposed a virtual force algorithm as a sensor deployment strategy to enhance the coverage after an initial random placement of sensors. A judicious combination of attractive and repulsive forces is used to deter-mine virtual motion paths and the rate of movement for the randomly-placed sensors. For a given number of sensors, this algorithm attempts to maximize the sensor field coverage. Probabilistic detection model algorithm was described by Jie Wu et al. in 2003 [5]. Jie Wu et al. focused on minimizing total moving distance and propose an optimal, but centralized solution, based on the Hungarian method. Research about nodes deployment has made great progress, but most of these researches just focus on one wireless sensor network nodes deployment algorithm. For some accident envi-ronment monitoring, using one wireless sensor network nodes deployment algorithm cannot meet the requirement of both coverage and monitoring. Monitoring model for incidents is less, so it is particularly necessary to do some research about it. In this study, a cooperative network model for dangerous environment will be proposed based on the existing wireless sensor network node deployment algorithms. This model can not only satisfy the real-time monitoring, but also meet the requirement of evacuation after accidents.
simula-tion experiment and analysis on the new model of the urgent environmental monitor-ing network. The last section summarizes the paper and gives the relevant conclu-sions.
3
A new model of emergency environmental monitoring
network
Figure 1 shows a network model based on the actual situation for dangerous envi-ronments. The red area is the core area, and yellow area is the evacuation guide area. When there is no emergency occurs, only some core monitoring nodes of in the core area work to obtain the environment information. When an emergency occurs, the optimized nodes in core area and all the warning nodes and optimized nodes in evac-uation area will be activated immediately, and collaborate with the monitoring nodes to monitor the event development and guide the evacuation according to the monitor-ing results.
Core area
Evacuating area
Monitoring nodes
Warning nodes
Fig. 1. The network model of emergency conditions
The algorithm needs to assume sensor nodes in sensor networks communication radius as twice as the coverage radius, all nodes in sensor networks is homogeneous. The target area is two-dimensional planar region, and the perception range of all sen-sor nodes is a circular region with a node as its center.
3.1 The detection model of core area
cover-age ratio. The covercover-age area covercover-age algorithm can be used to self-organizing net-work [7].
There is p point in the target area, and we assume its position is( , )x yi i . If the dis-tance between the point and the sensor node is less than the coverage radius, whered p s( , )i <r , the point p is covered by the sensor nodesi . If every position in the target area is covered by the k sets of sensor nodes and this kind of target area can be defined as k coverage [8-12].
Based on virtual force algorithm, the node stress distribution needs to be improved. The gravitational interaction between nodes is ignored, and we mainly focus on the gravitational attraction from the target mesh and nodes. The threshold of anti-collision distance is set to be the double distance dthof node single-step largest moving
dis-tance, and the collision can be avoid by repulsive force between nodes [13-15].The whole algorithm of node force expression is as follows:
The gravitation between Node Si and grid can be expressed as:
0
io A io
F = ! D if >
(1)The directions of the gravitation towards the center of the target mesh. Here, Di0is the distance from the target node Si to the grid. The repulsion between Node Si and node Sj can be expressed as:
th ij th ' ij R
ij=! D1 d1 D d
F if !
! ! " # $ $ % & ' (2) The direction of the repulsion backs to node Sj.In the formula (2), Dijis the distance
between the nodeSiand nodeSj,and dthis the threshold value of anti-collision distance.
The resultant force Fiof node Si can be expressed as follows:
!
n i j 1 = j ij ioi=F + F
F
!
(3)
In order to fully take use of the coverage rate of each node under the circumstance of no blind spot, enable nodes to fully cover the predetermined area and has the min-imum repeated cover area, the threshold value dthof ideal state of distribution between
the nodes of the distance should be 2R .
Here, the original location of the node Si is ( , )x yi i , and the updated position under the resultant force is ( ', ')x y , then:
In formula (4), Fi is the joint force in node Si, Fixand Fiyare the joint force
compo-nents in the x axis and y axis; Max step is the movable distance of node largest single step. Fth is the threshold value of node under the force. When a node forces suffered
less than this threshold value, the node does not move.
The ideal effect can be obtained based on the coverage control algorithm. It can meet the special need of coverage quality, and has a very important practical signifi-cance. In practice, the target area is divided into some areas based on characters, and each area has different coverage ratio. As the core area, it is required to be monitored completely covered, and the real-time information can be feedback. In this situation, it will produce some certain extent duplicate coverage, however, this model ensures the coverage quality while maximizes the saving cost.
3.2 The monitoring model of evacuation guiding region
Particle swarm optimization algorithm is used to simulate the behavior of popula-tion in nature [16].This algorithm does not need an strict mechanism model of prob-lem, does not need to fit a specific function, and even does not need the exact descrip-tion the problem. The PSO algorithm is improved in literature [17-20], and the inertia weight ! based on speed update formula is optimized.
The updated velocity and position formula of particle swarm optimization algo-rithm is as follows:
(
)
(
k)
id gd 2 2 k id id 1 1 k id 1 + k
id
=
!
v
+
c
r
p
x
+
c
r
p
x
v
!
!
(5)1 + k id k id 1 + k
id
=
x
+
v
x
( 6)Here, i 1,2,...,m,d 1,2,...,n= = .d is the current dimension of the target search space;
k is the current iteration; r1 , r2 is the random number between [0, 1] obeys uniform
distribution; c1, c2is the artificial learning factors; xi is the particle position vector; viis the particle velocity; piis the local optimal solution; pjis the global optimal solution.
is the inertia weight, and inertia weight generally increases with the number of iterations linearly decreases. The formula is as followings:
t
maxNumber
!
!
!
=
!
max minmax
"
"
!
(7)Evolution degree e is a reflection degree of evolution particles; it is used to indicate the degree of evolution after the each iteration of the population. The formula can be express as follows:
(
)
(
)
(
(
k 1)
)
i k i 1 k i k i 2 1 k k 1 k k
1
max
min
F
F
F
F
a
max
min
aver.p
aver.p
aver.p
aver.p
a
=
e
!!! !
!
!
!
!
!
(8)Here, and are correlation coefficient, which satisfy 0<a1, a2<1, a1+a2=1,and 1
s is the aggregation degree factor; it represents the polymerization degree of parti-cles in the each iteration of the population. The formula is:
(
)
(
k)
g k
i
k g k
i
aver.p
aver.p
max
aver.p
aver.p
min
=
s
(9)
Formula (7) can be improved by formula (8) and (9), and new formula of inertia weight can be expressed as follows:
s
!
+
e
!
!
=
!
' f!
e s (10)Here, !fis the initial value of inertia weight, !eis the evolutionary coefficient, !sis
coefficient of the adjustable polymerization degree. Generally, since 0<e<1, 0<s1,
so there is !f!!e<!'<!f+!s.
The inertia weight is set to ensure the best location will not be skipped because of large step size during the iterative algorithm process, it also can avoid the local con-vergence because of the influence of local optimal value20.The particle's velocity updated formula is as follows:
(
)
(
k)
id gd 2 2 k id id 1 1 k id ' 1 + k
id
=
!
v
+
c
r
p
x
+
c
r
p
x
v
!
!
(11)For evacuation guiding area, we pursue more communication coverage. It guaran-tees the communication of network connection by using an improved adaptive PSO algorithm, and it also promotes the coverage of wireless sensor network in some ex-tent. Compared to the PSO algorithm, adaptive PSO algorithm has good optimization ability; and this improved PSO algorithm can effectively solve the problem of algo-rithm premature. This improved PSO algoalgo-rithm realizes area monitoring by using the least node, this monitoring approach is often used in the situation of less demanding monitoring quality. The WSN network in the evacuation area will be awakened under the emergency situations. It is used to monitor the evacuation zone as well as the evacuation works.
3.3 Model using The cooperative network model for dangerous environment
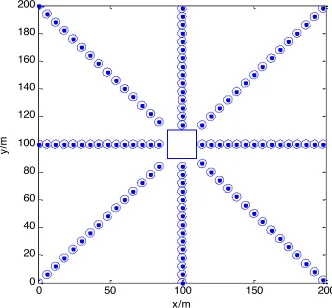
0 50 100 150 200 0
20 40 60 80 100 120 140 160 180 200
x/m
y/m
Fig. 2. The node deployment of evacuation area
These fixed nodes can be deployed in the evacuation path, and it can provide a strong basis for the selection of the best route to evacuate. It can be seen that the evacuation zone monitoring model is a hybrid algorithm model. According to the actual situation, the rectangular region can be divided into two areas, the range of coordinates for the core area is 900x110, 90y110, and the remaining part of the domain of definition is outside evacuation area. Based on the above theories, the cooperative network model under emergency can be developed by coverage ratio as follows:
(
)
!" #
A y x others P
110 y 90 110 x 900 P = P
2 1
! ! !
! (12)
Here, P1is core area coverage ratio; P2is evacuation zone coverage ratio.
4
Simulation and discussions
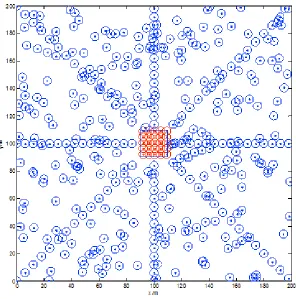
Simulation was carried out based on the cooperative network model by using MATLAB2014. The simulation result is shown in Figure 3:
Fig. 3. The simulation of emergency Model
In order to verify the advantage of cooperative network model, some simulations were taken based on different algorithms. First of all, simulations of core monitoring area were conducted to obtain the relations between coverage and the number of sen-sor nodes by using 25 nodes and different algorithms for simulation, including genetic algorithms [22], PSO [23], fish algorithm [24], artificial bee colony algorithm [25]and used virtual force algorithm of this model.
Table 1. Coverage of various algorithmsthe core area
Algorithm algorithm Genetic Improved Particle Swarm Optimiza-tion Algorithm
Fish swarm algorithm
Artificial Bees Colony
Algo-rithm
Virtual force algorithm
From the Table 1, We can get that the virtual force algorithm can achieve 100% coverage. It has no monitoring blind spot, and users in this region can completely control the information. In reality, these nodes remain running, and monitor the real-time environmental parameters. If there is no emergency, nodes in this area can be regarded as regular environmental monitoring system.
When there is an emergency, the peripheral evacuation area of the node monitoring system is awakened; the entire monitoring area is extended to all of the monitoring area. According to the characteristics of the evacuation zone, fewer sensors are used to monitor the real-time environmental parameters. Some simulations of evacuation area were taken based on different algorithms, and the result is shown in Table 2.
Table 2. Coverage situation of various algorithmsthe evacuating area
Algorithm Improved Particle Swarm Optimization Algorithm algorithmGenetic Fish swarm algorithm Colony AlgorithmArtificial Bees
Perceptual coverage(%) 48.51 43.32 44.62 46.37
Communication
cover-age(%) 90.50 81.42 84.23 88.72
From Table 2, we can know that all these algorithms have certain optimal search ability. By using the improved PSO algorithm, premature convergence problem and sensor network optimization problem can be solved. By the improved PSO algorithm, the communication coverage rate reaches 90%, monitoring coverage reaches 48.5%. Due to the monitoring nodes in evacuation area usually dormant and it will be awak-ened in the emergency situations.
5
Conclusions
In order to monitor the unexpected accidents, a network node deployment model is proposed in this study. The following conclusions could be drawn according to the above-mentioned analysis:
1.A cooperative network model for dangerous environment is proposed based on the existing wireless sensor network node deployment algorithms. This model can not only satisfy the real-time monitoring, but also meet the requirement of evacuation after accidents.
2.In order to verify the advantage of new model, some simulations were taken based on different algorithms. The results show that the model for the practical applicati-on of the node deployment provides an effective deployment plan, as well as offers a strong basis for real-time monitoring and post-accident emergency evacuation.
6
Acknowledgment
This work was supported by the scientific research starting project of SWPUNo.
Administration of National Security (No.sichuan-0011-2016AQ,) and the Oil Gas Fire Protection Key Laboratory of Sichuan Province (No.YQXF201602) .
7
References
[1]Zhang N, Tan Z, Jin M. Research on the technology of disaster prevention and rescue in high-altitude super-long railway tunnel. Ksce Journal of Civil Engineering, 2015, Vol. 19(3) , pp.756-764. https://doi.org/10.1007/s12205-013-1248-2
[2]Liang Ge, Zhengyin Wang, Kui Deng, Qiang Zeng, Xi Wang, Xiaoshuang Chen, Junbi Liao. Research on the Oil Life Estimation and Detection Method, Journal of the Balkan Tribological Association, 2015, Vol. 21(4) , pp. 897-911.
[3]Howard A, Mataric M J, Sukhatme G S. An incremental self-deployment algorithm for mobile sensor networks. Autonomous Robots, 2002, Vol. 13(2) , pp. 113-126.
https://doi.org/10.1023/A:1019625207705
[4]Zou Y, Chakrabarty K. Sensor deployment and target localization based on virtual forc-es[A] Proc of the IEEE INFOCOM. New York,USA:IEEE, 2003, Vol. 02.pp.1293-1303. [5]Wu J, Yang S. Optimal movement-assisted sensor deployment and its extensions in
wire-less sensor networks. Simulation Modelling Practice and Theory, 2007, Vol. 15(4) , pp. 383-399. https://doi.org/10.1016/j.simpat.2006.11.006
[6]Huo Hong Wei, Gao Shuai, Yan Chao Niu, s. Indoor propagation model in wireless sensor network node based on deployment strategy. Science in China,2008, Vol. 10(9) , pp.64-69. [7]Corke P, Hrabar S, Peterson R, et al. Deployment and connectivity repair of a sensor net with a flying robot Experimental robotics IX. Springer Berlin Heidelberg, 2006, pp. 333-343.
[8]S YangF DaiM CardeiJ WuF Patterson. On connected multiple point coverage in
wireless sensor networks. Journal of Wireless Information Networks, 2006, Vol. 13(4) , pp.289-301. https://doi.org/10.1007/s10776-006-0036-z
[9]H LiuP WanX Jia. Maximal Lifetime Scheduling for Sensor Surveillance Systems
with K Sensors to One Target. IEEE Transactions on Parallel & Distributed Systems, 2006, Vol. 17(12) , pp.1526-1536. https://doi.org/10.1109/TPDS.2006.175
[10]Liu H, Wan P, Jia X. Maximal lifetime scheduling for sensor surveillance systems with k sensors to one target. IEEE Transactions on Parallel and Distributed Systems, 2006, Vol. 17(12) , pp. 1526-1536. https://doi.org/10.1109/TPDS.2006.175
[11]Lu kezhong, Sun hongyuan. Wireless sensor networks covering the minimum set of greedy approximation algorithm.Journal of Software, 2010, Vol. 21(10) , pp.2656-2665.
[12]Wang huanzhao, Dong bei, Luo hanmei, Chen peijun, Li zengzhi. Based k- guarantee cov-ering heterogeneous sensor network node scheduling strategy. Xi'an Jiaotong University, 2008, Vol. 08, pp.940-944.
[13]Q ZhaoM Gurusamy. Connected K-target coverage problem in wireless sensor networks
with different observation scenarios. Computer Networks, 2008, Vol. 52(11) , pp.2205– 2220. https://doi.org/10.1016/j.comnet.2008.03.009
[14]Howard A, Mataric M J, Sukhatme G S. Mobile sensor network deployment using poten-tial fields: A distributed, scalable solution to the area coverage problem. Distributed au-tonomous robotic systems, 2002, Vol. 05 , pp. 299-308.
[15]Han Y H, Kim Y, Kim W T, et al. An energy-efficient self-deployment with the centroid-directed virtual force in mobile sensor networks. Simulation, 2012, Vol. 88(10) , pp. 1152-1165. https://doi.org/10.1177/0037549711411314
[17]Cong C. A Coverage Algorithm for WSN Based on the Improved PSO International Con-ference on Intelligent Transportation, Big Data and Smart City. IEEE, 2016 , pp.12-15. [18]Zhu hairong, Li ping, Cheng jianOptimization of coverage based on improved PSO
al-gorithm for WSN. Computer Engineering, 2011,Vol. 37 (8) , pp.82-84.
[19]Xiao-Jun W U, Feng L I, Yue M A, et al. The Convergence Analysis of the Uniform Search Particle Swarm Optimization. Acta Electronica Sinica, 2012, Vol. 40(6) , pp.1115-1120.
[20]Clerc M, Kennedy J. The particle swarm-explosion, stability, and convergence in a multi-dimensional complex space. IEEE transactions on Evolutionary Computation, 2002, Vol. 06(1) , pp. 58-73. https://doi.org/10.1109/4235.985692
[21]Yu H J, Zhang L, Chen D Z, et al. Adaptive particle swarm optimization algorithm based on feedback mechanism. Zhejiang Daxue Xuebao(Gongxue Ban)/Journal of Zhejiang Uni-versity(Engineering Science), 2005, Vol. 39(9) , pp.1286-1291.
[22]Zhang H, Hou J C. Maintaining sensing coverage and connectivity in large sensor net-works. Ad Hoc & Sensor Wireless Networks, 2005, Vol. 01(1) , pp.89-124.
[23]Fu hua, Han shuang. Optimization based on the distribution of new quantum genetic algo-rithm for wireless sensor network-aware nodes Sensing Technology, 2008, Vol. 07 , pp.1259.
[24]Zhou liming, Yang kehua, Zhou pan. Fish swarm algorithm based on wireless sensor net-works coverage optimization strategy. Application Research of Computers, 2010, Vol . 06 , pp.2276-2279.
[25]Gao W, Liu S. Improved artificial bee colony algorithm for global optimization. Infor-mation Processing Letters, 2011, Vol. 111(17), pp.871-882. https://doi.org/10.1016/j.ipl. 2011.06.002
8
Authors
Liang Ge (corresponding author) is a PHD student in the Department of Measur-ing and Control of Sichuan University, Chengdu 610065Chinaand also an asso-ciate professor in College of Mechanical and Electronic Engineering, Southwest Pe-troleum University, Chengdu 610500China. His research interests include wireless sensor networks and downhole instrument ([email protected]).
Qin Wang is a master candidate in College of Mechanical and Electronic Engi-neering, Southwest Petroleeum University, Chengdu 610500, China ([email protected]).
Pan Hu is a master in College of Mechanical and Electronic Engineering, South-west Petroleum University, Chengdu 610500, China([email protected]).
Ze Hu is professor in School of Electronic and Information Engineering, South-west Petroleum University, Chengdu 610500China. His research interests include wireless sensor networks and downhole instrument ([email protected]).
Junbi Liao is professor in Department of Measuring and Control, Sichuan Univer-sity, Chengdu 610065China. His research interests include wireless sensor net-works and Pipeline defect detection ([email protected]).