Munich Personal RePEc Archive
Overvalued equity and financing
decisions
Dong, Ming and Hirshleifer, David and Teoh, Siew Hong
12 July 2012
Online at
https://mpra.ub.uni-muenchen.de/40221/
July 12, 2012
Overvalued Equity and Financing Decisions
Ming Dong
aDavid Hirshleifer
bSiew Hong Teoh
cWe test whether and how equity overvaluation affects corporate financing decisions using an ex antemisvaluation measure that filters firm scale and growth prospects from market price. We find that equity issuance and total financing increase with equity over-valuation; but only among overvalued stocks; and that equity issuance is more sensitive than debt issuance to misvaluation. Consistent with managers catering to maintain over-valuation and with investment scale economy effects, the sensitivity of equity issuance and total financing to misvaluation is stronger among firms with potential growth op-portunities (low book-to-market, high R&D, or small size) and high share turnover.
Key Words: financing decisions, equity issuance, overvalued equity, behavioral finance, inefficient markets
JEL Classifications: G14, G32, M41
a
Schulich School of Business, York University, Canada; [email protected]; (416) 736-2100 ext 77945.
b
Merage School of Business, University of California, Irvine; [email protected]; (949) 824-9955.
c
Merage School of Business, University of California, Irvine; [email protected]; (949) 824-9952.
Overvalued Equity and Financing Decisions
We test whether and how equity overvaluation affects corporate financing decisions using
anex antemisvaluation measure that filters firm scale and growth prospects from market
price. We find that equity issuance and total financing increase with equity
overvalua-tion; but only among overvalued stocks; and that equity issuance is more sensitive than
debt issuance to misvaluation. Consistent with managers catering to maintain
overval-uation and with investment scale economy effects, the sensitivity of equity issuance and
total financing to misvaluation is stronger among firms with potential growth
1
Introduction
The inefficient markets approach to corporate finance predicts that a firm will raise more
capital when it can obtain a higher price relative to fundamental value for the securities
that it issues, and a relatively low price for the securities that it repurchases. By
issu-ing more the firm generates a profit for its existissu-ing shareholders, which, ceteris paribus,
increases the long-term stock price. Furthermore, overoptimistic market valuations of
investment opportunities can encourage firms to take actions to confirm such
expecta-tions (Polk and Sapienza (2009)). To do so firms may need to raise external capital.
Thus, several inefficient markets theories imply that firms will raise more capital in
re-sponse to overvaluation (Stein (1996), Baker, Stein, and Wurgler (2003), and Gilchrist,
Himmelberg, and Huberman (2005); see also the survey of Baker, Ruback, and Wurgler
(2007)).
Since equity is more sensitive than debt to firm value, misvaluation effects should be
stronger for equity than debt issuance. Greater net issuance of overvalued equity allows
the firm to maximize the profit it extracts from new securityholders. This is desirable
both for existing shareholders, and for a manager who wishes to increase long-term stock
price. Thus, the inefficient markets approach suggests that net equity issuance will be
more positively sensitive to overvaluation than net debt issuance.
Jensen (2004, 2005) argues that the effects of misvaluation on managerial behavior
are especially strong among firms whose equity is substantially overvalued. As he
dis-cusses, the managers of firms with overvalued equity face Especially intense pressure to
prepare to undertake ambitious programs of investment that cater to optimistic market
expectations about the firm’s prospects. Furthermore, overvalued firms should be eager
to raise inexpensive capital, including equity.
issuance and investment among overvalued firms derives from project scale economies.
If some investment projects have a minimum efficient scale, then overvalued firms will
tend to find it more attractive than undervalued firms to raise capital for purposes of
investment. If undervalued firms relatively often reject the relevant project, on average a
marginal increase in valuation will have relatively little effect. In contrast, among firms
whose high overvaluation encourages them to adopt the relevant project, an increase in
overvaluation encourages greater scale of issuance and investment.
We test here whether and why overvaluation causes firms to raise more net capital,
especially equity. To evaluate hypotheses for why overvaluation affects financing
deci-sion, we test how the sensitivity of issuance to misvaluation varies across valuation, size,
turnover, book-to-market, R&D, and insider trading subsamples.
Our approach to testing for misvaluation effects upon net issuance is to apply a
single overall measure of misvaluation. By definition mispricing affects market price;
the challenge is to identify a good fundamental benchmark for comparison, so that the
deviation between price and fundamental is a relatively pure measure of misvaluation.
For this purpose we use a forward-looking benchmark measure of fundamental value.
Doing so filters from market price the contaminating effects of prospects for future
investment opportunities. This is crucial, as superior investment opportunities is a
distinct cause of new financing. In this respect our misvaluation measure greatly reduces
the confounding of growth prospects and misvaluation effects that is present in past
studies that relate either past returns or current market valuations to new issues.
Specifically, we apply the residual income model of Ohlson (1995) to obtain a measure
of fundamental value, sometimes called ‘intrinsic value’ (V); we measure misvaluation by
V /P, the deviation of market price from this value. V /P is a strong predictor of future
abnormal returns (Frankel and Lee (1998) and Lee, Myers, and Swaminathan (1999)),
(2000)), and takeover-related behaviors (Dong et al. (2006)). Intrinsic value reflects not
just current book value, but a discounted value of analyst forecasts of future earnings.
We discuss the justification for V /P as a misvaluation proxy in Section 4.
In contrast, possible misvaluation measures such as Tobin’s q or equity
market-to-book rely for their fundamental benchmarks on a backward-looking value measure, market-to-book
value. Such valuation ratios therefore reflect information about the ability of the firm
to generate high returns on its book assets. Indeed, many studies have viewed Tobin’s
q or related variables as proxies for firm characteristics other than misvaluation, such
as earnings growth prospects, investment opportunities, or managerial effectiveness. So
using q or market-to-book, it is not possible to distinguish misvaluation from other
rational effects.1
Furthermore, Tobin’sqis a measure of total firm valuation; to measure
the firm’s access to cheap equity capital we need a measure of equity misvaluation.
To test for misvaluation effects, we perform both quintile sorting by V /P or B/P
ratios, and regressions that include further controls for other possible determinants
of security issuance, including growth opportunities (proxied by q or equity
book-to-market)2
, cash flow, return on assets, leverage, and firm age. We find that greater (more
positive) mispricing is associated with greater net equity issuance and total (debt plus
equity) issuance. This evidence is consistent with the hypothesis that overvaluation
induces firms to raise cheap capital, especially equity.
To test whether overvalued equity intensifies misvaluation effects, as predicted by the
catering and misvaluation/scale economies arguments mentioned above, we sort firms
based upon V /P ratios, and examine the sensitivity of net issuance to valuation within
1
To the extent that our filter is imperfect, variation in our purified measure is not fully purged of firm growth prospects. If this problem were severe we would expect V /P to have a high absolute correlation withq. In our sample, the correlation withqis not especially strong (−0.27). Nevertheless, as a precaution, we additionally control for growth prospects as proxied by book-to-market in our tests.
2
different misvaluation quintiles. Consistent with the hypothesis, we find that it is only
among overvalued stocks that equity misvaluation positively affects new issues.
If insider stock selling intensifies when insiders know their firm’s equity is overvalued
(Jenter (2005)), we expect insider net selling to be associated with equity overvaluation.
It follows from the arguments above that the sensitivity of equity issuance to V /P
should be greater when insider net selling is high. The requirement of non-missing
insider trading data severely reduces sample size, but even in this subsample we find
that the marginal effect of V /P on equity issuance is significantly greater among firms
with high net insider selling.
To probe further intowhymisvaluation affects financing decisions, we test how other
conditioning variables affect the sensitivity of net issuance to misvaluation. The
hy-potheses are developed in more depth in Section 3. In addition to sorting by the
mis-pricing proxies themselves (V /P and insider selling, as just discussed), we sort firms into
subsamples according to firm size, share turnover, B/P, and R&D.
For a manager to cater to investor overvaluation of growth opportunities, the firm
plausibly must seem to have such opportunities. Furthermore, scale economies in new
projects will only matter for firms that have potentially attractive new projects. So
both arguments imply a greater sensitivity of issuance to misvaluation among firms that
derive greater potential value from growth opportunities. We test this by comparing the
sensitivity of issuance toV /P across subsamples selected by R&D, firm size, and
book-to-market. Consistent with these hypotheses, we find that firms that are in lower quintiles
of size and book-to-market, and higher quintiles of R&D, have higher sensitivities of
equity issuance and total financing to misvaluation.3
3
Even a manager who is focused on long term value will issue more equity when it is
overvalued, as doing so generates a profit for the firm (Stein (1996)). However, to the
extent that the manager values a higher stock price per se, there is a further incentive
to issue if this enables investments that cater to optimistic investor perceptions. Since
a short term horizon makes equity financing of overvalued projects more attractive,
the sensitivity of new issues to misvaluation should be higher when managers are more
heavily focused on short-run stock prices. Following Polk and Sapienza (2009), who test
for catering in investment choices, we use turnover as a proxy for short-term focus on the
part of shareholders. We find that the sensitivity of new issues to misvaluation is higher
among high-turnover firms. This is consistent with the hypothesis that managerial
catering to investor overvaluation is one of the reasons for the misvaluation/issuance
relationship.
Owing to opposing forces of misvaluation on debt issuance, on theoretical grounds
debt issuance could either increase or decrease with misvaluation. On the one hand,
overvaluation encourages the issuance of risky debt, owing to the benefit of selling an
overvalued security, and for the sake of undertaking projects that cater to investor
op-timism. On the other hand, for a given amount of financing, greater overvaluation
causes substitution from debt to equity issuance. We find an overall insignificant
re-lation between debt issuance and overvaluation, though debt issuance decreases with
overvaluation before 1990.
Several kinds of evidence from previous research are potentially consistent with the
predictions of the inefficient markets approach to financing decisions. Evidence that new
issue firms have high market-to-book ratios and earn low post-event returns has
some-times been interpreted as a consequence of market timing by firms to exploit mispricing.
However, valuation ratios such as market-to-book are heavily influenced by firm risk
and growth rates, not just misvaluation, and hence do not isolate the effects of market
inefficiency. Furthermore, extensive controversy remains about whether apparent long
run post-issue abnormal return performance is a consequence of mispricing or of rational
risk premia.
More broadly, existing evidence suggestive of misvaluation effects on financing are
indirect, subject to severe measurement error, and/or subject to multiple interpretations.
In Section 2 we discuss more fully why existing evidence does not conclusively resolve
whether market inefficiency affects financing decisions; and why our approach provides
clearer evidence that this is the case. In addition, our tests provide new insights about
the mechanism by which market inefficiency affects financing decisions.
2
Existing Empirical Approaches to Misvaluation
and Financing Decisions
We explain here why evidence from existing studies is not conclusive about whether
inefficient misvaluation affects new financing, and how our approach provides distinct
and in some ways more direct insight about how and why overvalued equity affects
financing decisions.
The fact that new issues occur after stock price runups (Eckbo and Masulis (1995))
is potentially consistent with an effect of misvaluation on financing behavior.
How-ever, Korajczyk, Lucas, and McDonald (1991) and Bayless and Chaplinsky (1996) show
that a rational setting with asymmetric information also generates such a pattern, and
provide evidence consistent with information asymmetry effects. Furthermore, under
the rational q theory of investment (Brainard and Tobin (1968), Tobin (1969)), a stock
price runup or a high stock price relative to book value indicates an improvement in
more capital as financing.
The second type of evidence is the new issues puzzle—the return underperformance
after new securities issues, with more severe underperformance after equity issuances
than debt issuances (equity: Ritter (1991), Loughran and Ritter (1995); debt: Spiess and
Affleck-Graves (1995)); and its counterpart, overperformance after repurchases
(Lakon-ishok and Vermaelen (1990), Ikenberry, Lakon(Lakon-ishok, and Vermaelen (1995), Peyer and
Vermaelen (2009)). This evidence has stimulated debate about the methodology of
long-run abnormal return tests and the choice of risk factor benchmarks (e.g., Fama (1998),
Loughran and Ritter (2000), and Lyandres, Sun, and Zhang (2008)). In contrast,
evi-dence that the firm-level debt versus equity composition of net financing does not predict
future returns has been interpreted as opposing the hypothesis that issuance choices are
designed to exploit mispricing (Butler et al. (2011)).
A reason why the benchmark and methodological issues are so salient is that
long-run returns contain large amounts of noise associated with ex post fundamental news
that arrives about stocks over time. Our ex ante measures of misvaluation, through
imperfect, avoid this very large source of noise.
Furthermore, for the purposes of testing the causal effect of misvaluation on new
issues, conditioning on new issues themselves has the drawback that firms take actions
at the time of new issue to induce misvaluation. For example, firms engage in upward
earnings management at the time of new issues, and greater earnings management at
the time of issue is associated with more negative post-issue returns (e.g., Teoh, Welch,
and Wong (1998a, 1998b), Teoh, Wong, and Rao (1998)). By examining preexisting
misvaluation prior to the immediate new issue period, our tests focus more sharply on
how misvaluation affects financing decisions (‘market timing’), rather than the reverse
causality from planned financing choice to the firm’s decision to incite overvaluation.
capital expenditures and R&D (Gilchrist, Himmelberg, and Huberman (2005) and Polk
and Sapienza (2009); see also Titman, Wei, and Xie (2004)), and that the effects of stock
market valuations (efficient or otherwise) on investment are greater for more financially
constrained (‘equity-dependent’) firms (Baker, Stein, and Wurgler (2003)). However,
this evidence is only indirectly related to the hypothesis that greater overvaluation
in-creases equity issuance.
The fourth kind of evidence is that firms with higher measured overvaluation tend
to use equity rather than debt as a means of payment in takeovers (e.g., Dong et al.
(2006)). Although suggestive, this does not show whether equity issuance is related
to misvaluation in a general sample of firms. In fact, our findings here of misvaluation
effects on issuance are strongest among small firms, even though small firms are takeover
bidders much less frequently than large firms.
The fifth kind of evidence is that the aggregate equity share in new issues is a
nega-tive predictor of subsequent market returns (Baker and Wurgler (2000), and Henderson,
Jegadeesh, and Weisbach (2006)). This is consistent with the idea that when the stock
market as a whole is overvalued, the constituent overvalued firms substitute from debt
to equity issuance. However, this evidence does not speak to whether greater
misvalu-ation is a predictor of greater equity issuance in the cross-section of firms, and whether
misvaluation is associated with greater total (debt plus equity) issuance.
The sixth kind of evidence is that in responses to survey questions, CFOs report that
stock market valuations are an important consideration in their firms’ decision to issue
common stock (Graham and Harvey (2001)). However, this is evidence about
manage-rial perceptions, not actual misvaluation and issuance. If managers are overoptimistic
about their firms, they may wrongly perceive their firm to be undervalued. Furthermore,
practitioners seldom distinguish carefully between the ‘misvaluation’ that arises under
misval-uation that arises from market inefficiency in processing public information. In either
scenario market valuations affect financing decisions, but our purpose here is specifically
to test how market inefficiencyaffects financing decisions.
Finally, a seventh type of evidence is based upon the association of valuation ratios
with equity issuance or repurchase. Previous studies find that the market-to-book ratio
is positively associated with the probability that a firm conducts a seasoned equity
offering (Baker and Wurgler (2002), DeAngelo, DeAngelo, and Stulz (2010), and Dong
et al. (2012)). However, market-to-book reflects growth opportunities (among other
things) as well as misvaluation, so this does not establish whether market inefficiency
affects equity issuance.4
3
Hypotheses
The inefficient markets approach to corporate finance predicts that firms will design
financing strategies to exploit investor and market errors (e.g., Stein (1996), Ljungqvist,
Nanda, and Singh (2006), and the survey of Baker, Ruback, and Wurgler (2007)).
The-oretical arguments imply that firms will issue more when their equity is more overvalued
in order to exploit incoming investors, and perhaps also to maintain overly optimistic
investor perceptions about investment opportunities (Polk and Sapienza (2009), Jensen
(2005)).5
This leads to the first basic hypothesis:
Hypothesis 1: Equity issuance and total issuance increase with the degree of overval-4
DeAngelo, DeAngelo, and Stulz (2010) and Dong et al. (2012) also use ex post market-adjusted returns as an alternative proxy for misvaluation; such tests were discussed earlier. D’Mello and Shroff (2000) find that firms that are undervalued based upon a version of theV /P measure tend to engage in repurchase tender offers. A crucial difference, however, is that their measure uses ex postinformation, ex post realized earnings. So their paper is more akin to studies that documentex postabnormal returns after financing decisions than to our study, which is based upon an ex antemeasure of misvaluation.
5
uation.
As the price of equity is more sensitive than the price of debt to firm misvaluation,
we predict that the effect of misvaluation to be stronger for equity than for debt.
Hypothesis 2: The sensitivity of equity issuance to misvaluation is greater (more
pos-itive) than the sensitivity of debt issuance to misvaluation.
According to Jensen (2004, 2005), pressures to raise capital and to overinvest are
especially strong among overvalued firms. This conclusion is reinforced by an argument
based upon scale economies in investment. When a firm is undervalued, a project with
minimum efficient scale may not be funded at all, so that a decrease in undervaluation
has little effect on issuance and investment. In contrast, for an overvalued firm that is
funding such a project, greater overvaluation can encourage an increase in project scale,
thereby encouraging issuance. Thus, to evaluate these theories about why overvaluation
affects issuance, we test whether the sensitivity of equity issuance to overvaluation is
higher among overvalued firms.
Hypothesis 3: The sensitivities of equity issuance and total issuance to misvaluation
are stronger among overvalued firms than among undervalued firms.
We further hypothesize that the effect of misvaluation on issuance will be stronger
among firms with high intangibles or growth opportunities. For agency reasons,
overval-ued growth firms may be especially prone to raising equity capital to finance investments
that investors are overoptimistic about (Jensen (2005)). Furthermore, project scale
economies should be more relevant to firms with strong potential growth opportunities
(firms with low book-to-market, high R&D, or small size). We therefore have:
are stronger among growth firms (with low book-to-market ratios).
Hypothesis 5: The sensitivities of total issuance and equity issuance to misvaluation
are stronger among firms with a higher intensity of intangible assets.
Hypothesis 6 The sensitivity of equity issuance and total issuance to misvaluation is
greater among small than among large firms.
To test Hypotheses 4-6 about the effects of intangibility and growth on issuance, we
examine how the sensitivity of issuance to misvaluation varies between sets of firms that
have different prior book-to-market ratios, R&D intensity, or size as measured by book
asset value. (Polk and Sapienza (2009) also use R&D as a proxy for intangibility, and
use R&D as a conditioning variable in testing the relation of misvaluation to capital
expenditures.)
Catering to inefficient overpricing should be stronger when a firm is pressured to
have a more short-term focus (Jensen (2005), Polk and Sapienza (2009)). Therefore,
we predict that the sensitivity of equity issuance and total issuance to misvaluation
increases with turnover, a proxy for short-term investor pressure. Polk and Sapienza
(2009) find that the sensitivity of capital expenditures to discretionary accruals (a proxy
for misvaluation) is positively related to turnover. This suggests, but does not directly
establish, that short-term pressure increases the sensitivity of issuance to misvaluation.
We therefore have our final hypothesis.
Hypothesis 7 The sensitivity of equity issuance and total issuance to misvaluation is
greater among firms in which shareholders have short time horizons.
Theory is inconclusive about how overvaluation affects debt issuance. On the one
hand, overvaluation encourages the issuance of risky debt as an overvalued security,
investor optimism. On the other hand, since the equity price is more sensitive to firm
overvaluation than the price of debt, greater overvaluation should cause substitution
away from debt toward equity issuance.6
So predictions for debt corresponding to the
later hypotheses about the effects of conditioning variables are inconclusive as well.
4
Data and Methodology
Our sample includes U.S. firms listed on NYSE, AMEX, or NASDAQ that are covered
by CRSP and COMPUSTAT and are subject to the following restrictions. We require
firms to have the earnings forecast data from I/B/E/S, in addition to possessing the
necessary accounting items, for the calculation of the residual income model value to
price (V /P) ratio. Consequently, our sample starts from 1976 when I/B/E/S reporting
begins. We further require each valid firm-year observation to have non-missing equity
and debt issuance data from COMPUSTAT. Finally, we exclude financial firms (firms
with one-digit SIC of 6) and utility firms (two-digit SIC of 49). Our final sample has a
total of 58,178 firm-year observations between 1976 and 2009.
We examine the relation between firm security issuance levels (equity, debt, and
total issuance) and the (mis)valuation level of firm’s stock (measured by B/P andV /P,
described below). We measure firms’ issuances during each fiscal year, and we measure
firms’ valuation levels at the beginning of each fiscal year, using the previous month’s
valuation ratio. For example, for a firm with December fiscal year end, we relate the
valuation measure calculated at the end of December 2003 to the issuances during fiscal
year ending in December 2004.
To align firms with different fiscal year-ends in calendar time, we use June as the
cut-off and allow for a four-month gap from the fiscal year end for the accounting data
6
to be publicly available. So for calendar year t, we include firms with fiscal year ends
that occur from March of year t−1 through February of year t. In portfolio sorting
tests, we sort firms into valuation quintiles each year, calculate security issuances across
quintiles, and aggregate over time. In the regression tests we include several control
variables described below.
4.1
Issuance and Other Control Variables
We measure firms’ net equity and debt issuances using accounting data from the
COM-PUSTAT annual files. Following Baker and Wurgler (2002), equity issuance (EI) is
measured as the change in book equity minus the change in retained earnings [∆ book
equity (COMPUSTAT item CEQ) + ∆ deferred taxes (item TXDB)−∆ retained
earn-ings (item RE)] scaled by lagged assets, and debt issuance (DI) is the change in assets
minus the change in book equity [∆ total assets (item AT) −∆ book equity (item CEQ)
−∆ deferred taxes (item TXDB)] scaled by lagged assets.7
The payment of a dividend
out of retained earnings does not affect these measures, since the reduction in book
equity is offset by the reduction in retained earnings. Total equity and debt issuanceT I
is defined as EI +DI. All variables, include the ones described below, are winsorized
at the 1st
and 99th
percentile to mitigate the influence of outliers. We require that the
issuance variablesEI andDI and valuation measuresB/P andV /P to be non-missing,
but do not delete a firm-year observation simply because a certain control variable is
missing. Table 1, Panel A reports summary statistics of the issuance variables.
In the multivariate tests we control for other issuance determinants, including cash
flow [item IB + item DP + RD] scaled by lagged assets [missing RD (item XRD) is
set to zero], and Tobin’s q, defined as the market value of equity plus assets minus the
7
book value of equity [item CEQ + item TXDB] all over assets (see, e.g., Kaplan and
Zingales (1997)). In addition, we include leverage (LEV) defined as (item DLTT +
item DLC)/(item DLTT + item DLC + item SEQ), and (to control for profitability
and perhaps firm risk) return on assets (ROA) defined as earnings before depreciation
(item OIBDP) plus R&D expenses (missing RD is set to zero) scaled by total assets.
Since mature firms are less likely to issue new equity (DeAngelo, DeAngelo, and Stulz
(2010)), we control for firm age (AGE) defined as the number of years between the
beginning of fiscal year and the delisting date, truncated at 50 (results are not sensitive
to this truncation). Finally, to further control for firm risk we include the loadings of
the Fama-French three factors estimated using monthly returns over the previous five
years or at least two years due to missing observations. Except for cash flow, which is
measured over the fiscal year, all control variables are measured at the start of the fiscal
year. Table 1, Panel B presents summary statistics for these control variables.
4.2
Motivation for and Calculation of Valuation Ratios
Our use of V /P as a misvaluation proxy V /P does not require that residual income
value V be a better proxy than market price for rational fundamental value. V can be
noisy and biased (e.g., analyst forecast biases); the key is that it not fully share the
misvaluation contained in market price, so that the ratio tends to filter fundamentals
from the price.
Past literature finds thatB/P is a strong predictor of the cross-section of one-month
returns. Behavioral models imply that B/P is correlated with misvaluation, and
there-fore is a predictor of abnormal returns (see, e.g., Barberis and Huang (2001) and Daniel,
Hirshleifer, and Subrahmanyam (2001)). The use of book value in the numerator of
B/P can help filter out irrelevant scale differences to provide a more accurate proxy for
However,B/P is also potentially correlated with firm characteristics other than
mis-valuation, such as risk, growth opportunities, managerial discipline (often proxied by q
measures that are highly correlated with B/P), or the degree of information
asymme-try. Furthermore, a source of noise in B/P as a misvaluation proxy is that book value
is influenced by firm and industry differences in accounting methods.
By using a better proxy for fundamental value in the numerator, V /P goes farther
than B/P in filtering out sources of variation other than misvaluation. For example,
managerial skill and high quality corporate governance should reduceB/P by raising the
denominator relative to the numerator, whereas to a first approximation these should
not affect V /P.
We calculate B/P as a ratio of equity rather than total asset values, as it is equity
rather than total misvaluation that should matter for corporate investment decisions; a
similar point applies forV /P. This would be the case, for example, for a firm that issues
overvalued stock rather than bonds to finance an investment project. Also, as in Dong et
al. (2006), our focus is on market inefficiency, so we measure market misvaluation relative
to publicly available information. We therefore calculate our misvaluation proxies solely
using ex ante information (current price, book value, and analyst forecasts).
Several findings suggest thatV /P is a proxy for mispricing. Lee, Myers, and
Swami-nathan (1999) find that aggregate residual income values predict one-month-ahead
re-turns on the Dow 30 stocks better than aggregate B/P. Frankel and Lee (1998) find
that V is a better predictor than book value of the cross-section of contemporaneous
stock prices, and that V /P is a predictor of the one-year-ahead cross-section of returns.
Ali, Hwang, and Trombley (2003) report that the abnormal returns associated with high
V /P are partially concentrated around subsequent earnings announcements, and that
V /P predicts future returns significantly even after controlling for characteristics such as
regres-sions of returns on V /P, B/P, size, and 1-year past return, V /P is a stronger predictor
than B/P of future returns.
Residual income value has at least two important advantages over book value as
a fundamental measure. First, it is invariant to accounting treatments (to the extent
that the ‘clean surplus’ accounting identity obtains; see Ohlson (1995)). Second, it
supplements the backward-looking information contained in book value with the
forward-looking information contained in analyst earnings forecasts.
In our sample, the correlation ofB/P withV /P is fairly low, 0.16, soV /P potentially
offers useful independent information about misvaluation. This is to be expected, as
much of the variation in book/market arises from other sources such as differences in
growth prospects or in managerial discipline.
Turning to procedure, toB/P, each month for each stock, book equity (Item 60) is
measured at the end of the prior fiscal year.8
This is divided by market value of equity
measured at the end of the month.
Our estimation procedure forV /P is similar to that of Lee, Myers, and Swaminathan
(1999). For each stock in month t, we estimate the residual income model (RIM) price,
denoted by V(t). Under“clean surplus” accounting, the change in book value of equity
equals earnings minus dividends, the intrinsic value of firm stock is equal to book value
plus the discounted value of an infinite sum of expected residual incomes (Ohlson (1995)),
V(t) =B(t) +
∞
X
i=1
Et[{ROE(t+i)−re(t)} B(t+i−1)]
[1 +re(t)]i
,
whereEtis the expectations operator,B(t) is the book value of equity at timet(negative
B(t) observations are deleted), ROE(t+i) is the return on equity for period t+i, and
re(t) is the firm’s annualized cost of equity capital.
8
For estimation, the above infinite sum is replaced by a finite series ofT −1 periods,
plus an estimate of the terminal value beyond periodT. This terminal value is estimated
by viewing the periodT residual income as a perpetuity. Lee, Myers, and Swaminathan
(1999) report that the quality of their V(t) estimates was not sensitive to the choice of
the forecast horizon beyond three years. Of course, the residual income valuation V(t)
cannot perfectly capture growth. However, since V reflects forward-looking earnings
forecasts, a large portion of the growth effects contained in B/P should be purged from
V /P.
We use a three-period forecast horizon:
V(t) = B(t) + [f
ROE
(t+ 1)−re(t)]B(t)
1 +re(t)
+[f
ROE
(t+ 2)−re(t)]B(t+ 1)
[1 +re(t)]2
+[f
ROE
(t+ 3)−re(t)]B(t+ 2)
[1 +re(t)]2re(t)
, (1)
where fROE
(t +i) is the forecasted return on equity for period t+i, the length of a
period is one year, and where the last term discounts the period t+ 3 residual income
as a perpetuity.9
Forecasted ROE’s are computed as
fROE(t+i) = f
EP S
(t+i) ¯
B(t+i−1), where ¯B(t+i−1)≡
B(t+i−1) +B(t+i−2)
2 ,
and wherefEP S
(t+i) is the forecasted EPS for period t+i.10
We require that each of
these fROE
’s be less than 1.
Future book values of equity are computed asB(t+i) =B(t+i−1)+(1−k)fEP S
(t+i),
where k is the dividend payout ratio determined by k = D(t)/EP S(t), and D(t) and
9
Following Lee, Myers, and Swaminathan (1999) and D’Mello and Shroff (2000), in calculating the terminal value component of V we assume that expected residual earnings remain constant after year 3, so that the discount rate for the perpetuity is the firm’s cost of equity capital.
10
EP S(t) are respectively the dividend and EPS for period t. Following Lee, Myers, and
Swaminathan (1999), if k < 0 (owing to negative EPS), we divide dividends by (0.06×
total assets) to derive an estimate of the payout ratio, i.e., we assume that earnings are
on average 6% of total assets. Observations in which the computed k is greater than 1
are deleted.
We consider as alternative models for the annualized cost of equity,re(t) the CAPM
and the Fama-French three-factor model. There is no clear consensus in the literature
about whether the three-factor model primarily captures risk or mispricing (Daniel and
Titman (1997)), so we report findings based upon the CAPM.
Specifically, the annualized cost of equity,re(t) is determined For each firm using the
CAPM, where the time-t beta is estimated using the trailing five years (or, if there is
not enough data, at least two years) of monthly return data. The market risk premium
assumed in the CAPM is the average annual premium over the riskfree rate for the
CRSP value-weighted index over the preceding 30 years. Any estimate of the CAPM
cost of capital that is outside the range of 5%-25% (about 12% of our estimates) is
winsorized to the relevant boundary of this range. Previous studies have reported that
the predictive ability of V /P was robust to the cost of capital model used (Lee, Myers,
and Swaminathan (1999)) and to whether the discount rate was allowed to vary across
firms (D’Mello and Shroff (2000)). The results using expected returns based on the
Fama-French three-factor model, and (following D’Mello and Shroff (2000)) by using
the alternative constant discount rate of 12.5% are similar to those reported here.
Residual income model valuations have been found to be too low on average, so the
benchmark for fair valuation is not equal to 1 for V /P. The downward bias is even
stronger for B/P, as book value that does not reflect current growth expectations. Our
tests focus on relative comparisons of valuation proxies across firms and time, with higher
Panel C of Table 1 reports summary statistics for the two valuation ratios. We
retain negative V values caused by low earnings forecasts, as such cases should also be
informative about overvaluation. We use V /P as a measure of undervaluation (rather
thanP/V as a measure of overvaluation), because negative values ofP/V should indicate
over- rather than under- valuation. For consistency we similarly use B/P rather than
P/B. Removing negative V /P observations (about 6% of the sample) tends to reduce
statistical significance without materially altering the main results.
In addition to examining the relation between security issuance and stock market
misvaluation in the full sample, we perform tests conditioned upon potential
determi-nants of the sensitivity of equity issues to misvaluation, as motivated by the hypotheses
in Section 3. In addition to conditioning on V /P and B/P themselves, we condition on
the firm’s R&D intensity, measured by the firm’s previous-fiscal-year R&D expenditures
scaled by lagged assets; firm size (total assets); share turnover (monthly trading volume
as a fraction of number of shares outstanding); and net insider selling which is available
to a small subset of the sample.
Panel D of Table 1 reports summary statistics for these conditioning variables. Total
assets is not highly correlated with either turnover or R&D (lower than 0.07 correlation),
but turnover and R&D have a correlation of 0.22.
4.3
Time Patterns in Issuances and Valuations
Table 2 reports yearly descriptive statistics for the sample during 1976-2009. Prior to
1990, debt issuance exceeds equity issuance in every year but 1983. Equity issuances
overtake debt issuances in the 1990s, and during most of the years 2000-2009, equity
issuances exceed debt issuances.
Before 1986 total issuance (combined net issuance of equity and debt, T I) is less
larger portion of firms’ total financing. Each year after 1992 except for 2009, external
financing exceeds internal cash flows, with a peak in the late 1990s and early 2000s.
Residual earnings adds value to stocks on average, as reflected in the V /P mean
(median) of 0.65 (0.57) exceeding the B/P mean (median) of 0.62 (0.45). There is a
strong time trend in valuation; mean and median V /P are lower than mean and median
B/P in each year before 1985. However, after 1991, both the mean and median V /P
are higher than B/P each year except for 2001-2002, on the heels of the collapse of the
NASDAQ boom, and the last three years of the sample period, which are affected by
the global financial crisis.
It is intriguing that stock valuation was low in the early part of the sample period,
when equity issuance is low compared to debt issuance. In the latter half of the sample
(excepting the years following the collapse of the technology and real estate booms),
valuations are high and equity issuance generally exceeds debt issuance. Although not
the focus of this paper, these patterns are potentially consistent with aggregate market
timing, wherein firms favor equity issuance when they are overvalued.
5
How Misvaluation Affects Issuances: Cross-Sectional
Tests
We next test whether misvaluation affects debt and equity issuance based on univariate
and two-way sorts of firms according to valuation measures; multivariate regression tests
are provided in Section 6.
5.1
Univariate Sorts
We first describe univariate tests. Each year, firms are grouped into quintile portfolios
according to either B/P or V /P of the month preceding each fiscal year start. The
cross-sectional, and therefore not driven by common time-series swings in market valuation
and external financing. Each year mean issuance levels are computed for each quintile.
Finally, the time-series mean of the issuances for each quintile is computed.
Table 3 reports how under- or over- valuation is related to equity and debt net
issuances. Mean values of B/P or V /P, and the issuance variablesEI, DI, the sum of
the two issuances (T I), and their differences between top and bottom valuation firms
are reported. Also reported are the mean and t-statistic (corrected for autocorrelations
up to three lags per Newey and West (1987)) of the issuance-valuation sensitivities βBP
and βV P, defined as the ratios of interquintile spread in issuance to the spread inB/P
or V /P for each issuance category.
Measuring valuation by B/P, it is evident that high-valuation firms issue more of
both equity and debt. Both equity and debt issuances (EI and DI) increase
mono-tonically with valuation; the most overvalued quintile measured by B/P issues 13.66%
(10.75%) more in equity (debt) than the most undervalued quintile. All these quintile
differences are highly statistically significant, with t-statistics of 5.04 or greater.
The B/P evidence could reflect the effects of either misvaluation or profit growth
prospects. Therefore, to test for misvaluation effects, we rely more on the purified
misvaluation measure, V /P.
Consistent with Hypothesis 1, using the V /P measure, overvalued firms issue more
equity than undervalued firms; the inter-quintile difference in EI is 13.39% (t = 4.15).
Furthermore, consistent with Hypothesis 3, the effect is strongest in high overvaluation
quintiles. For example, a move from the most overvalued V /P quintile (quintile 1) to
quintile 2 is associated with a drastic drop in the level ofEI, from 16.02% to 6.76%; this
compares with a much narrower gap in EI between the bottom two valuation quintiles
(−0.13%, the negative difference indicating a slight nonmonotonicity).
while much weaker than when B/P is used as valuation measure, is still significant
(3.23%, t = 3.78). Consistent with Hypothesis 2, the sensitivity of equity issuance to
misvaluation is much greater than the sensitivity of debt issuance (13.39%>3.23%).
It follows that overvalued firms have much greater total issuance than undervalued
firms. T I for the most overvalued quintile firms is 25.83%, much higher than that of the
most undervalued firms (9.21%), consistent with Hypothesis 1.
The conclusions based on issuance-valuation sensitivity ratios are similar. For
exam-ple, measuring valuation by V /P, the issuance-valuation sensitivity ratio (βV P) is 9.25
for EI, and 2.73 for DI, both statistically significant.
Overall, the evidence from the one-way sorts is consistent with the hypothesis that
firms respond to higher inefficient valuation by issuing more equity and raising more
funds in total. Furthermore, the evidence that this effect is concentrated among
over-valued firms is consistent with the explanation suggested by Jensen (2004, 2005) that
overvalued firms cater to the market’s overvaluation of the firm’s investment
opportu-nities, and to the alternative hypothesis that overvaluation allows firms to exploit scale
economies in investment.
5.2
Two-Way Sorts
In V /P, intrinsic valueV purges expectations about earnings growth from market price
imperfectly, since analyst forecasts are noisy proxies for market expectations, and
be-cause we possess forecasts only for a few years forward. Since book value is not
forward-looking, as compared to V /P, B/P is relatively heavily weighted toward information
about growth prospects as compared with misvaluation (see, e.g., the model of Daniel,
Hirshleifer, and Subrahmanyam (2001)). Therefore, as a more stringent test for
mis-valuation effects, we test the relation between V /P and issuance after controlling for
misvaluation.
For our 2-way sorts, each year, firms are sorted into quintile portfolios according to
the beginning-of-fiscal-yearB/P, and independently, onV /P. The intersection of these
quintiles creates 25 BP-VP portfolios. Mean security issuance is computed each year for
each portfolio, and then the time-series mean for each quintile is computed.
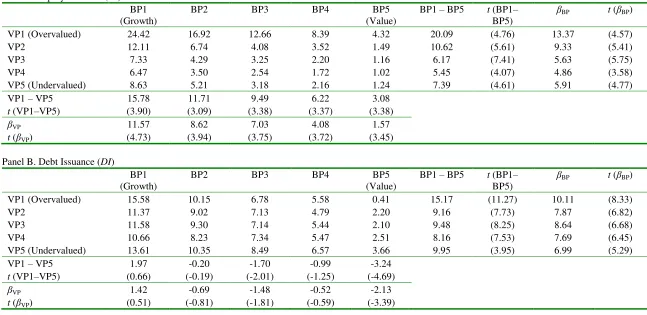
Table 4 reports the time-series means of equity, debt, and total issuance for each
portfolio. We also report the inter-quintile issuance difference along BP and VP and
the mean issuance-valuation sensitivity ratios βBP and βVP as defined in the univariate
tests, and the associated t-statistics.
Panel A confirms the findings for equity issuance of the one-way sorts. For givenB/P,
greater overvaluation is associated with greater equity issuance, and misvaluation affects
issuance mainly among firms with overvalued equity as measured byV /P. Furthermore,
consistent with Hypothesis 4, the effect of misvaluation on equity issuance is strongest
among growth firms.
In contrast, Panel B shows that controlling for B/P affects the results for debt
issuance. In the two-way sorts, overvalued firms tend to issue less debt, especially
among value firms (high B/P), in contrast to the univariate result. Specifically, among
value firms, it is undervalued firms that tend to issue more debt. Since the two-way
sorts are more controlled, we place greater faith in the findings here.
Among growth firms in columns BP1 and BP2, the relation between DI and V /P
is U-shaped – among growth firms, both the most under- and overvalued firms tend to
issue more debt than the medium-valued firms. This may reflect the opposing effects
described in the hypothesis section–a greater absolute benefit to issuing risky debt when
the firm is more overvalued, but a lower benefit relative to issuing equity.11
11
Finally, Panel C shows that the results for total issuance are consistent with the
univariate results. For example, T I is strongly increasing with overvaluation among
growth firms (BP1 and BP2). This reflects the fact that the effect of misvaluation on
EI in the two-way sorts is much stronger than the (more complex) pattern for DI.
6
Regression Tests
Both to test the robustness of the basic finding that misvaluation affects issuance, and to
test hypotheses for why this is the case, we perform multivariate analysis with additional
controls. To control more fully for growth, risk, and other possible interfering effects, in
addition toB/P, we control for Tobin’sq, cash flow scaled by lagged assets, ROA,
lever-age, firm lever-age, the Fama-French three-factor loadings, and two-digit SIC major industry
indicators as defined by Moskowitz and Grinblatt (1999).
Table 5 reports the results of panel regressions with EI, DI, and T I as dependent
variables, wheret-statistics are based on standard errors clustered by both year and firm
per Petersen (2009), as in DeAngelo, DeAngelo, and Stulz (2010). For each dependent
variable, we report the results of three specifications for the independent variables: (1)
B/P and controls, (2) V /P and controls, and (3) B/P, V /P, and controls (dropping q
sinceqandB/P capture similar information). This lets us evaluate whetherV /P has
in-cremental explanatory power as a misvaluation measure after controlling forB/P. This
provides a fairly stringent test for misvaluation, as distinct from the earnings growth
fun-damentals that are correlated with book/market, because B/P can potentially extract
part of the misvaluation effect fromV /P. We draw our main inference from specification
(3), the more stringent test of the misvaluation hypothesis.
6.1
Full Sample Tests
In the full sample, Hypothesis 1 predicts that equity and total net issuances increase as
overvaluation increases. Hypothesis 2 predicts that the sensitivity of equity issuance to
misvaluation is higher than that of debt issuance.
In Table 5, consistent with Hypothesis 1, overvalued firms issue more equity; the
coefficient of −2.58 (t = −4.78) on V /P in specification (3) indicates that V /P is a
significant negative predictor of EI. This is consistent with the conclusion of the 1-way
and 2-way portfolio tests. Furthermore, the inclusion of both B/P and V /P tends to
increase the significance of both variables. The coefficient on V /P in specification (3) is
stronger than in specifications (1) or (2), indicating that growth effects do not explain
the ability of misvaluation as measured by V /P to predict equity issuance.
In the DI regressions, the coefficient on V /P is insignificant and close to zero,
in-dicating that overvaluation has no clear effect on the propensity to issue debt. This
is consistent with Hypothesis 2, which predicts that debt issuance is not as positively
sensitive to overvaluation as equity issuance. The lack of a relation betweenDI and
over-valuation suggests a relatively strong substitution from debt issuance to equity issuance
as overvaluation increases or undervaluation decreases.
Although not crucial for the main hypotheses of this paper, it is interesting to
con-trast the finding that greater overvaluation is not associated with greater debt issuance
with the evidence of Spiess and Affleck-Graves (1999) about post-debt-issuance returns.
Based on the finding that debt issuers earn lower stock returns in the years subsequent
to issuance, they conclude that debt issuers are overvalued. Also, although we do not
perform equity share tests, our findings are in the spirit of aggregate level evidence that a
high equity share in new issues (a variable that is motivated by the substitution by
Wurgler (2000), and Henderson, Jegadeesh, and Weisbach (2006)) more than firm-level
tests that do not find such effects (Butler et al. (2011)). Of course, a large literature
debates the validity of alternative benchmarks and return calculation methods for
long-run return studies (e.g., Fama (1998), Loughran and Ritter (2000)). More importantly,
our tests answer a different causal question than ex post return tests.12
Also consistent with Hypothesis 1, T I (the sum of EI and DI) is significantly
pos-itively related to overvaluation as measured by V /P. The V /P coefficient in the T I
specification (3) is −2.53 (t =−3.42).
To gauge the economic importance of the issuance-valuation relation, we examine
the effect of a one-standard-deviation shift inV /P on equity and debt issuances; and we
compare these to the effects of a comparable shift in B/P (which measures the effect
of growth prospects). The standard deviations of V /P and B/P from Table 1 are 0.60
and 0.61, respectively. According to theEI regression specification (3), a
one-standard-deviation shift in V /P therefore implies a 1.55% (2.58×0.60) change in EI, which is
about 21% of the average EI. This compares with a 2.92% (4.79×0.61) change in EI
by a one-standard-deviation shift in B/P, implying that the effect of misvaluation on
equity issuances is about 53% of the effect of growth opportunities. A similar calculation
shows that the effect of misvaluation on EI is 2.6 times the effect of cash flow onEI.
A comparison between theEI andDI regressions of Table 5 suggests thatB/P has
a greater effect on debt than on equity issuance, as evident in Model 1, which does not
include V /P. The misvaluation theory does not make a prediction about which effect
will be stronger, since even the basic prediction about the effect of misvaluation on debt
issuance is ambiguous. Traditional financing theories also have different predictions
12
about the relative strength of these effects. For example, the pecking order theory
predicts that firms in need of capital should prefer debt to equity financing, so if low
B/P firms need financing for their high growth opportunities, this should mainly come
from debt issuance. The debt overhang theory predicts that low B/P growth firms
should refrain from issuing debt in order to avoid bypassing valuable future investment
opportunities. The finding that higher B/P has a more negative effect on debt than on
equity financing tends to be most supportive of the pecking order theory.
6.2
Why Does Misvaluation Affect Issuance?
Characteristics-Based Subsample Tests
We now examine misvaluation sensitivities of financing within subsamples sorted by firm
characteristics to test different possible reasons why misvaluation affects equity and debt
issuances. The conditioning variables we hypothesize to affect the sensitivity of issuance
to misvaluation debt issuance are the level of misvaluation itself, B/P, R&D, size, share
turnover, and net insider selling.
We report the subsample results in Tables 6-8. For each subsample, we report the
V /P coefficient in Model 3 of Table 5, which provides the effect ofV /P on issuances after
controlling for the effects of growth and other potential effects of cash flow, leverage,
and firm-specific risk.
6.2.1 Valuation-Subsample Regressions
Panel A of Table 6 describes how the sensitivity of financing activity to misvaluation as
measured by V /P varies across misvaluation quintiles. Within each quintile, we regress
EI (or DI orT I) on V /P, B/P, and the other controls.
Consistent with Hypothesis 3, the effect of overvaluation on EI is limited to the
top two misvaluation quintiles. In fact, among the two bottom valuation quintiles V /P
is much smaller.13
The inter-quintile difference in V /P coefficients between the top and
bottom valuation quintiles is large and statistically significant (21.20, t= 7.63). This is
consistent with the prediction that the sensitivity of equity issuance to overvaluation is
strongest among overvalued firms.
As discussed in Section 3, overvalued firms have the incentive to issue equity for
investment to cater to investor optimism, and project scale economies provide an
addi-tional possibly reason why investment should be more responsive to misvaluation among
overvalued firms than among undervalued firms. A full analysis of how misvaluation
af-fects investment is beyond the scope of this study, but in unreported tests we confirm
that investment (the sum of capital and R&D expenditures) increase with overvaluation
as measured inversely by V /P (after controlling for B/P and factors such as cash flow,
firm age and leverage), and that the sensitivity of investment to misvaluation is greater
among overvalued firms.
To assess economic importance, we follow a procedure similar to that of Section
6.1. Among firms in the most overvalued quintile firms, a one-standard-deviation shift
in misvaluation increases EI by 6.69%, compared with an effect of a
one-standard-deviation shift in B/P of 8.98%. Thus, the estimated effect of misvaluation on equity
issuance is substantial, and is greater than that of cash flow.
For DI, there is no significant effect of misvaluation within each valuation quintile,
even for the most undervalued quintile. There is also no clear trend in the V /P effect
across the valuation quintiles. Finally, consistent with Hypothesis 3, theV /P coefficient
indicates that the effect of misvaluation on total issuance is strongest among the top
overvaluation quintiles (statistically significant, t=−5.12, only for the top quintile).
13
6.2.2 B/P-Quintile Regressions
Panel B of Table 6 reports the effect of misvaluation on issuance for the B/P
quin-tiles. Consistent with Hypothesis 4, growth firms with low B/P show a much stronger
misvaluation effect on EI (−8.49;t = −4.85) than do value firms (insignificant V /P
effect).
TheV /P effect onDI is also negative for growth firms (−3.14;t=−2.91). However,
it is positive for value firms (high B/P ratios), with a coefficient of 1.40, t = 3.87. As
discussed in Section 3, the effect of misvaluation on debt issuance is potentially
ambigu-ous because greater firm overvaluation directly encourages the issuance of overvalued
risky debt, but also encourages a substitution away from debt toward equity issuance.
This raises the question of why the first effect would dominate among growth firms,
resulting in a negative coefficient on V /P, and the second effect would dominate among
value firms, resulting in a positive coefficient on V /P.
A possible catering explanation is that among overvalued growth firms, the incentive
to maintain overvalued equity prices causes the issuance of risky debt as a supplement to
equity issuance. Jensen (2004, 2005) argues that the pressure on managers to take actions
such as raising capital to finance investment projects is stronger among overvalued firms,
especially among growth firms for which investor optimism is high. Overvalued growth
firms may be exploiting both means (debt and equity) of financing ambitious projects
to cater investor optimism.
It follows from theEI and DI results above that overvaluation positively affects the
T I among growth firms, and negatively among value firms. This results in a significantly
negative coefficient onV /P among growth firms (t=−4.66) and a significantly positive
coefficient among value firms (t = 2.50). The positive coefficient among value firms
total issuance. This opposes the spirit of Hypothesis 1, but the economic magnitude of
the coefficient (1.15) is modest.
The interquintile difference in the V /P effect on T I is substantial and highly
signif-icant (12.78;t = 5.03). The more negative relation between undervaluation as proxied
by V /P and total issuance (i.e., the more positive relation between overvaluation and
issuance) among growth firms is consistent with Hypothesis 4.
A subtle caveat to Hypotheses 4-6 is that a different line of reasoning based upon
the quality of the V /P proxy for misvaluation leads to the same conclusion. Firms with
high intangibles or growth opportunities are harder to value, and therefore are more
subject to misvaluation effects. Small firms share these features, and in addition have
low transparency and high costs of arbitrage, owing to their illiquidity.
SinceV /P is a noisy measure of misvaluation, within subsamples that contain greater
variation in true misvaluation, a greater fraction of the variation in V /P should be the
result of variation in actual misvaluation rather than measurement error. For example,
in a subsample in which true misvaluation is close to zero for all firms, almost all of
the variation in V /P would be noise. So any conditioning variable that induces greater
conditional dispersion in true misvaluation should strengthen the sensitivity of issuance
to measured misvaluation.
This possibility is most important for firm size conditioning firms (Hypothesis 6),
owing to the high costs of arbitraging mispricing of small firms. To the extent that this
caveat applies, evidence of higher issuance sensitivity among the small firm subsample
provides further corroboration of the basic hypothesis that misvaluation affects issuance,
6.2.3 R&D-Quintile Regressions
According to Hypothesis 5, firms whose assets are less tangible and therefore harder
for the market to value will have greater sensitivity of issuance to misvaluation. Section
6.2.2 provides one kind of evidence consistent with this hypothesis, that the sensitivity of
equity issuance and total issuance toV /P is greater among growth firms (firms with low
B/P). However, B/P has multiple interpretations, so it is useful to test this hypothesis
using a different measure of intangibility. We therefore examine how the sensitivity of
issuance to misvaluation varies across sets of firms with different levels of R&D.
Panel C of Table 6 reports the sensitivity of issuances to misvaluation for each R&D
quintile. Consistent with Hypothesis 4, high-R&D firms have a much higher sensitivity
of EI toV /P than low-R&D firms do. The V /P effect onEI is concentrated in the top
three R&D quintiles, and is statistically significant only in the top two. The difference in
coefficients between the top and bottom quintiles is statistically significant (t=−2.10).
6.2.4 Size-Quintile Regressions
According to Hypothesis 6, the sensitivity of equity issuance and total financing to
misvaluation will be greater among small firms, again because such firms tend to derive
greater potential value from growth. Panel A of Table 7 reports the effect of V /P on
issuance within quintiles sorted by total assets. Consistent with Hypothesis 6, the V /P
effect on EI is much stronger among small firms than among large firms. The V /P
effect on EI is −3.67 (t = −4.05) among the smallest-firm quintile, is monotonically
increasing toward zero moving toward larger size across the quintiles, has significant
coefficient only for the four smallest size quintiles, and has coefficient of only −0.55,
(t =−1.22) among the largest-firm quintile.
In contrast, there is no significantV /P effect onDI within any of the size quintiles.
effect on T I than do large firms. The difference in coefficients between the largest and
smallest quintile is significant at the 10% level (t= 1.78).
6.2.5 Turnover-Quintile Regressions
According to Hypothesis 7, the sensitivity of equity issuance to misvaluation is greater
when investors have a shorter time horizon, because this increases the catering incentive
to issue shares for the purpose of financing the ambitious and expensive projects that
the market is optimistic about. Following Polk and Sapienza (2009), we use turnover as
a proxy for investor time horizon. Panel B of Table 7 reports the misvaluation effects on
issuances by turnover quintile. As expected, we see that high-turnover firms have higher
sensitivity than low-turnover firms of EI to V /P. The V /P effect on EI increases
monotonically with turnover. The sensitivity moves from −1.23 (t = −2.85) among
the lowest-turnover quintile to −5.79 (t =−3.32) among the highest-turnover quintile,
which is more than four times as large. The interquintile difference in the V /P effect
between the high and low turnover firms is also significant (t = −2.54). This finding
suggests that equity issuance is complementary with the investment catering identified
by Polk and Sapienza (2009).
There is no indication of a trend across turnover quintiles in the ability of V /P
to predict debt issuance. A trend in the V /P effect on T I is present across turnover
quintiles, paralleling the effect of turnover on the sensitivity of EI to misvaluation. The
effects for T I are similar to those for EI in magnitude and significance.
6.2.6 Insider Selling Subsample Regressions
Previous literature (e.g., Jenter (2005)) finds that insiders are more likely to sell (buy)
their firm’s shares when they perceive their stock is overvalued (undervalued). If net
equity and total issuances to V /P will be greater when insider net selling is high. So
as a further test of Hypothesis 3, we condition on net insider selling. In contrast with
the tests that condition on V /P itself, this tests whether the sensitivity of issuance to
misvaluation is greater among firms that are recognized by managers to be overvalued.
Our measure of net insider selling, N SELL, is the number of insider selling
trans-actions deflated by the total number of insider buying and selling transtrans-actions in the
fiscal year preceding the issuance measurement. Insider trading data are obtained from
Wharton Research Data Service (WRDS) for 1986-2009, and for the years 1976-1985
from the National Archives and Records Administration.14
We define insiders as the
top four executives (CEO, CFO, Chairman of Board, and President). Only 6.4% of our
sample observations have non-missing insider trading data, so we form N SELL-terciles
rather than quintiles.
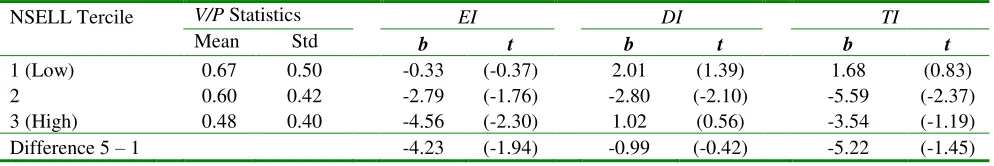
Table 8 reports the relation of V /P to issuance by N SELL tercile. Even in this
severely reduced subsample, we still observe that high net insider selling firms have a
higher sensitivity of equity issuance to V /P, with an intertercile difference in the V /P
coefficient between the high and low N SELL terciles of 4.23 (t = −1.94). Likewise,
high N SELL firms also appear to have a higher sensitivity of total issuance than low
N SELL firms, with an intertercile difference in the V /P effect of −5.22. This effect is
also economically substantial, but the difference is statistically insignificant owing to the
small sample size. However, we will see in Section 6.4 that the intertercile difference in
the V /P effect onT I is statistically significant in an integrated regression specification.
These findings give further support for Hypothesis 3.
14
6.3
Time-Variation in Misvaluation Effects
In Section 4.3, we saw that stock valuation was low in the early part of the sample period,
a time in which equity issuances were low compared to debt issuances. Valuations are
high and equity issuances often exceed debt issuances in the later half of the sample.
This suggests that it may be interesting to explore whether the effect of overvalued
equity on financing differs across subperiods. We therefore divide the sample into three
periods: a pre-1990 subperiod (1976-1989), a 1990s subperiod (1990-1999), and a 2000s
subperiod (2000-2009).
Owing to reduction in sample size, we do not expect to see statistical significance to
be completely consistent in subperiod tests, especially in tests that further subdivide the
sample by firm characteristics. The conclusions from the full sample are fairly robust
across subperiods, but there are some interesting variations in effects. For brevity we
focus primarily on equity issuance, the dependent variable for which misvaluation effects
should be strongest.
In unreported tests, we find that the V /P effect on EI is statistically significant in
all 3 subperiods, and is much stronger during the 1990s than in the earlier period. The
coefficient ofV /P as in regression specification (3) in Table 5 almost triples when moving
from the pre-1990 to the 1990s subperiod. The effect during the 2000s is intermediate
in magnitude but closer to the weaker pre-1990 effect. The strong misvaluation effect
during the 1990s may be a consequence of the high-tech boom of the late 1990s; Dong et
al. (2006) also report stronger effects of misvaluation in the post-1990s period in their
study of misvaluation and takeovers.
The negative relation ofV /P to total issuance is strong and highly significant during
the 1990s period. It is not present during the pre-1990s period, and is marginally
the 2000s. On the other hand, despite the overall insignificant effect of misvaluation on
debt issuance, during the pre-1990 period but not the two other periods, undervalued
firms issue more debt.
The differences in the sensitivity of issuance to misvaluation across subsamples with
different firm characteristics are reasonably robust to subperiod. The conclusion that the
sensitivity ofEI to misvaluation is greatest among overvalued firms is robust and highly
significant in all three subperiods. It is especially pronounced in the 1990s period— the
V /P effect among the top valuation quintile during the 1990s period is almost double
that for the pre-1990 or the 2000s subperiods. The finding that small firms have greater
sensitivity of EI to misvaluation is present in the 2000s period and is especially intense
in the 1990s period, but is not significant in the pre-1990 period.
The greater sensitivity ofEI to overvaluation among growth firms exists in the 1990s
and 2000s periods, but not the pre-1990 period. It is much more pronounced in the 1990s
period — the growth-value interquintile difference inV /P effect onEI during the 1990s
is almost triple that for the 2000s. The finding that the sensitivity ofEI to misvaluation
is greatest among high R&D firms is strong in the pre-1990 period and the 1990s, but
is not present in the 2000s.
Finally, the full-sample finding that high turnover firms have higher sensitivity of
EI to V /P applies strongly during the 1990s, with 10% significance in the 2000s, and
does not apply during the 1980s. This suggests that catering effects grew stronger in
the 1990s.
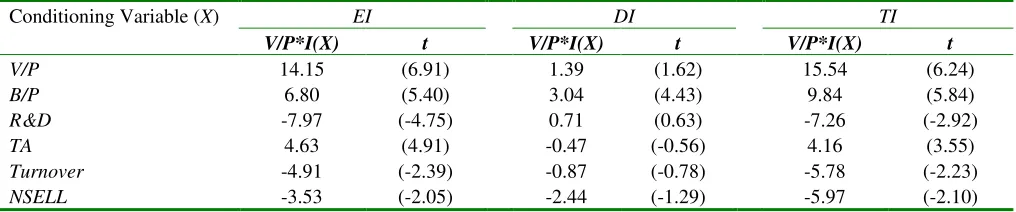
6.4
Regression Interaction Tests
To test the predictions in Hypotheses 3-7 more fully, we use an integrated regression
approach rather than running separate subsample regressions as in Tables 6-8. We