submitted to the
Combined Faculty of Natural Sciences and Mathematics of the
Heidelberg University, Germany
for the degree ofDoctor of Natural Sciences
put forward by
M.Sc. Alexander Matz
born in Görlitz, Sachsen
Compiler Based Optimizations of
GPU Applications on multi-GPU
Systems
Advisor: Professor Dr. Holger Fröning Oral examination: ...
Graphics Processing Units (GPUs) are accelerators for computers and provide massive amounts of computational power and bandwidth for amenable applications. While effectively utilizing an individual GPU already requires a high level of skill, effectively utilizing multiple GPUs introduces completely new types of challenges. This work sets out to investigate how the hierarchical execution model of GPUs can be exploited to simplify the utilization of such multi-GPU systems.
The investigation starts with an analysis of the memory access patterns exhibited by applications from common GPU benchmark suites. Memory access patterns are collected using custom instrumentation and a simple simulation then analyzes the patterns and identifies implicit communication across the different levels of the execution hierarchy. The analysis reveals that for most GPU applications memory accesses are highly localized and there exists a way to partition the workload so that the communication volume grows slower than the aggregated bandwidth for growing numbers of GPUs.
Next, an application model based on Z-polyhedra is derived that formalizes the distribution of work across multiple GPUs and allows the identification of data depen-dencies. The model is then used to implement a prototype compiler that consumes single-GPU programs and produces executables that distribute GPU workloads across all available GPUs in a system. It uses static analysis to identify memory access patterns and polyhedral code generation in combination with a dynamic tracking system to efficiently resolve data dependencies. The prototype is implemented as an extension to the LLVM/Clang compiler and published in full source.
The prototype compiler is then evaluated using a set of benchmark applications. While the prototype is limited in its applicability by technical issues, it provides impressive speedups of up to 12.4x on 16 GPUs for amenable applications. An in-depth analysis of the application runtime reveals that dependency resolution takes up less than 10% of the runtime, often significantly less.
A discussion follows and puts the work into context by presenting and differentiating related work, reflecting critically on the work itself and an outlook of the aspects that could be explored as part of this research. The work concludes with a summary and a closing opinion.
Grafikkarten sind Beschleuniger für Computer, die durch ihre extrem hohe paral-lele Rechenleistung und Speicherbandbreite für bestimmte Arten von Anwendungen bestechen. Während die effiziente Nutzung von individuellen Grafikkarte bereits hohe technische Fähigkeiten von Entwicklern verlangt, wird die effiziente Nutzung mehrerer Grafikkarte durch völlig neue Arten von Problemen erschwert. Diese Arbeit erforscht, wie das hierarchische Ausführungsmodell der Grafikkarten ausgenutzt werden kann, um den Schritt von einer Grafikkarte zu mehreren parallel verwendeten Grafikkarten zu erleichtern.
Einleitend wird eine Analyse der Speicherzugriffsmuster von populären Grafikkarten Testprogrammen durchgeführt. Die Speicherzugriffsmuster werden zunächst mittels eigens entwickelter Instrumentierung gesammelt und dann in einer Simulation auf implizierte Kommunikation hin untersucht. Diese Analyse zeigt, dass die Mehrheit der untersuchten Anwendungen stark lokalisierte Speicherzugriffe aufweisen und sich auf eine Art aufteilen lassen, bei der das Kommunikationsvolumen langsamer mit der Anzahl Grafikkarten wächst, als ihre aggregierte Bandbreite.
Darauf folgt der Entwurf eines Anwendungsmodells basierend auf Z-Polyhedra, das die Aufteilung von Arbeit formalisiert und die Identifikation von Datenabhängigkeiten ermöglicht. Dieses Modell wird dann für die Umsetzung eines Compiler-Prototypen genutzt, der Grafikkarten Anwendungen so übersetzt, dass sie auf mehreren Grafikkarten ausführbar sind. Der Prototyp nutzt statische Analyse um die Speicherzugriffsmuster in das Anwendungsmodell zu übersetzen und generiert code, der in Kombination mit einem dynamischen Trackingsystem Datenabhängigkeiten effizient auflöst. Als Grundlage für den Prototyp dient das LLVM Projekt und der gesamte Quelltext is frei zugänglich veröffentlicht.
Der Compiler-Prototyp wird anschließend mit Hilfe von extra angefertigten Anwen-dungen ausgewertet. Obwohl technische Probleme den Anwendungsbereich des Compil-ers einschränken, liefert er bei Anwendungen, die der statischen Analyse zugänglich sind, beeindruckende Beschleunigung von bis zu 12.4x bei Ausführung auf 16 Grafikkarten. Eine tiefergehende Analyse der Programmlaufzeit kommt zu dem Schluss, dass die Auflösung von Datenabhängigkeiten maximal 10% und meist deutlich weniger beträgt.
Im Anschluss folgt eine Diskussion, besteht aus einem vergleich mit verwandten Arbeiten und einem Ausblick auf interessante zukünftige Arbeiten. Die Arbeit schließt mit einer Rekapitulation der wichtigsten Punkte und einer Stellungnahme zu den Ergebnissen ab.
1 Introduction 1
2 Background 7
2.1 GPU Architecture and Programming Models . . . 7
2.2 The LLVM Compiler Infrastructure Project and Clang . . . 11
2.3 Memory Trace Collection on GPUs . . . 17
2.4 Polyhedral Compilation . . . 19
3 GPU Memory Access Patterns 25 3.1 GPU Memory Trace Collection . . . 26
3.2 Analysis Model . . . 37
3.3 Workload Selection . . . 54
3.4 Trace Evaluation . . . 57
3.5 Summary . . . 66
4 Automatically Partitioning CUDA 69 4.1 Concept . . . 69
4.2 Toolchain Overview . . . 75
4.3 Kernel Transformations for Work Splitting . . . 77
4.4 Polyhedral Analysis . . . 79
4.5 Polyhedral Code Generation . . . 83
4.6 Runtime Library . . . 91
4.7 Host Code Transformations . . . 96
5 Prototype Evaluation 101 5.1 Functionality . . . 101
5.2 Evaluation Methodology . . . 103
5.3 Speedup of Partitioned Applications . . . 106
6.2 Future Work . . . 121 7 Conclusion 125 List of Figures 131 List of Algorithms 135 List of Abbreviations 137 Bibliography 139
1
C
h
a
p
t
Introduction
Computers as the defining invention of the information age have enabled breakthroughs in a variety of fields. They execute computations that are so massive in scale that even large groups of humans simply can not perform the same computations within a reasonable time-frame. Equations that describe real-world phenomena, such as Maxwell’s equations behavior of electro-magnetic fields or Euler equations for the motion of non-viscous fluids, are computationally so expensive that their manual application typically was limited to more easily solvable corner cases. The invention of powerful computers suddenly provided the opportunity to perform these calculations kick-started the field of computational science that focuses on computers primarily as tools for scientific research. The wild success of computers has made them pervasive in virtually every industry, from the characterization and prediction of financial markets, 3-dimensional x-ray imaging and gene sequencing in medical sciences, to the simulation of galaxies and analysis of the cosmos’ background radiation in astronomy. In all of these examples, having access to more computational power provides more accurate results and as a result. As a result, since the invention of the first computer, the manufacturers of their components have been in a steady result to provide ever better-performing products.
A common way to improve the performance of a computer system is the addition of specialized chips that have a limited set of functions but outperform the Central Processing Unit (CPU) at these functions. These chips are called accelerators, and a very successful example of them is the Graphics Processing Units (GPUs). They were originally invented to speed up the synthesis of (three-dimensional) computer images and
are designed to compute a very large number of simple linear algebra problems, being both faster than and more energy-efficient than CPUs for this purpose. They quickly stirred the interest of the scientific community, which began using them for scientific purposes other than image synthesis, creating the General Purpose Programming on Graphics Processing Units (GPGPU) community. Their focus on computer graphics has led to different design decisions than those made for CPUs. Instead of aggressively optimizing the execution of an individual computation to be as fast as possible, they are optimized to execute a large batch of similar computations in a short time, sacrificing the execution time of any individual computation. They require special software to be programmed and the two most important GPGPU frameworks, OpenCL and CUDA, rely on the so-called Bulk-Synchronous Parallel (BSP) programming model as their primary abstraction [1]. In the BSP programming model, an application is broken down into sections, so-called “super steps”, which contain a high number of small programs (called threads) that can be executed independently of each other and synchronization is only possible at the boundaries of these super steps. Both OpenCL and CUDA provide a relaxed implementation of this that allows limited communication between parallel threads in small groups. By providing many more threads than can be executed on the hardware, while also limiting communication between any two threads, memory latencies can be hidden and performance is portable between different generations and designs GPUs. This is a very important feature of data-parallel languages such as OpenCL and CUDA, as it hides architectural aspects from the user while providing consistent performance, independent of actual hardware configurations.
For applications that require large amounts of parallel computations, GPUs often provide the majority of the computation power and turn into the bottleneck of the system. While installing additional GPUs into the system increases the available raw processing power, applications need to be aware of this, which introduces additional complexity. Efficiently utilizing an individual GPU already requires high skill and adding the need to synchronize GPUs and manage data movements between them is a significant burden. Although more recent CUDA versions are tackling this complexity by allowing different GPUs to directly access each other’s main memory, creating a Virtual Shared Memory (VSM), accessing memory located on another GPU is orders of magnitudes slower. The additional complexity required to efficiently utilize multiple GPUs in a single node is comparable to utilizing multiple nodes in traditional cluster systems. While the distribution of work across multiple GPUs benefits from the BSP programming model and its relaxed guarantees between multiple threads, data distribution and collection requires the insertion of communications code around all
application, a process that is tedious and error-prone.
This work analyzes the challenges of utilizing multiple GPUs and derives a way to simplify the transition from one to multiple GPUs. It relies on the key observation that both the BSP programming GPU hardware favor programs that contain limited control flow and access memory in a predictable way. By creating a model of the memory accesses, data dependencies can be identified and the data transfers required by a partitioned application can be computed automatically. Using this information, the application can then be safely partitioned over multiple GPUs, each computing a subset of the solution and communication where necessary. This work can be performed automatically by a compiler that translates a given GPU program from source code to an executable file. Such an automatic partitioning provides a massive increase in productivity as it transparently allows the utilization of multiple GPUs while keeping the relative simplicity of the single-GPU programming model.
An analysis of the memory accesses performed by applications taken from popular GPU-benchmarks suites suggests that GPU applications are expected to be amenable to such an automated partitioning. The analysis uses the memory accesses to determine the minimum amount of communication that the given application would require to compute correct results when being split into multiple partitions. The primary takeaway of this analysis is that most applications can be split in such a way that communication volume grows sublinear with the number of partitions, suggesting that the aggregated bandwidth of additional GPUs can more than balance the additional volume.
This work presents a concept and prototype implementation for an automatically partitioning CUDA compiler that relies on a hybrid optimization scheme utilizing static code analysis and a runtime support system. The static code analysis extracts a mathematical model of the application’s memory accesses in GPU memory and a transformation step distributes work across multiple GPUs and inserts code for synchronization and communication. The communications code is generated using optimizing libraries to efficiently describe data dependencies to minimize runtime overheads. A runtime system determines the target GPU of data dependencies and minimizes data transfers by implementing a simple coherence scheme. A fall-back solution provides support for non-partitionable GPU kernels. The prototype compiler is explained in detail and evaluated using a set of custom benchmarks. It is based on the gpucc CUDA compiler that is integrated into the LLVM compiler project [2]. Although CUDA has been chosen as the sole input language for pragmatic reasons,
there are no conceptual differences when replacing CUDA with OpenCL. While this work focuses on the distribution of work across the GPUs of a single node, the approach can be transparently applied to GPU-clusters or cloud environments using existing software [3].
Contributions
This work makes the following contributions:
1. Instrumentation for gpucc to capture GPU memory access on CTA granularity.
As a precursor to the memory access analysis of GPU applications, an LLVM module has been developed that instruments the kernels in CUDA applications to log their memory accesses. Memory accesses are logged in Cooperative Thread Array (CTA) granularity and written to disk for off-line analysis. The design of instrumentation pass and capturing infrastructure is explained in this work and the source code is published for open access.
2. A trace-based analysis of the inter-CTA communication exhibited by single-GPU applications. The applications are a selection of benchmarks from three established
GPU benchmark suites. Using the custom instrumentation pass, memory accesses are collected and analyzed off-line using a simple simulation. The simulation creates virtual partitions of the kernel and uses a memory tracking system to determine the interactions between CTAs that imply communication during the application’s lifetime. Different partitioning schemes are used and their effect on the CTAs’ communication is analyzed. The methodology and implementation of the analysis are the successors to a publication in the 12th Workshop on General Purpose Processing 2019 [4].
3. Design and implementation of a prototype for an automatically partitioning compiler for CUDA. An open-source CUDA compiler is modified to automatically
partition GPU applications based on an analysis of its kernels memory access patterns is presented. First, the concept is discussed in the context of existing similar solutions with their benefits and drawbacks. The tasks required to partition an application are identified, potential solutions evaluated in theory, and a suitable one is selected. The resulting compiler uses a combination of polyhedral compilation and a dynamic runtime system to minimize data transfers while not requiring to fully model inter-kernel dependencies. The different parts
The work implements an improved concept of the prototype presented at the
International Workshop on Programmability and Architectures for Heterogeneous Multicores (MULTIPROG-2016). 1.
4. An evaluation of the automatically partitioning compiler prototype. The compiler
prototype is evaluated using a set of custom workloads representing typical computation profiles seen in scientific applications. The evaluation includes a discussion of the technical limitations of the implementation, an analysis of the speedups that have been achieved on a single-node system with 16 NVIDIA GPUs, and an evaluation of the overhead introduced by the runtime system. It consists of a quantitative analysis of the measured performance of the generated binaries and a qualitative analysis comparing the application’s computational and space complexity to their scaling behavior when executed in multiple partitions.
Organization of this Work
The remainder of this work is structured as follows. Chapter 2 provides the information required for the understanding of this work: the architecture and programming model for GPUs, the open-source compiler infrastructure used in this work, trace collection, and the polyhedral model. Chapter 3 presents the trace-based analysis of single-GPU memory access patterns. It covers the toolchain implemented to collect the memory traces as well as the benchmark selection and evaluates the traces by replaying them in a virtually partitioned application. The results are discussed and interpreted. The concept of an automatically partitioning compiler, as well as the details of its prototype implementation, are explained in Chapter 4. The prototype is implemented partially as a compiler plugin and partially as a runtime library. Most of the complex code is found in the static analysis and code transformations, while the runtime library implements most of the algorithms that are used for work partitioning and buffer synchronization. An in-depth evaluation of the prototype implementations is presented in Chapter 5. The evaluation is based on three custom benchmarks with different characteristics and memory access patterns. A functional evaluation discusses technical limitations, followed by an analysis of the speedup achieved on a multi-GPU test system and measurements of the overhead that is introduced by the dynamic parts of the runtime
1The automatically partitioning compiler is part of the “Mekong” umbrella project. The name is
support system. In Chapter 6.1, the work is put into context in its field by discussing and differentiating work related to the individual aspects of this work or the general approach in its entirety. The work concludes in Chapter 7, which critically discusses the result of this work, provides an outlook, and parts with final words.
2
C
h
a
p
t
Background
This chapter provides background on the major topics that have been relevant as part of this work. The sections are written to familiarize the reader enough with each topic to be able to follow this work. Each topic represents a field of research in its own right and is too vast to provide an in-depth introduction within the scope of this thesis. Interested readers are encouraged to use the provided references as starting points for further reading.
2.1
GPU Architecture and Programming Models
The basic choices in the hardware designs for GPUs and CPUs differ significantly due to the different requirements set for their performance. CPUs traditionally are designed to optimize single-thread performance, where the goal is to execute an individual com-putation in the shortest possible time [5]. In contrast, graphics comcom-putations typically require massive amounts of linear algebra computations that are all independent of each other and only the total time to finish all of these computation matters. GPUs are therefore designed to optimize throughput for massively parallel computations, sacrificing single-thread performance[6]. Although general-purpose GPU program-ming has become pervasive today in computationally intensive areas, it started as a “creative misappropriation” of the hardware through specially prepared textures and filter settings in graphics computations [7]. The introduction of programmable shader units allowed the implementation of complex filters and algorithms, greatly simplifying general-purpose GPU programming and result in a demand for GPUs in scientific
computing [8, 9, 10]. This high demand led to the creation of tools for explicit GPGPU programming, such as CUDA and OpenCL [11, 12].
Statements made in this section about NVIDIA hardware and the CUDA program-ming model are taken primarily from official white papers and online documentation released by NVIDIA unless cited otherwise [13, 14, 12]. While this work focuses on NVIDIA GPUs and the programming model implemented by CUDA, the general architecture and programming models of GPUs from other vendors are similar and the general statements apply to them as well.
The differences in the design between GPUs and CPUs can be summarized like this: GPUs contain thousands of fairly simple cores instead of a few very powerful ones found in CPUs. Many of the more detailed design decisions follow as a consequence to facilitate this overarching premise. GPU cores are simplified to such a degree that they don’t even contain an individual scheduler but share a single one within a group (of size 32 in current NVIDIA hardware), called a warp. As a consequence,
the cores can not be programmed individually but instead present a single instruction multiple thread system, where all cores of the system execute the same instruction with
different operands in lockstep [15, 13]. The main memory follows a relaxed consistency
model with severely limited guarantees about the visibility of modifications, reducing synchronization overhead and increasing parallel throughput. Caches are not implicit but explicit, simplifying hardware at the cost of requiring manual management. Host-system synchronization and I/O-facilities are severely limited to further increase parallel throughput. While some of these missing features are beginning to be implemented in more recent versions of the CUDA hardware and software (CUDA 9.0 and onwards), they are still severely limited compared to CPUs.
CUDA is a proprietary GPGPU programming language based on C++, developed and endorsed by NVIDIA to program their hardware. The GPGPU programming model used by CUDA is an implementation of the Bulk Synchronous Parallel (BSP) programming model [14]. In this programming model, a parallel program is divided into
super-steps that execute a large number of threads in parallel without synchronization,
followed by a synchronization point for all threads in-between super-steps [1]. In CUDA terminology, the super-steps are called a kernel and execute in a two-level
hierarchy of threads. The first level of the hierarchy is called the (thread) grid, a large,
3-dimensional grid containing a thread block on each node of the grid. Each of these
thread blocks itself consists of a large number of individual threads that are organized
into another 3-dimensional cuboid, forming the second level of the hierarchy.
1 __global__ void kernel_scale(float *b, float *a, float c, int n) {
2 int global_id = threadIdx.x + blockIdx.x * blockDim.x;
3 if (global_id < n) { 4 b[global_id] = a[global_id] * c; 5 } 6 } 7 8 int main() {
9 int n = /* problem size */;
10 float scale = /* scaling factor */;
11 float a_dev = cudaMalloc(sizeof(float) * n);
12 cudaMemcpy(a_dev, /* host buf */, sizeof(float) * n,
13 cudaMemcpyHostToDevice);
14 float b_dev = cudaMalloc(sizeof(float) * n);
15 dim3 block(512, 1, 1);
16 dim3 grid((int)ceil((double)n / block.x), 1, 1);
17 kernel_scale <<< grid, block >>> (b, a, scale, n);
18 cudaMemcpy(b_host, b_dev, sizeof(float) * n,
19 cudaMemcpyDeviceToHost);
20 cudaFree(a_dev);
21 cudaFree(b_dev);
22 }
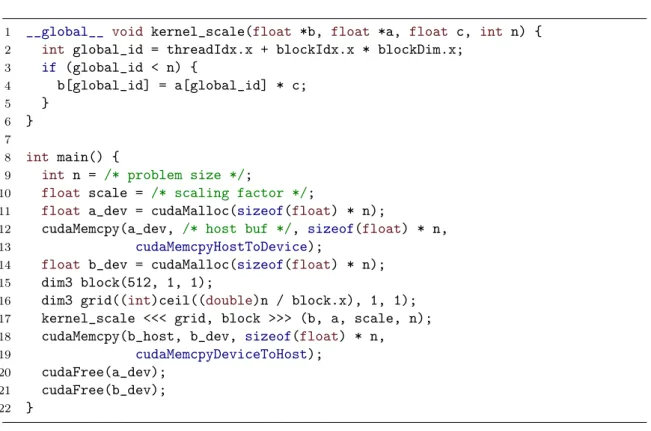
Figure 2.1: A simplified example code in CUDA showing code intended to run on the device and the host-code syntax for the configuration and launch of a kernel.
with each other, and provide guarantees about progress. Thread blocks are the atomic scheduling unit in CUDA: threads in a thread-block can only be scheduled for execution as a whole, not individually. Communication or synchronization between threads of different thread blocks is generally not possible 1. The weak/non-existent guarantees
about the visibility of memory accesses and lack of synchronization effectively mean that thread blocks execute fully independently of each other.
Applications written in CUDA are targeting two different architectures: the host CPU and the NVIDIA GPU executing the kernels. Although the code for both architectures can, and often is, written in a single source code file, the functions targeting each architecture can be clearly distinguished from each other and provide slightly different semantics. Definitions and functions intended for the GPU are called
device code and are prefixed by the macros __global__ or __device__. The code in a
CUDA kernel describes the code for an individual thread, which is then executed by a potentially very large number of actual threads. In order to differentiate both control flow and data for each thread, a 3-dimensional index for each thread is provided that
1The exception is a memory fence across the whole system, which is rarely used due to dramatic
uniquely identifies the thread in the thread hierarchy. This unique global index is calculated in figure 2.1 in line 2 and then first used to avoid an out-of-bounds error in line 3 and to index a unique element in the arrays a and b in line 4. This usage
pattern for thread indices can be found in almost every CUDA application. OpenCL provides a built-in command that returns the global unique index directly, skipping the equivalent formula threadIdx.x + blockIdx.x * blockDim.x used in CUDA.
The threads of each thread block in a GPU can be configured to have accesses to a portion of the manually managed cache, calledshared memory in CUDA terminology.
While a consistent view of this cache is also not enforced between threads by default, CUDA provides memory fences that enforce consistency. Shared memory is located on-chip and therefore much faster than the GPU’s main memory, calledglobal memory.
The lower latency is particularly beneficial for repeatedly accessed values shared by multiple threads, empirical proof of which is the high popularity of tiling optimizations on the granularity of thread blocks [17, 18].
Device code is compiled down into an intermediate Instruction Set Architecture (ISA) that is portable between different iterations of NVIDIA GPUs, called Parallel Thread eXecution (PTX). It is then translated into machine code for the actual GPU found in the system by the driver before kernel execution.
Analogously to device code, definitions and functions intended for the host archi-tecture are referred to as host code and are implemented in regular C++, except for a
special notation that configures and launches a CUDA kernel on a GPU. In addition to launching kernels, the host code also takes care of the auxiliary code required for the kernels to run, in particular allocation and management of memory buffers on the GPU. The code in figure 2.1 from line 10 to line 20 shows a simplified version of the code required to launch a kernel. First, a buffer is allocated on the device using the
cudaMalloc API call, which is then filled in from a regular host buffer by thecudaMemcpy
API call. Then, the thread block and the thread grid sizes are computed in such a way that the total number of threads is guaranteed to be at least as large the number of array elements, a pattern commonly found in CUDA code. Finally, the kernel is launched using the special kernel launch syntax, followed by another cudaMemcpy call to
copy the result from GPU memory back to host memory. While the kernel launch is an asynchronous operation and might return before the kernel has finished execution, operations on a given GPU are sequential, so the synchronous cudaMemcpy call waits for
the kernel to finish before it starts copying. The application finishes by releasing the GPU buffers.
produce a single binary that executes on any system with a compatible driver and CUDA enabled hardware. The GPU architectures are backward-compatible, i.e. newer GPUs can always execute code compiled for older architectures and any translation steps are handled transparently by the driver.
The CUDA API has supported the parallel utilization of multiple GPUs in parallel since its release. Multi-GPU support is implemented by providing a function that allows setting any available GPU as the “active” GPU that will be the target of all subsequent CUDA API calls. If only a single GPU is to be utilized, this function can be simply ignored as the API is initialized to use the “first available” GPU in the system by default.
2.2
The LLVM Compiler Infrastructure Project and
Clang
LLVM (originally “low-level virtual machine” but not used as an acronym anymore) is a collection of compiler components for program analysis and optimization that is designed to provide high reusability and customizability [19]. It achieves this goal by defining a common Intermediate Representation (IR) that is shared by all analysis and transformation components and used as the basis for all optimizations. At first glance, this IR looks like a form of assembly and provides an ISA for a theoretical computer architecture. However, programs translated into the IR are not intended to be directly executed like this as no processor implementing this ISA exists, instead it just provides a model to represent programs in a simpler form than the original programming language. Differences to assembly languages targeting actual processor architectures include:
• LLVM IR is strongly typed with a language-independent type-system that sup-ports compound data-types such as arrays and structures. Types are never automatically coerced and any non-trivial casts require an explicit instruction with clearly defined semantics.
• An instruction dedicated to type-safe address arithmetic, enabling transparent integration of pointer calculations into the type-system.
• LLVM IR is in Static Single Assignment (SSA) form, a way to represent programs that share many similarities with functional programming [20]. This requires
that the majority of all instructions are side-effect free. Exceptions to this rule exist, the most prominent ones being load and store instructions.
Some of the information presented in this section is specific to LLVM/Clang while some applies to compiler construction in general. There are multiple sources about the basics and details of compiler design [21, 22, 23]. All of these cover the general architecture of compilers (which components they can (or should) consist of), as well as specific information about program parsing, optimization pipelines, and code generation. Unless supported by a specific citation, statements made about general compiler design made in this section are based on the information these sources. LLVM and Clang specific information is based on more informal sources. While there are peer official and/or peer-reviewed publications about LLVM and Clang [19, 24], the projects are moving at a very fast pace and reference its online documentation and in particular its source code as the authoritative sources [25, 26]. Statements made in this section about Clang and LLVM, unless cited otherwise, are based primarily on information from online documentation.
The powerful type system can implement many high-level features of popular programming languages. Directly representing these high-level features and their constraints in IR, allows more aggressive optimizations by the compiler by providing additional semantics for instructions and reducing the number of assumptions required about a code section. Additionally, integrating pointer arithmetic directly into the IR simplifies reasoning about memory safety of applications written in typically unsafe languages, such as C [27].
LLVM IR being in SSA form is the largest difference to regular assembly languages. Assembly languages are typically a direct translation of machine-code into a human-readable format and represent the specific code to run on a particular processor with a fixed amount of registers. Programs represented in assembly heavily rely on side-effects to implement a given algorithm: inputs and outputs of functions are communicated using specific registers and memory locations defined by an Application Binary Interface (ABI). Program representations in SSA, on the other hand, are designed to be mostly side-effect free: inputs and outputs to functions are passed using named or anonymous values without specifying their storage.
Although these values are often described as “registers” of a machine with an unlimited number of registers, this description is a simplification. Values in SSA form (as used by LLVM) are not limited to the word size of any specific processor and can only be assigned a name (“written to a register”) by exactly one instruction, hence the name “Static Single Assignment”. This creates a problem when trying to represent
entry:
%2=icmpeqi32%c,0 bri1%2,label%else,label%then
then:
%4=tailcalli32(.)@a()#2 brlabel%cont
else:
%6=tailcalli32(.)@b()#2 brlabel%cont
cont:
%8=phii32[%4,%then],[%6,%else] reti32%8
(a) The control flow graph of the LLVM IR code. 1 entry: 2 %2 = icmp eq i32 %c, 0 3 br i1 %2, label %else, \ 4 label %then 5 then:
6 %4 = tail call i32 (...) @a()
7 br label %cont
8 else:
9 %6 = tail call i32 (...) @b()
10 br label %cont
11 cont:
12 %res = phi i32 [ %4, %then ], \
13 [ %6, %then ]
14 ret i32 %res
15 }
(b) The LLVM IR generated for code that chooses between two values based on a vari-able “%c”.
Figure 2.2: Example program that requires a phi-instruction to represent divergent control flow.
values that evolve over the runtime of the program, such as loop induction variables. SSA solves this problem by introducing the phi-instruction (also ϕ-instruction/node),
a pseudo-instruction that “magically” selects between different values depending on previous control flow. Figure 2.2 illustrates the Control Flow Graph (CFG) of a function that selects between two values, for example from a statement such as return c ? a() : b();. The code first diverges at the condition in the “entry” block and then
converges in the “cont” block, returning the result of either the “then” or the “else” block. Since it is illegal for programs in SSA form to assign two different values to the same name, a new value is created in each block: the value %4in the then-block and%6
in the else-block. They are merged into a single value by the phi-instruction in the cont-block by assigning either the %4 or %6 value to %res, depending from where the
cont-block was entered.
The phi-instruction is not intended to be executed on real hardware and only used to simplify data flow analysis during optimization stages by providing a side-effect free way of representing changing values in SSA. During code generation, the phi-instruction is translated into one or more instructions on the target hardware that together provide identical semantics. As an example, when generating code for x86-based architectures, the code shown in 2.2 can be translated into mov instructions that store the value of
Figure 2.3: Simplified architecture of the Clang compiler. Examples for related toolchains that reuse parts are depicted in dashed outlines.
which path is taken, the correct value can be found in the EAX register and returned
as the result. This implements the logic represented by the phi-instruction at the cost of introducing state, since theEAX register is not freely available for computations
anymore.
By providing this well-defined intermediate representation as the primary interface between the components of the LLVM toolchain, the individual components can be very loosely coupled and designed in a highly reusable way. Since the majority of the core LLVM project is implemented as a set of mostly independent analysis and transformation passes, the core project is rarely used on its own and instead typically integrated into a fully-featured compiler toolchain. One such toolchain that is maintained as part of the LLVM project is the Clang project, a compiler for languages of the C-family of languages [24].
Clang implements the generic design of an optimizing compiler by being split into the following three basic components: front-end (parser), middle-end (optimizer), and back-end (code generator). This design simplifies porting a compiler to new input languages or target architectures by decoupling input, processing, and output. A simplified view of the LLVM architecture is shown in figure 2.3 and includes toolchains other than Clang that are based on LLVM [28, 29, 30].
First, the front-end reads a program in the input programming language and
generates an easier processable intermediate representation of the program. This is done by first parsing the source code into an Abstract Syntax Tree (AST), which is a structured high-level representation of the input. Parsing is often done in a two-step process: A lexer splits the input data stream into individual tokens such as identifies, numbers, parentheses, and others, while ignoring insignificant parts such as white-space or comments. The tokens are then fed into a parser that uses rules (based on a grammar
1 int add(int a, int b) {
2 return a + b;
3 }
(a) C-Code.
1 define i32 @add(i32, i32) {
2 %3 = alloca i32, align 4
3 %4 = alloca i32, align 4
4 store i32 %0, i32* %3, align 4
5 store i32 %1, i32* %4, align 4
6 %5 = load i32, i32* %3, align 4
7 %6 = load i32, i32* %4, align 4
8 %7 = add nsw i32 %5, %6
9 ret i32 %7
10 }
(c) Unoptimized LLVM IR.
FunctionDecl add'int(int,int)'
ParmVarDecl a'int' ParmVarDecl b'int' CompoundStmt ReturnStmt BinaryOperator 'int''+' ImplicitCast 'int' ImplicitCast 'int' DeclRefExpr 'a''int' DeclRefExpr 'b''int' (b) Clang AST.
Figure 2.4: A function adding two numbers in its different forms as it processed by the Clang front-end.
describing the structure of the programming language) to assemble the tokens into an AST that is returned as the result. If it encounters an unexpected token, it simply aborts with an error message. The AST is then translated into unoptimized LLVM IR. Since AST is considered a high-level representation containing complex program structures and IR is much simpler and can not model all of the high-level information, this step is called “lowering”. Figure 2.4 illustrates the process for a function that adds two numbers and returns the result. Each translation of the input into a different form performs a lowering from a representation with complex semantics into an equivalent representation using simpler semantics.
Second, themiddle-end takes unoptimized LLVM IR from the front-end and passes
it through a series of optimizations. This optimizer stage represents the heart of the LLVM project in the context of the Clang compiler. Optimizations range from fairly simple such as common subexpression elimination to very complex such as aggressive restructuring and parallelization of loop nests [31, 32]. The output of the middle-end is again LLVM IR representing a semantically identical, but optimized, form of the input. Although certain optimizations rely on others as a precondition (in particular, most optimizations rely on the code being in proper SSA form), the optimizations and the
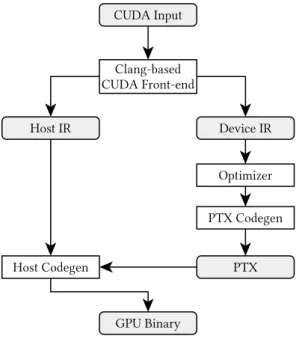
Figure 2.5: The modified Clang pipeline to support CUDA via the gpucc project. code generator are largely independent of each other. This allows reusing the majority of the optimizations for almost arbitrary input languages or target architectures.
Lastly, the back-end consumes the (optimized) LLVM from the middle-end and
produces code for a specific target architecture from it. Similar to the front-end, this step again lowers the program representation, from the LLVM IR into either assembly or machine code for a specific architecture, e.g. x86 or ARM. Target-specific optimizations are also applied at this stage, such as instruction combining (e.g. fused multiply-add) or removal of redundant instruction sequences [33, 34, 35]. The output of the back-end is an object-file containing machine-code specific to the target architecture.
In addition to providing all the components required by a modern compiler, the Clang project also provides an interface that connects these components and provides a convenient interface for the end-user, called the compiler driver. While the compiler driver primarily benefits the user experience, the complexity of a modern optimizing compiler is often overwhelming and necessitates such a driver for anyone but expert users.
Although Clang primarily targets the languages C, C++, and Objective-C, it also supports the proprietary GPGPU language CUDA in the form of the gpucc project [2].
It initially started as a separate effort by Google, but was soon fully integrated into the project and is now maintained as an official part of the LLVM and Clang projects. The combination of both host and device code in a single source code file requires
drastic changes to the regular Clang pipeline used for C or C++. Host and device code are split and then compiled separately, with the device code being compiled down to NVIDIDA PTX code first, which is then embedded into the host code. Figure 2.5 depicts an overview of the pipeline implemented by gpucc.
In the context of this work, both the front-end and the back-end of Clang are left unchanged. Some functionality is implemented as pre-processing before the front-end is executed, but the majority of the components developed in this are implemented to purely work on LLVM IR.
2.3
Memory Trace Collection on GPUs
Memory traces are a log containing a list of some or all memory accesses performed by a program, usually collected by executing an application and recording the memory accesses. Such traces are often used to classify applications, analyze their performance, or reveal potential bugs. Several ways exist to automatically gather memory traces of applications, with varying degrees of accuracy and speed.
The first approach,static analysis, describes an application’s memory accesses using
a mathematical model that is then used throughout the rest of the compilation process. These models are usually used to enable aggressive optimization, but it is possible to extract the model and use it purely for analysis purposes. This approach produces results very quickly since the analysis is typically fast enough to not prohibitively increase compile times [32]. The mathematical model must both be powerful enough to describe a wide variety of memory accesses and simple enough to provide an abstraction that can be represented by a mathematical description. While a mathematical model is not the same as a memory trace, a perfectly accurate model of an application’s memory accesses can be used to infer memory traces and provides the same capabilities in the context of this work. Some common ways of representing memory accesses using a mathematical model are described in detail in section 2.4. Since all models are simplifications of the real world, there are applications they can not represent, which are typically handled by over-approximation. This limits the applicability of these approaches for the use of memory traces.
Simulation follows a different approach. Instead of analyzing an application’s source
code, the binary application is executed on a virtual model of the target hardware. The virtual model provides a detailed insight into the function of the lower levels of the hardware. The degree of accuracy between different simulators varies significantly. Some simulators operate on the instruction level and consequently can only extract
information at the ISA level. The Barra simulator is based on the simulator framework UNISIM and provides a functional simulator based on the CUDA PTX ISA without targeting a specific hardware target [36, 37]. A more detailed simulator is Multi2Sim, which simulates a system containing both a generic x86 CPU as well as an Advanced Micro Devices (AMD) Evergreen GPU on the instruction level [38, 39]. The highest level of detail can be extracted from simulators modeling the full architecture of a specific hardware. One such project is a reincarnation of the Multi2Sim project that simulates an NVIDIA GPU based on the Kepler architecture to a high degree of accuracy [40]. Another project is the GPGPU-Sim, which models large aspects of an NVIDIA GPU, including individual cores, memory controllers, and the central interconnection network [41]. As a consequence of this high degree of detail, executing an application on this simulator is slowed down by a factor of170,000x to 2,000,000x
[42]. For the collection of memory traces that tie a CUDA thread block to the addresses of its memory accesses, an ISA-level simulation is accurate enough since it does model the execution grid and the instructions contain the addresses in question.
The third option for the extraction of memory accesses is instrumentation, the
compiler-based insertion of specific instructions that emit information about the application. Instrumentation is often used to collect statistics about the execution profile of an application, e.g. to identify time-consuming code regions, compute test coverage, or locate memory leaks [43, 44]. The changes required for instrumentation are usually not complex and easily automated. Two different types exist: source instrumentation and binary instrumentation. Source instrumentation refers to the insertion of instrumentation code during the normal compilation of the program [23, 45]. Depending on where in the compilation pipeline the instrumentation code is inserted, it can interfere with the optimizations performed by the compiler, so instrumentation code should be added late in the pipeline for accurate results. While there are approaches that insert the corresponding code extremely early during the preprocessor stage [46], compilers often already include some instrumentation facilities [47]. An obvious requirement for source instrumentation is access to the source code of the application that is to be instrumented. The alternative, binary instrumentation, targets compiled applications and inserts either fixed or user-defined code into an application by carefully transforming the binary file, providing very accurate results but offering limited portability. Some projects go a step further and provide facilities for the modification of application during execution time [48]. Adding instrumentation to an application always increases its runtime, whether the code is inserted during compilation or as part of a binary translation [49, 44, 50, 51]. Although the amount of
overhead depends on the specific type of instrumentation added, the slowdown observed for popular instrumentation suites is between one and two orders of magnitude [52, 44]. Memory traces collected using instrumentation are accurate on the level of individual instructions. Although the lack of access to hardware internals might prevent the user from seeing the effects of techniques such as read-combining [53], the traces reproduce the exact sequence of memory accesses as seen by the application. Instrumentation on GPUs is not as common as on CPUs, but frameworks exist. GPU Lynx is a dynamic instrumentation tool and hooks into the CUDA runtime system to install user-specified code written in a C-like language [54]. Unfortunately, the project does not support any CUDA releases after version 5.0 and is limited to producing results of a fixed size, while memory traces are unbound in the general case. SASSI is a framework for static instrumentation of CUDA kernels and fully supports CUDA to specify instrumentation hooks [55]. However, it is a closed source solution that does not seem to be actively maintained. BARRACUDA is a custom binary instrumentation tool for CUDA that is used to develop instruction traces for race detection [56]. This project comes closest to fulfilling the requirements for the analysis in this work and a patched version of this framework could have been used instead.
2.4
Polyhedral Compilation
Polyhedral compilation is a set of techniques that is primarily used to optimize highly parallel numerical codes. The common ground for these techniques is the use of a rigorous mathematical model to describe the semantics of a program during the different stages of its optimization. At the core of this model are integer sets, called Z-polyhedra and relations between them [57, 58, 59]. The base functionality is implemented by several different libraries [60, 61, 62]. Other program representations with overlapping functionality exist, but are often less expressive or require more difficult proofs of correctness [63].
The polyhedral model is particularly useful to describe the behavior of loop nests and the memory accesses of instructions contained in them. Polyhedral sets can be used to accurately model the dynamic iterations of loops, with each iteration being represented by an n-dimensional integer tuple in a set containing all possible loop
iterations, n being the depth of the loop nest. In the polyhedral model as used in
the context of this work, polyhedral sets are described by formulas using presburger arithmetic [64]. A set can be described by either enumerating all points in the sets, describing the conditions to be in the set using a symbolic notation or combining
existing sets. The conditions, sets, and relations used in the polyhedral model are considered to be quasi-affine [65]. An example of a possible description for the set
S={0,1,2,3,4,8,9,10}, (2.1)
using the notation used throughout this document, is
{S[i] : 0≤i≤5∨8≤i≤10}. (2.2)
The list [i] after the name of the set S is used to both state the dimensionality of the
set and assign names to the dimensions. All quasi-affine conditions that define the tuples in the set are listed after the colon. The dimensions of a set are identified by their index and their names can be chosen arbitrarily, so the following is true:
{S1[i, j] :i= 0∧j = 1 }={ S1[a, b] :a= 0∧b = 1 } (2.3) Conditions can be parametrized by referencing named parameters that are declared by listing them before the set description. An example of a set with a parameter n is
[n]→ { S[i] : 0≤i < n }. (2.4)
Given the parameter n= 2, the resulting set is
S ={0,1}. (2.5)
In contrast to dimensions, parameters are identified by their name instead of their position, so the following equivalence is also true:
[a, b]→ { S[i] :a≤i < b }= [b, a]→ { S[i] :a≤i < b }. (2.6)
While naming polyhedral sets is convenient, the name can also be omitted, creating an unnamed, or anonymous, set.
Figure 2.6 shows a simple loop in C, containing two statements, S1 andS2. To a
human programmer, it is obvious that statementS1 is executed ten times, one time each
for i∈ {0,1,2,3,4,5,6,7,9}, and statementS2 is executed five times, one time each
for i∈ {0,2,4,6,8}. The execution of such a statement during run-time is considered its “dynamic instance”. The polyhedral model represents these dynamic instances of a statement as the statement’s domain. Using polyhedral sets, the domains of the
1 for (int i = 0; i < 10; ++i) { 2 S1: f(i); 3 if (i % 2 == 0) { 4 S2: f(i); 5 } 6 }
Figure 2.6: A simple loop containing two statements with different domains. corresponding statements can be described as:
{ S1[i] : 0≤i <10},and (2.7)
{ S2[i] : 0≤i <10∧imod 2 = 0 }. (2.8)
This example show cases one of the main benefits of a polyhedral program representation: high-level semantics are retained and expressed in a mathematical sound way. Notice how loop bounds and conditional branches can be translated into simple conditions that concisely and accurately describe the loop nest without relying on any of the control flow constructs of the original programming language. An equivalent while loop would result in the same polyhedral representation.
Memory accesses in the polyhedral model are represented as linear functions that map one polyhedral set to another. The domain of such an access is the domain of the statement it belongs and the image, the output, of this polyhedral map describes a set containing the array elements that are accessed. The notation for this is an extension from the notation for polyhedral sets:
[n]→ {[i, j]→[o] : 0≤i, j < n∧o=i+j } (2.9) describes an access from a 2-dimensional loop nest to a one dimensional array (both anonymous). The quasi-affine function that describes the array index is i+j.
Analo-gously to the dimensions in a set, the dimensions of a map’s domain and image are identified by their position, and can be arbitrarily named, resulting in the following sets all being equal
{ [i, j]→[o1, o2] :o1 = i+j, o2 =j }=, (2.10)
{ [i, j]→[o1 = i+j, o2] :o2 =j } =, (2.11)
1 int a[2*n];
2 int b[n];
3 for (int i = 0; i < n; ++i) {
4 S: b[i] = b[2*i] + b[2*i + 1];
5 }
Figure 2.7: A loop partially reducing an array by combining adjacent elements. Notice how the domains of these accesses are unconstrained. If these accesses were part of a program they would be executed for all points in an infinite 2-dimensional plane.
Figure 2.7 shows an example code in C that memory accesses on two different arrays. The statement S has the domain [n]→ { S[i] : 0≤i < n } and performs the following memory accesses:
Write : [n]→ { S[i]→b[i] : 0≤i < n } (2.13) Read 1 : [n]→ { S[i]→b[2i] : 0≤i < n } (2.14) Read 2 : [n]→ { S[i]→b[2i+ 1] : 0≤i < n } (2.15) Since polyhedral sets and maps can be manipulated using operators from set theory, the read accesses can be combined into a single map. Unions are represented by describing all sets in the union separated by semicolons, resulting in the set:
Read : [n]→ { S[i]→b[2i] : 0 ≤i < n; (2.16)
S[i]→b[2i+ 1] : 0≤i < n }
This union can be simplified by coalescing the accesses, resulting the equivalent set: Read :[n]→ { S[i]→b[o] : 0≤i < n∧2i <=o <= 1 + 2i } (2.17) Polyhedral maps can also be used to describe dependencies between statements. For this, the domain of the map represents the dependent loop nest and the map’s image represents the loop nest it depends on, both of which can be identical for dependencies within a loop nest. The edges in the map then reveal dependencies between iterations. As an example, the map
{ [i]→[o=i−1] : 0≤i, o <10} (2.18) can be used describes dependencies in a loop, where the first ten iterations must
occur in ascending order. Although this information is critical for the typical kind of optimizations performed using polyhedral frameworks [66, 67], a polyhedral model for dependencies between loop nests is not required for this work.
This representation then allows extensive analyses on the program including, but not limited to, queries such as the following [62]:
• The minimum and maximum indices of a memory access in each of its dimensions, which loosely corresponds to the bounds of an array. Both the lexicographic extremes as well as bounds for an individual dimension can be computed. • Different kinds of hull volumes, e.g. a convex hull that potentially
over-approximates the result. Such a hull volume can be used to estimate the upper bounds for the memory area affected by a memory access.
• Set theory operations on arbitrary polyhedra, for example, the intersection of the write set of one loop nest with the read set of another one as a simple way to compute data dependencies between the two.
The polyhedral model not only allows extensive analysis, but it also simplifies com-plex transformations. The simplification stems from the model’s ability to accurately and concisely represent data dependencies and correctly applying transformations to a set to all dependent objects. The rigorous mathematical model behind polyhedral compilation greatly simplifies proving the corrects of a given transformation by reducing it to a problem in set theory. Examples for these transformations are reordering of loop nests, or tiling of a loop nest by introducing additional loops, both of which are typically used to improve the locality of memory accesses resulting in a better utilization of CPU caches. However, this work uses polyhedral transformations only in a limited way to bring the application model into a canonical form that allows reasoning about the properties of a partitioned GPU kernel.
Translating an application from the polyhedral representation back to LLVM IR or any program representation requires advanced code generation techniques [68, 69, 70, 71]. The code generation tools provided by the popular polyhedral compilation libraries typically generate highly optimized code in a high-level representation such as an AST. Control flow in the AST is represented using the primitives of structured languages, in particular, for-loops and conditionals. The polyhedral optimizer then takes the high-level representation, lowers it into IR (or assembly), and inserts the statements of the original loop iterations to produce an optimized program. After code generation, the polyhedral model of the application is not required anymore and can
3
C
h
a
p
t
GPU Memory Access Patterns
This chapter covers the collection of traces containing the memory accesses of GPU applications, inference of the resulting communication if the application was partitioned among multiple GPUs, and an analysis of this communication. 1 Multi-GPU systems
are typically used for workloads with very large requirements on computational power and memory bandwidth. Examples include high-performance computing (HPC) [72] and training of deep neural networks [73, 74]. Multi-GPU solutions have also been proposed to overcome the scalability limitations of monolithic GPUs [75, 76]. However, compared to single GPUs, multi-GPU systems show strong Non-Uniform Memory Access (NUMA) effects, as on-card vs. off-card throughput differs by more than one order of magnitude [77, 72]. This drastic difference in throughput requires careful data placement and memory management, complicating the programming of multi-GPU systems.
The purpose of the analysis is to estimate certain characteristics of automatically split single-GPU applications, in particular, two properties are of interest:
1. the overall expected amount of communication, and
2. the scaling of communication with the number of partitions.
Using the behavior of a single-GPU application to infer properties of multi-GPU applications might seem unintuitive at first; after all, observing multi-threaded CPU applications to learn about distributed CPU applications is unlikely to yield useful results. However, the hierarchical memory and execution models of GPUs make this
approach feasible, as the introduction of additional GPUs just introduces another level in this hierarchy. Reliable communication between thread blocks during kernel execution is only possible in the form of atomic operations and their bad performance characteristics typically prohibit extensive use. As a result, most applications forgo the use of atomic operations and the applications are written in a way so that thread-blocks are fully independent of each other. The analysis in this chapter exploits this fact by first checking for the use of atomic operations and, if absent, virtually distributing the thread grid of single-GPU applications across multiple GPUs.
The contributions of this chapter are a tool that collects memory traces from GPGPU applications, a communication model to identify the internal communication of GPG applications, as well as an analysis based on this model of the traces of several popular benchmarks. Trace collection relies on a custom source instrumentation of the applications and is implemented as a plugin for an existing CUDA compiler. The resulting traces are then post-processed, summarizing all accesses occurring in a thread block into two sets: a read set and a write set. The summarized traces are analyzed using a simple communication model in combination with a virtual partitioning mechanism, revealing the communication that would be expected to occur if the given application was partitioned.
The analysis will be divided into five parts. First, design and implementation of the trace collection framework is presented. Then, the application model underlying the analysis is presented and it’s capabilities and limitations discussed. The third part gives an overview of the popular benchmarks suites and lists the benchmarks that are part of the analysis and provides explanations for the benchmarks that had to be left out. Fourth, the collected traces of these benchmarks are analyzed and the results discussed. The chapter concludes with a summary and puts the result into its context within this work.
3.1
GPU Memory Trace Collection
This section explains the design and implementation of the custom framework that has been used to collect memory access traces. It starts by shortly arguing the merits of instrumentation of other approaches of collecting information about memory accesses and then follows with details on the instrumentation framework used in this work.
Static Analysis
Instrumentation
Simulation Accuracy
Performance
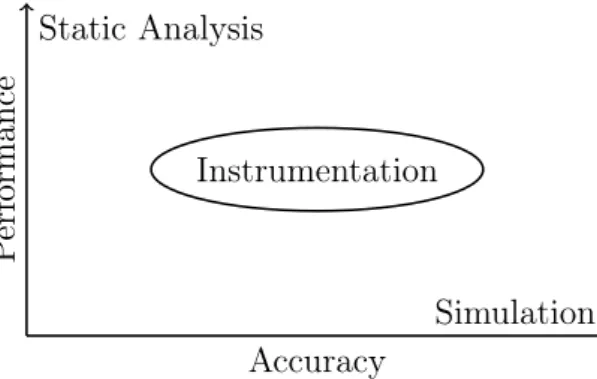
Figure 3.1: Broad comparison of different approaches to extract memory patterns based on accuracy and speed.
3.1.1
Extracting Memory Access Patterns from Applications
Several options exist to automatically extract memory access patterns from applications, as described in section 2: static analysis, instrumentation, and simulation. Figure 3.1 shows a simplified comparison of these approaches based on their two most basic characteristics accuracy and speed. Instrumentation acts as a middle-ground between the other two approaches. It does not require extensive static analysis and instead collects traces of memory accesses at runtime, similar to the simulation approach. Instead of executing the application on a simulator and using hooks inside the simulator to emit information about the application and processor state, hooks are inserted directly into the application, which is then executed on the target hardware. The hooks then call into code that emits the desired information. Inserting additional code naturally creates a runtime overhead. However, since the application is executed on real hardware instead of being simulated, this overhead is typically much lower (for CPUs about one to two orders of magnitude [52]). It has a rich history on CPU and many tools are available [49, 50, 51, 48], and any compiler can be extended to include some custom form of instrumentation. Although instrumentation can not provide the same level of detail in its traces, the available information is sufficient for the analysis, which only cares about the mapping of thread blocks to memory addresses of loads and stores.
Static analysis, on the other hand, might not be accurate enough. Although it is typically quicker than executing an instrumented application or simulating it on virtual hardware, static analysis often needs to resort to approximations for complicated memory accesses. How quickly it needs to resort to approximation depends entirely on the model in use. Most models are designed for the optimization of simple loop nests and so are usually limited to fairly simple linear, quadratic, or exponential expressions,
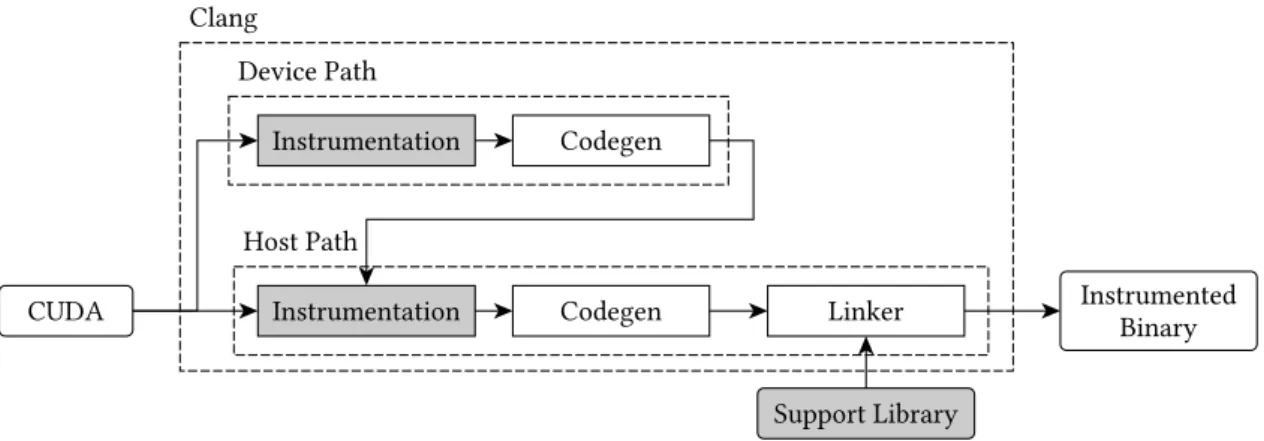
Figure 3.2: CUDA Compilation pipeline of Clang (gpucc) with tracing. Components required for memory tracing are highlighted in gray.
limiting their accuracy for general expression. Although the code of GPU applications often represents the inner loop nest and uses the thread grid as an implicit outer loop nest, this assumption can not be made in general. The accuracy of static analysis is therefore deemed too low. This leaves instrumentation as the most reasonable choice for the collection of memory access patterns.
3.1.2
CUDA Instrumentation using LLVM and Clang
The instrumentation framework used in this work is tailored specifically to the goals of the analysis: it is limited to global memory accesses only and does not distinguish between different threads of the same thread block, also called Cooperative Thread Array (CTA). Preserving the order of memory accesses within a kernel is, while a welcomed feature, not required and the resulting framework only preserves the order of memory accesses within a warp. Warps are the smallest unit of work that can be executed by a GPU, so the memory accesses in a trace file should be regarded as unordered within a kernel.
As the basis for the implementation of the instrumentation, the CUDA compiler gpucc from the Clang/LLVM project has been chosen. This greatly simplifies both the identification of insertion points for hooks and the code generation for these hooks and the code they call into. As Clang provides both the front end as well as all code generation, the instrumentation can work purely on the IR level. In contrast, binary instrumentation additionally requires parsing the machine code and updating it while keeping all relative references intact.
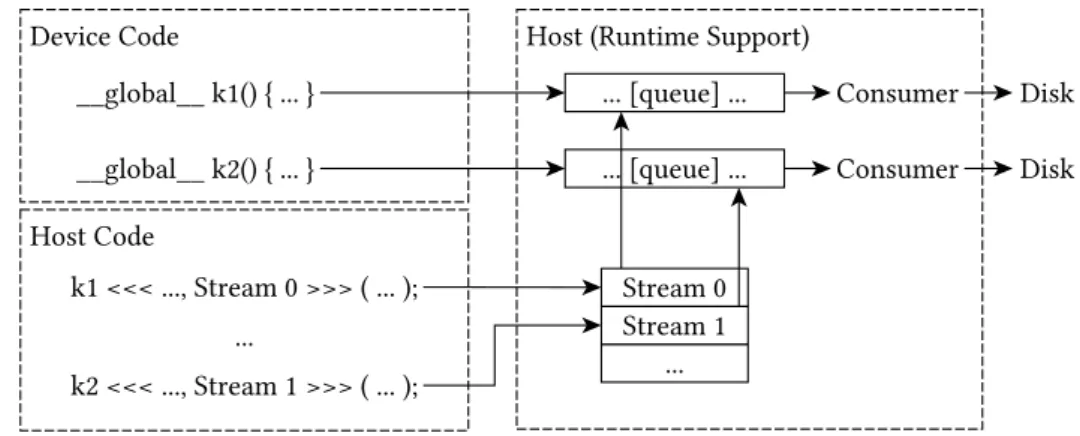
components (highlighted in gray) are integrated into it. The framework2 is designed as
a plugin for Clang/LLVM and a static library that is linked into the final application. This architecture provides a simple usage model that requires only a few compiler flags to be set to enable instrumentation. When the instrumented application is executed, a trace file is produced that, for each kernel, contains a list of records that describe each memory access of the application. Each record includes among other things the base address, kind, and origin of each memory access (the full data layout is described in figure 3.7). The instrumentation is split into three parts that roughly correspond to the components shown in figure 3.2. Device instrumentation enables trace collection and writes them into a queue that is setup using the host instrumentation; the queue implementation itself is part of the support library.
Device Code Instrumentation
The main part of the instrumentation framework is the device code instrumentation, which is broken up into three steps. The first step is preparation and force-inlines all inline-able function calls. If any un-inlined function calls remain, the instrumentation can not proceed and compilation aborts. The next step is the set-up of the context required to emit memory traces, which mainly consists of a set of queues set up by the host. Pointers to these queues are located using global device variables following a naming convention. Lastly, all load or store instructions targeting global memory are collected and instrumented. The instrumentation consists of the collection of all interesting information (CTA index, address, operand size) and pushing this information into the queue to host memory. Once the information is passed to the host, all work required by the device side is done.
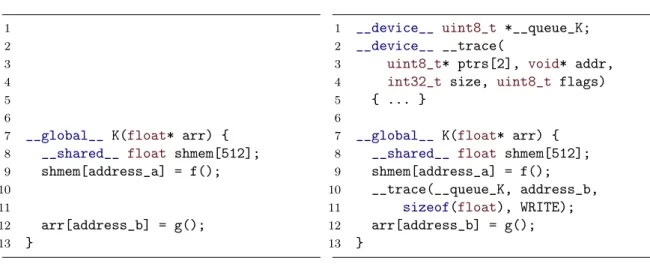
Figure 3.3 illustrates a simplified version of this process. The original code simply contains to write accesses, one to some address in shared memory and one to some other address in global memory. Line 1 of the instrumented code contains the device variable declaration that will contain the pointers to the queue at runtime (notice how the name contains the kernel name, not mangled here for clarity, as part of the naming scheme). The next line shows the injected helper function __tracethat provides access
to the queue. Inside the kernel, existing instructions are left untouched but right before the store to global memory a call to the __trace function has been inserted (note that
no such call was inserted before the write access to shared memory). The arguments to this helper function have been collected from the kernel and the store itself: the pointer to the queue, the memory access’ base address, the size of the operand and
2Liberally licensed under MIT and hosted on Github athttps://github.com/UniHD-CEG/
1 2 3 4 5 6
7 __global__ K(float* arr) {
8 __shared__ float shmem[512];
9 shmem[address_a] = f();
10 11
12 arr[address_b] = g();
13 }
(a) Original kernel code.
1 __device__ uint8_t *__queue_K;
2 __device__ __trace(
3 uint8_t* ptrs[2], void* addr,
4 int32_t size, uint8_t flags)
5 { ... }
6
7 __global__ K(float* arr) {
8 __shared__ float shmem[512];
9 shmem[address_a] = f();
10 __trace(__queue_K, address_b,
11 sizeof(float), WRITE);
12 arr[address_b] = g();
13 }
(b) Instrumented kernel code.
Figure 3.3: Simplified illustration of the device code transformation for memory access tracing on a simple CUDA code snippet.
the kind of access (read or write). Information about the CTA is gathered inside the
__trace function.
Host Code Instrumentation
The task of the host code instrumentation is to set up the environment for the device code to produce traces and to process these traces. Most of the more complex functionality is implemented externally in the support library, reducing host code instrumentation to a two-step process:
1. Locate kernel calls, and
2. Install setup and tear down code for the support library.
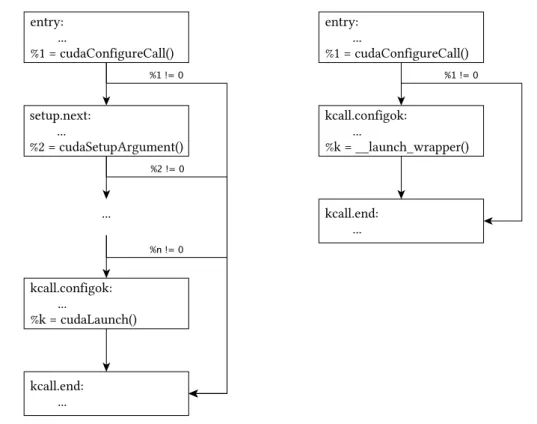
Locating kernels in the host code requires a surprising amount of analysis on the IR level. LLVM IR is a low-level program representation that lacks the higher semantics of most programming languages, including CUDA kernel launches. In IR, CUDA kernel launches are lowered into a sequence of function calls into the (stateful) CUDA Runtime API. Figure 3.4 shows control flow graphs for the two possible structures of IR generated for a kernel launch. The graph on the left illustrates the inlined version of a kernel launch and the right graph illustrates the extracted version using a wrapper. The process is best illustrated using the version with inlined code. The first IR generated for the kernel launch (in theentry basic block) is a call to the cudaConfigureCall API
function, configuring the execution grid and shared memory of the next kernel launch. If this call has a non-zero value, indicating an error, the code branches to a landing pad basic block (called kcall.end). Next, one basic block for each of the arguments of the
Figure 3.4: Kernel calls after lowering into LLVM IR by Clang. The left shows the inlined version, the right shows the wrapped version.
kernel is created. A call to cudaSetupArgument instructs the CUDA API to prepare the
corresponding argument with the given value, a non-zero return value again results in aborting the kernel launch by branching to the landing pad. After the execution grid, shared memory, and arguments are set up, the kernel is launched in a basic block with the prefixkcall.configokusing the (non-blocking)cudaLaunch API function. The kernel
launch finishes by branching to the landing pad, regardless of the call’s return value. If the code is not inlined, the argument preparation and kernel launch are extracted into a wrapper function, but the overall control flow is very similar. The pair of basic blocks (entry, kcall.end) describes a single-entry single-exit (SESE) region that encapsulates
the kernel launch. This fact is exploited for kernel launch location by first location calls to cudaConfigureCall and then following the CFG to a basic block where the name
is prefixed with kcall.configok. The last call in this basic block must be either a call
to cudaLaunch or a call to the wrapper function.
Installing the setup and tear-down code then is simply a matter of inserting some function calls into a kernel launch region that has been identified. Figure 3.5 shows a simplified version of the transformation in CUDA source code. First, the CUDA stream