RESEARCH ON FURNITURE IMAGE MODELLING DESIGN
BASED ON KANSEI ENGINEERING
1
ZHANG ZHONGFENG, 2HUANG KAI, 3YE YONGJUN
1
Assoc. Prof., Department of Furniture and Art Design, Central South University of Forestry and
Technology, Changsha, 410004, CHINA
2,3
Student, Department of Furniture and Art Design, Central South University of Forestry and Technology,
Changsha, 410004, CHINA
E-mail: [email protected], [email protected], [email protected]
ABSTRACT
In order to design furniture products which to meet the consumers’ emotional needs, it proposed the framework of furniture image modelling design based on Kansei engineering and took wood sofa chair for example to conduct the in-depth research. Firstly, it selected the typical samples of sofa chair. Then it analysed the perceptual images of samples with the expert access method and questionnaire method, and the perceptual images were integrated by the modelling attraction with the graphical method. Finally, SPSS was used for the multiple regression analyses to establish the quantitative relationship between the modelling attraction and modelling elements based on the quantification theory I to provide the scientific guide for the wooden sofa chair image modelling design. The results of this research show that expanding the application of Kansei engineering in furniture design has broad prospects.
Keywords: Kansei Engineering (KE), Furniture Image Modelling Design (FIMD), SPSS, Mathematical
Model (MM), Emotional Needs (EN)
1. INTRODUCTION
With the development of social economy and the improvement of people’s living standard, material satisfaction makes people pay more attention to emotional needs. In this era of diversified products designing, perpetual design based on people’s emotional needs and spiritual fulfilment is becoming a new trend of design thought. Modern furniture products have many more industrial product attributes, furniture design also reflects many more characteristics of the common product design [1]. New challenges designers are faced with are to be aware of the instant changes about furniture, and to design the furniture which can much more meet the consumers’ needs [2-3]. Kansei engineering research focuses on the discussing about the relationship between products and man, which is defined as a kind of technology of translating the feelings or images of consumers into the product design elements [4]. In recent years, some domestic scholars had studied the application of Kansei engineering in the furniture design. For example, Wu quantified the consumers’ perceptual cognition received from furniture form elements by using Kansei engineering technology,
attraction to integrate perceptual images, and established the quantitative relation between modelling attraction and perpetual elements by multiple regression analysis based on the
[image:2.612.165.460.161.308.2]quantitative theory I, so as to design the appropriate furniture modelling to meet consumers’ emotional needs and to realize the dialogue between consumers and furniture in the end.
Figure 1: The framework of furniture image modelling design based on Kansei Engineering
2. THE TYPICAL SAMPLES SELECTION
OF FURNITURE
After investigating the wooden sofa chair in furniture stores and magazines, reading the introduction manual of furniture products, and surfing the Internet, etc., it made samples collection preliminary and 108 samples of sofa chair were
[image:2.612.84.528.450.571.2]obtained. Then 20 representative samples (Table 1) were selected at last with the method of the multidimensional scaling analysis and cluster analysis. In order to avoid the effect of colour factors on the furniture emotional image in this study, the colours of representative samples were removed.
Table 1: Selected representative samples
2 6 21 24 25 29 34 37 39 41
43 46 49 56 58 63 68 72 80 92
2.1 The Collecting and Screening of
Representative Perceptual Vocabularies
Through the brainstorming with the research team members, the information provided by the sellers in furniture stores, brochures of furniture products, networks, magazines, and other ways, it got the emotional image vocabularies about wooden sofa chair. Then it preliminary selected, modified, classified the emotional image vocabularies with the expert method ( The experts are furniture design professional teachers and senior furniture designers) allowing for the characteristics of the modelling of the wooden sofa
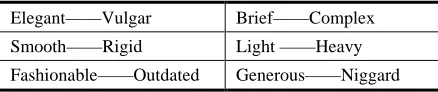
chairs, and screened six pairs of adjectives (Table 2) with the explicit image tendency eventually.
Table 2: The selected pairs of emotional image vocabularies
Elegant——Vulgar Brief——Complex Smooth——Rigid Light ——Heavy Fashionable——Outdated Generous——Niggard
2.2 The Design of Questionnaire
[image:2.612.308.527.616.662.2]semantic differential scale for the six pairs of emotional image vocabularies (Table 3) to make up
[image:3.612.98.295.498.636.2]a questionnaire.
Table 3: The SD Scale of Sample 72
Elegant 3 2 1 0 -1 -2 -3 Vulgar
Brief 3 2 1 0 -1 -2 -3 Complex
Smooth 3 2 1 0 -1 -2 -3 Rigid
Light 3 2 1 0 -1 -2 -3 Heavy
Fashionable 3 2 1 0 -1 -2 -3 Outdated
Generous 3 2 1 0 -1 -2 -3 Niggard
2.3 Integrated Evaluation of Modelling
Attraction
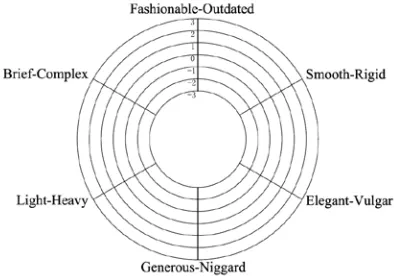
It integrated the selected perceptual images to form the modelling attraction structure figure (Figure 2). The Six periods of circular arc were respectively on behalf of the six pairs of emotional image vocabularies with clearly image tendency. -3 to 3 showed the seven levels, the larger circle showed larger modelling attraction and the outermost circle is the ideal state of furniture image modelling design. The value of Modelling attraction can be expressed as the ratio between the sum of the value of the perceptual image and the sum of the value of the largest of the six pairs of the perceptual image. This research contacted the 100 students of in our school as the subjects with the male to female ratio of 1:1 by using the method of network evaluation. Because of their active cooperation, the issuance of 100 questionnaires were fully recovered which were valid questionnaires.
Figure 2: The modelling attraction structure figure
3. ANALYSIS OF MODELLING ELEMENTS
3.1 Determination of Modelling Characteristic
Elements
This research contacted the 100 students of in
our school as the subjects with the male to female ratio of 1:1 by using the method of network evaluation. Because of their active cooperation, the issuance of 100 questionnaires were fully recovered which were valid questionnaires. This research analysed the modelling characteristic elements of wooden sofa chair with the basic principles of the method of morphological analysis. Firstly, it took the structure of the sofa chair as the assembly of certain design elements. Then the modelling was divided into several independent items, such as seat, armrest, sofa leg, backrest, cushion, headrest and so on. And then each item was subdivided into certain characteristic elements which were called categories, such as armrest item was divided into linear type, curve type, geometry type, non-geometric type and so on. Therefore, it identified preliminary characteristic elements rely on deconstructing the wooden sofa chair.
3.2 The Design of Questionnaire
According to the identified sequence of item, category of the modelling characteristic elements, it established the decomposition table of modelling characteristic elements (Table 4) with the method of 5-scale Rick scale, which finally formed the questionnaire.
3.3 Evaluation of the Modelling Elements
Considering the furniture modelling needed certain professional knowledge, this research took 30 post-graduates who were majoring in art design in our school as the subjects with the ratio of 1:1 between male and female. With their cooperation, the answers of 30 questionnaires were all effective.
4. ESTABLISH THE RELATIONSHIP OF
MODELLING ATTRACTION AND
MODELLING ELEMENTS
questionnaires was processed by EXCEL software, it got the average values of (Table 5) of modelling attraction evaluation which came from the subjects’ evaluations towards the 20 samples of wooden sofa
[image:4.612.85.528.164.252.2]chair, along with the deconstructed items and categories of the sofa chair with higher scores (Table 6).
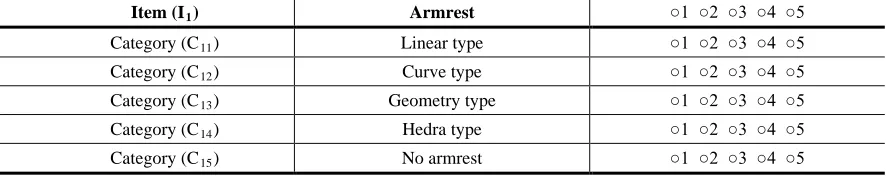
Table 4: The decomposition table of armrest modelling characteristic elements
Item (I1) Armrest ○1 ○2 ○3 ○4 ○5
Category (C11) Linear type ○1 ○2 ○3 ○4 ○5
Category (C12) Curve type ○1 ○2 ○3 ○4 ○5
Category (C13) Geometry type ○1 ○2 ○3 ○4 ○5
Category (C14) Hedra type ○1 ○2 ○3 ○4 ○5
[image:4.612.85.529.278.362.2]Category (C15) No armrest ○1 ○2 ○3 ○4 ○5
Table 5: The average values of modelling attraction evaluation
Sample Average Sample Average Sample Average Sample Average
1 0.22 6 -0.04 11 0.07 16 0.16
2 0.16 7 -0.06 12 0.29 17 0.32
3 -0.02 8 0.22 13 0.55 18 0.28
4 0.35 9 0.39 14 0.36 19 0.27
[image:4.612.82.529.388.486.2]5 0.56 10 0.38 15 0.16 20 0.46
Table 6: Mainly modelling elements
Item (I) Category (C)
Backrest (I1)
Line type C11
Surface type C12
Three-dimensional type C13
Others C14
Armrest (I2)
Linear type C21
Curve type C22
Geometry type C23
Hedra type C24
No armrest C25
Leg (I3)
Round type C31
Square type C32
No leg C33
Others C34
Seat (I4)
Round type C41
Square type C42
Others C43
In the process of transforming the perceptual evaluation scale into the engineering scale, scholars usually use the method of the quantification theory I, the neural network algorithm, the genetic algorithm, the rough set analysis, etc. And the quantification theory I is the most commonly used method [10]. Quantification theory I studies on the relationship between a group of qualitative variables X (independent variable) and a set of quantitative variables Y (dependent variable), and the multiple linear regression is used to establish a mathematical model between them to achieve the observation of dependent variable Y [11]. The quantification theory I was used in this research to establish the relationship between the modelling attraction and furniture modelling elements. When the qualitative data in item I, sample S was the category C, It named δs=1, otherwise δs=0. Among
them: S was the sample, I was the Item, C was the category, and S (I, C) was referred to the reaction of
category C of item I in sample S. So the modelling factors of the 20 samples were quantified and transformed into quantitative data represented by 1 and 0, which was the reaction value of each sample modelling element. Therefore, this research viewed the average values of modelling attraction evaluation as the dependent variables and the reaction values of modelling elements as the independent variables to create a multiple linear mathematical prediction model as follows:
Y=A11C11+A12C12+A13C13+A14C14+A21C21+A2
2C22+A23C23+A24C24+A25C25+A31C31+A32C32+A
33C33+A34C34+A41C41+A42C42+A43C43+M
(1)
Among Equation 1, Y was the average value of modelling attraction evaluation; Aij was the
element (i was the item, j was the category), and M was the constant value.
This research used SPSS18.0 software to solve the model, which viewed the reaction values of 20 samples modelling factors as the independent variables, along with the average values of
[image:5.612.81.528.199.481.2]modelling attraction evaluation as the dependent variables. The results were obtained by the multiple linear regression analysis and the partial correlation analysis including the coefficient of determination, the partial correlation coefficient, the constant value, the category score and so on which were collated to get the available information data (Table 7).
Table 7: The analysis results of relationship between modelling attraction and modelling elements
Item Category Partial correlation
coefficient
Category score
Modelling attraction
I1
C11
0.75
0.177
C12 -0.222
C13 -0.159
C14 Ruled out
I2
C21
0.90
0.261
C22 0.270
C23 0.029
C24 -0.196
C25 0.538
I3
C31
0.86
0.062
C32 0.082
C33 -0.076
C34 -0.041
I4
C41
0.54
0.100
C42 Ruled out
C43 -0.200
Coefficient of
determination 0.863 Constant value 0.128
5. RESULTS ANALYSIS AND DESIGN
GUIDANCE
(1) The partial correlation coefficient represents the effect of each item on modelling attraction and the larger the value, the greater the effect. The results in Table 7 show that the effect of all items on the modelling attraction of the wooden sofa chair is: Armrest > Leg > Backrest > Seat. So when designing a wooden sofa chair, we should make the modelling design of armrest a priority to improve the modelling attraction of the wooden sofa chair to drive people’s attention.
(2) The category score represents the degree and direction of effect cast by a specified category upon the modelling attraction. And the positive score implies attraction, and a negative score implies antipathy, and the expelled categories were found hardly effective to the attraction. The results in Table 7 show that the linear type of backrest is
usually more attractive than the surface or three-dimensional type of backrest, and other types of backrests and the square types of seats were hardly correlated with the modelling attraction, which is consistent with the fact that in practical furniture markets the backrests of wooden sofa chair rarely come with other types and the seats mainly come with the square types. So we should pay more attention to the application of model design factors that represent significant attraction.
(3) From Table 7, we can infer the prediction function representing the relationship between the modelling attraction and all the modelling factors of wooden sofa chair: Yattraction = 0.177C11+0.222C12
-0.159C13+0.261C21+0.270C22-0.029C23-1.96C24+
0.538C25+0.062C31+0.082C32
-0.076C33+0.041C34+ 0.100C41-0.200C43+0.128
effectiveness of the above-mentioned function, we reselected our samples and conducted a survey, the results of which were sent to T testing analysis along with the results predicted by the function. And the T testing analysis implies that the significance level is above 0.05 with no significant differences, which is a fairly reasonable result. The function can provide the judgment on the consistency between the perceptual images delivered by the designers’ image modelling design schemes and the emotional needs of customers to provide the evidence for selection of designing schemes and further optimization.
6. CONCLUSION
(1) The framework of furniture image modelling design based on Kansei engineering is proposed in this paper.
(2) It takes wooden sofa chair for example to make a systematic study. It analyse the perpetual images of wooden sofa chairs which were integrated by the modelling attraction, determined the modelling elements, and constructed the mathematical model for the modelling attraction and modelling elements by SPSS soft based on the quantitative theory I.
(3) The research results can provide scientific guidance in furniture modelling design to satisfy users’ perceptual needs. Furthermore, using this research method can quantitatively analyse the furniture colour or material images, and can also be applied in computer-aided design to evaluate the design effect, which will make the elaborately coded perceptual information by designers can be correctly decoded by users through the furniture products to really meet consumers’ emotional needs. Therefore, the application of Kansei engineering in furniture design should be expanded to make up for the deficiency of the traditional design method, which has the broad development space.
ACKNOWLEDGMENTS
This work was financially supported by the Plan Projects of Introducing Advanced International Forestry Technology (2012-4-27), the National Natural Science Fund of China (31070577), the Outstanding Youth Projects of Hunan Province Education Department (12B134) and the Plan Projects of Hunan Province (2012GK3146).
REFRENCES:
[1] W.J. Liu, H. Zhang, “Quantitative model construction of furniture modelling characteristics”, Journal of the Central South University of Forestry and Technology, vol. 31, no. 2, pp. 1-6, 2011.
[2] L.Q. Li, Z.F. Zhang, and K. Huang, “Study on innovative design of old ship wood furniture”,
Packing Engineering, vol. 33, no. 14, pp. 56-59, 2012.
[3] K. Huang, Z.F. Zhang, and L.Q. Li, “Study on the relation of the furniture product form and modelling elements”, Advanced Materials Research, vol. 591-593, pp. 2527-2530, 2012.
[4] M. Nagamachi, “Kansei engineering: a new ergonomic consumer-oriented technology for product development”, International Journal of Industrial Ergonomics, vol. 15, no. 1, pp. 3-11, 1995. [5] S. Wu, “Emotional study in form element of
furniture”, Beijing forestry university, China, 2009. [6] Z.J. Chen, “Study on the model of the furniture
Kansei Image of the consumer and the designer”,
Journal of Graphics, no. 5, pp. 53-62, 2010. [7] J.B. Gong, “The research on visual characteristics
based on the chair of metal and plastic material”,
Nanjing forestry university, China, 2012.
[8] H.C. Chang, H.H. Lai, and Y.M. Chang, “A measurement scale for evaluating the attractiveness of a passenger car form aimed at young consumers”,
International Journal of Industrial Ergonomics, vol. 37, no. 1, pp. 21-30, 2007.
[9] Y.E. Li, Z.Y. Wang, and N. Xu, “Kansei engineering”, Maritime Press, China, 2009.
[10]Y.F. Li, L.P. Zhu, “Research on product design method based on Kansei engineering”, Packaging Engineering, vol. 29, no. 11, pp. 112-114, 2008. [11]J.N. Su, H.Q. Li, “Investigation of relationship of