ISSN: 1992-8645 www.jatit.org E-ISSN: 1817-3195
VALIDATION OF A PROPOSED DASHBOARD MODEL FOR
RESEARCHERS IN SOCIAL RESEARCH NETWORK SITES
1
SITI HAWA APANDI, 2RUZAINI ABDULLAH ARSHAH
1,2
Faculty of Computer Systems & Software Engineering, Universiti Malaysia Pahang, Gambang, Kuantan,
Pahang, MALAYSIA
E-mail: [email protected], [email protected]
ABSTRACT
The Social Research Network Sites (SRNS), online platform used by researchers, have huge amounts of information that would sometimes overwhelm the researchers. However, they need a dashboard as a tool to provide awareness on current information that are related to their fields of research; thus, the proposed dashboard model for the researchers in the SRNS is designed. This paper aims to discuss the validation of the dashboard model for the researchers in the SRNS by conducting an interview session, which is conducted among the researchers that consists of academic staffs and postgraduate students from the universities in Malaysia. After being shown the dashboard model and the accompanying mock-up prototyping representing the dashboard model, the researchers were asked to gauge their satisfaction on the dashboard model and their intention of using the model. The outcome of the interview is that the researchers are satisfied with and intended to use the dashboard model, while suggesting some enhancement of the dashboard components to be included in the dashboard model. The dashboard model can be used by a developer of the SRNS as a guideline to develop a better online platform for the researchers by including the dashboard in the SRNS.
Keywords: Dashboard model, Social Research Network Sites, Researchers, Validation, Interview
1. INTRODUCTION
Nowadays people use the social media, such as social networking sites, forums and blogs, to connect with one another, do business and socialize in the online world. The growth of social media is also having an impact on the research community [1], and among the various sites, the social networking sites are identified as the most useful tool that support the phase of a research lifecycle [2-4]. Consequently, many of today’s researchers adopted more than one tool of the social networking sites for research-related activities [1, 5, 6].
There is a specialized social networking site for researchers known as Social Research Network
Sites (SRNS) [7], such as Academia.edu,
ResearchGate and Mendeley [1, 8, 9]. The researchers use the SRNS in order to fulfill their needs such as to find other researchers with similar interests or expertise, to keep in touch with their peers and to share information [10, 11], while
research results in a certain domain, changes in the structure of a network, personal changes within a project as well as knowledge about objects that may help carrying out one’s task” [13]. From the interviews conducted, the interviewees claimed that they need the “awareness functionality to be embedded in their regular workflow”.
The SRNS has an issue in supporting research activities as it contains huge amounts of
information, which would overwhelm the
ISSN: 1992-8645 www.jatit.org E-ISSN: 1817-3195 statement of this study, while discussing the related
work of dashboard for the researchers in Section 3. The design of dashboard model is then presented in Section 4, after which the methodology used in this study is explained in Section 5. This is followed with the elaboration on the validation of the dashboard model based on the analysis of the interview session in Section 6. Finally in Section 7 is the conclusion of the study.
2. PROBLEM STATEMENT
The existing social networking sites are still insufficient for the researchers’ needs due to the lack of study that analyzes requirements in the sites, especially for researchers [7]. The researchers remain scattered across a range of the social networking sites services in order for them to use different features that are provided in the social networking sites. This phenomenon has caused the researchers to consume a lot of time in managing all the different social networking sites that they use [2, 5, 8, 12].
When researchers use the SRNS, they are constantly generating information that an individual researcher might want to know, such as about other researchers and publication papers that are related to their research interests. However, he may fail to do so as the SRNS is clogged with information that is not of his interested or is not related to his field of research [3, 9, 12]. This is similar with the awareness support in the context of Research Networks that want to make “actors more efficient and effective by making objects (such as people, papers, projects, events, research domains, writings, experts and social media artifacts) and their relations to each other more noticeable for users” [9, 14].
In order to cope with the huge amount of information in the SRNS, researchers need the awareness support to be embedded in their research practice [9, 13]. By doing so, the effectiveness of how information is spread in communities is improved [15] and positively influences social interactions taking place in those communities [16]. Hence, they need for a tool that can provide awareness support for the researchers. Dashboard can be used to provide awareness facility to the researchers because, from a user interface perspective, it is a facility in which users may find aggregated information about the system’s current state, personal notifications, news and other important transactions [3].
3. RELATED WORK OF DASHBOARD FOR
THE RESEARCHERS
There are several definitions about the
dashboard. The dashboard has been defined as “a visual display of the most important information needed to achieve one or more objectives, consolidated and arranged on a single screen so the information can be monitored at a glance” [17]. It has been described as “a software application that provides a single-screen display of relevant and critical business metrics and analytics to enable faster and more effective decision making” [18]. It has also been stated that it is like an executive intranet, which is a site in which every information of interest is displayed in logical groupings [19]. The health of an organization can be monitored using the dashboard as decision makers could access key performance indicators, which is actionable information used to guide business performance.
Currently, there are limited studies concerning
the implementation of the dashboard for
researchers. Reinhardt, et al. [3], for example, put
forward a widget-based dashboard called
AWESOME to support the researchers’ awareness of their Research Networks, but has the issue on addressing the participants’ lack of knowledge on widget facility. There is also an application called PUSHPIN that helps researchers notice their connections to other researchers and publications that they might be interested in by making recommendations [9]. By having recommendations, users can notice the existence or linkage between objects likes researchers and publication papers that would have stayed hidden [3].
There are still more work can be done in the dashboard for the researchers, such as introducing metrics to measure the researcher performance. The impact factor is an example of the metric to measure the researcher’s performance, which would help them know their ranking in the research community. It has been that “ranking mechanism can create an enthusiasm for users to increase their rank and enhance their position in their university or colleges” [20].
ISSN: 1992-8645 www.jatit.org E-ISSN: 1817-3195 Every day, each research field gets deeper with
increasing number of publication papers and researchers. Research trend can be generated by noting the number of publications in a research domain within a particular year. The dashboard can be used to monitor if the domain is expanding or diminishing. In addition, the dashboard has the potential to be used to help researchers measure their performance and keep them informed on the latest events in their research domain.
4. DESIGN OF DASHBOARD MODEL FOR
THE RESEARCHERS IN THE SOCIAL RESEARCH NETWORK SITES
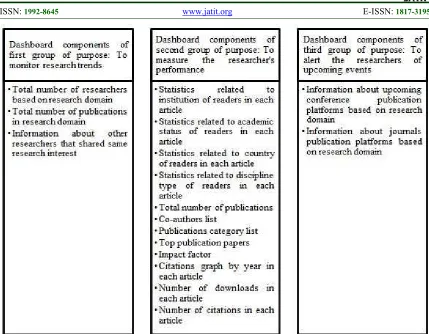
Figure 1 shows the dashboard components used in the design of the dashboard model for researchers in the SRNS. The purpose of the dashboard components, derived as a result of using factor analysis on the data acquired from the survey, can be grouped into three: 1) to monitor research trends, 2) to measure the researcher’s performance, and 3) to alert the researchers of upcoming events.
Figure 2 shows the proposed dashboard model for researchers in the SRNS, the design of which is based on the dashboard components. In the figure, the green boxes indicate the menu items in the model, the blue boxes state the purpose of the items in the menu, and the red boxes list the dashboard components. The items shown in the green boxes are researcher performance (M1), research trends (M2), and research events alert (M3), which are derived based on Figure 1.
The purpose of researcher performance (M1) in the menu of the dashboard model is to measure the performance of the researchers based on their own publications (P1). The dashboard components in (M1), derived from the second group of purposes in the dashboard components of Figure 1, can be divided into three distinct purposes, which are category of publications (P1a), quantity of publications (P1b), and research impact of publications (P1c). The dashboard component for
category of publications (P1a) are the different types of publications list (DC1a), such as conference papers, journal articles, books, edited books and edited book chapters. The dashboard component for the quantity of publications (P1b) is the total number of publications (DC1b). The dashboard components for research impact of publications (P1c) are the list of co-authors, top publication papers, impact factor, citations graph by year in each article, number of downloads and citations in each article, and the statistics related to institution, academic status, country and type of discipline in each article (DC1c). From the research impact, the researcher would be able to know the influence of their publications on the research community.
The purpose of research trends (M2) in the menu of the dashboard model is to enable the researchers monitor research trends (P2) that are related to their research domain. The dashboard components in (M2), derived from the first group of purposes in the dashboard components of Figure 1, are the total number of researchers based on the research domain, information on other researchers that shared the same research interest, and the total number of publications in their research domain (DC2). This dashboard component would enable the researcher to see the growth of the research domain as well as viewing the details of other researchers that shared the same research interest.
The purpose of research events alert (M3) in the menu of the dashboard model is to make the researchers aware of upcoming events (P3) that are related to their research domain. The dashboard components in (M3), derived from the third group of purposes in the dashboard components of Figure 1, are information on related journals and upcoming conference publication platforms (DC3). This dashboard component would enable the researcher to view any upcoming conference and journal that are related to their research domain.
ISSN: 1992-8645 www.jatit.org E-ISSN: 1817-3195
ISSN: 1992-8645 www.jatit.org E-ISSN: 1817-3195
ISSN: 1992-8645 www.jatit.org E-ISSN: 1817-3195
5. METHODOLOGY
Figure 3 shows the methodology used in this study. In the first phase, an interface design, also known as mock-up prototyping, to represent the dashboard model is created to enable the researchers understand the dashboard model. The study by Vonk, as cited in [23], stated that the focus of the mock-up prototyping is on the external appearance, such as the screen of the system but without including functionality. The purpose of the mock-up prototyping is to evaluate the researchers’ reactions to the appearance of the dashboard model in a web browser. A software called Adobe Dreamweaver is used to create the mock-up prototyping for the dashboard model. For example, Figure 4 shows the screenshot of the mock-up prototyping for item menu research events alert (M3) in the dashboard model. The purpose of this screen is to make the researcher alert on upcoming events (P3), such as journal and conference publication platforms that are related to their research domain that have been define by the researcher. Shown in Figure 4 are the list of conferences that are related to the research domain of Information Systems.
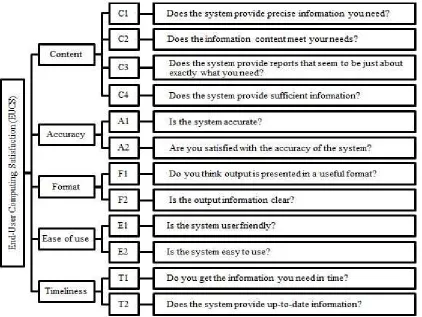
In the second phase, the interview questions were designed in order to gauge the researchers’ satisfaction and intention to use the dashboard model. The interview questions used to measure the researchers’ satisfaction is designed based on End-User Computing Satisfaction (EUCS) instrument [24]. The EUCS instrument model as shown in Figure 5 has been used as a standardized instrument for measuring user
satisfaction of an information system [25, 26], consists of five factors and 12 questions. [24]
Table 1 shows a description of the five factors of EUCS, which are content, accuracy, format, ease of use and timeliness. Among the five factors, the content factor should be included in the interview questions for this study, thus the inclusion of questions C2 and C4 as shown in the EUCS instrument model. C2 is used to measure whether or not the dashboard model meets the needs of the researchers, while C4 is used to measure whether or not the dashboard model provide sufficient information. The content factor measures the ability of a system to provide the information without the user having to actively interact with the system. It is related with the dashboard concept in which the dashboard is used to display information without user interaction.
In the third phase, the dashboard model is validated by conducting the interview session with the researchers in order to seek their feedback regarding the dashboard model. The interview session is conducted among the researchers who are the academic staffs and postgraduate students from universities in Malaysia. An interview protocol consisting of five sections was prepared for the interview session. The protocol is a form that contains instruction for the process of the interview, the questions to be asked and space to take notes of the researchers’ responses [27], which is as follows:
i. The researcher will be given a brief
introduction about this research study.
ii. The researcher will view the dashboard
model.
iii. The researcher can click the link in a web
browser to view the mock-up prototyping that
is used to represent the dashboard model: http://dashboardmodel.webuda.com/modelV5
iv. The interview questions will be asked to the
researchers in order to gauge their satisfaction regarding the model and their intention to use the dashboard model.
v. The information about the researcher will be
recorded.
In the final phase, the result of the interview will be analyzed in order to gauge the satisfaction of the researchers with the dashboard model and their intention to use the model.
ISSN: 1992-8645 www.jatit.org E-ISSN: 1817-3195
Figure 4: Screenshot Of Mock-Up Prototyping For Item Menu Of Research Events Alert (M3) In The Dashboard Model
[image:7.612.98.520.335.652.2]ISSN: 1992-8645 www.jatit.org E-ISSN: 1817-3195
Table 1: Description Of Factors Of End-User Computing Satisfaction (EUCS)
Factor of EUCS Description
Content The content factor is related to the ability of the system to provide the information
that meets the user’s needs. The system should provide the information without waiting for user interaction with the system [28].
Accuracy The accuracy factor is related to the precision of the information provided in the
system [25, 29].
Format The format factor related to the information is in a useful and easy to understand
format [29].
Ease of use The ease of use factor is based on impression of the user when using the system,
whether it is user friendly and easy to use [25, 28, 29].
Timeliness Day [25] states that the timeliness factor can be separated into two components:
efficiency (the number of steps taken to complete a task) and speed (the length of time taken to complete a task). It involves user active interaction with the system. It is also related to up-to-date information [29].
6. VALIDATION RESULT OF DASHBOARD
MODEL BASED ON ANALYSIS ON INTERVIEW SESSIONS
The interview session is conducted with the researchers in order to validate the dashboard model. The advantage of adopting the interview is that it can provide additional perspectives in terms of how the researchers feel towards the dashboard model. Previous study has shown the interview has been used as a tool to validate proposed research model [30]. The researchers who are invited to participate in the interview session consist of academic staffs and postgraduate students from selected universities in Malaysia. They are selected using a snowball sampling approach which is a form of purposeful sampling, in which the identified researchers were asked to recommend other researchers to be interviewed in order to validate the dashboard model. The researchers are individually interviewed and each interview session lasts about 30 minutes.
There are seven researchers who participated in the interview session. The session is terminated once the results from the researchers are found to be consistent. This is similar to the approach used in a study by Nielsen [25] who found that it is sufficient to test using five participants if the same findings are repeatedly obtained. The researchers were made up of five senior researchers and two junior researchers. A senior researcher was defined as one who has a doctoral degree and has been involved more than five years in doing the research [31, 32]. In this study, the senior researchers consist of professors and senior lecturers who have been involved in the research for nine to 19 years. The junior researchers consist of a PhD student and a
Masters student, who have been involved in research for three and two years, respectively. In terms of the SRNS usage, all of the researchers, except one, have used the SRNS for their research works. The Google Scholar Citations is an example of the SRNS that is mostly used by the researchers.
The focus of the interview questions is to measure the researchers’ satisfaction towards the dashboard model and their intention to use the model. The questions will help measure the three menu items in the dashboard model: researcher performance (M1), research trends (M2) and research events alert (M3). This is done in order to determine if the dashboard model meets the requirements and provide sufficient information to the researchers. They were asked to suggest other dashboard components that should be added into the dashboard model, and their intention on using the model. The type of interview used in this study is a semi-structured interview, where the interview questions started with a close-ended question (“yes” and “no” options) and followed by open-ended questions in which the researcher indicate reasons for their responses. In order to analyze the validation result of the dashboard model, the responses from the researchers were examined. If the majority of the researchers agree on a set of interview questions, it is assumed that the dashboard model can be accepted by the researchers.
The result of the interview regarding the validation of the dashboard model is as follows:
i. Intention of the researchers to use the
dashboard model
ISSN: 1992-8645 www.jatit.org E-ISSN: 1817-3195 dashboard model can be accepted by the
researchers.
ii. Satisfaction of the researchers towards item
menu of researcher performance (M1) in the dashboard model
All the researchers agreed that the dashboard components (DC1a, DC1b and DC1c) in the item menu of researcher performance (M1) meet the researchers’ needs to measure their research performance based on publications (P1).
For the questions that were used to measure if the item menu of researcher performance (M1) provides sufficient information for the purpose of measuring research performance based on publications (P1), only one researcher agreed that it provide sufficient information.
Some of the researchers’ feedbacks on the enhancement of this dashboard components are:
a. “Should include h-index” –
Researcher 1, Researcher 2,
Researcher 3, Researcher 4,
Researcher 5 and Researcher 6
The h-index is a measurement for the purpose of describing the productivity and impact of the researcher. The h-index is determined using two pieces of information, which are the total number of publication papers (Np) and the number of citations (Nc) for each paper. The researchers can identify their own h-index, where Np = Nc. For example, the researcher with h-index of five means the researcher has five publication papers with at least five citations in each of the publication papers. The h-index can remove bias for a highly cited publication paper or total number of publication papers.
The suggestion regarding h-index can be considered to be included in the item menu of researcher performance (M1). The importance of h-index can be seen based on the statement from one of the researchers who stated:
publications with low impact and those publications are not considered as great achievements. On the other hand, some researchers have less number of publications with very high impact.” – Researcher 5
b. “Should include a graph to view
publication published by year” – Researcher 6
The researcher suggested this
dashboard component because it would enable the researchers to monitor their published paper by year. This dashboard component can be considered to be included in the item menu of researcher performance (M1).
iii. Satisfaction of the researchers towards item
menu of research trends (M2) in the dashboard model
All researchers agreed that the dashboard components (DC2) in the item menu of research trends (M2) meet their needs to monitor research trends (P2).
For the questions that were used to measure if the item menu of research trends (M2) provides sufficient information for the purpose of monitoring research trends (P2), five out of seven researchers agreed that it provided sufficient information.
The researchers’ feedbacks on the
enhancement of this dashboard component is:
a. “Should differentiate statistics of
publication category between journal articles and conference papers based on research domain” – Researcher 4 and Researcher 6
This suggestion of dashboard
component can be considered to be included in the item menu of research trends (M2) as it can assist the researchers know the category of publications that have published in the research domain [33].
ISSN: 1992-8645 www.jatit.org E-ISSN: 1817-3195 research events alert (M3) meet their needs
to be alert of upcoming events (P3).
For the questions that were used to measure if the item menu of research events alert (M3) provide sufficient information for the purpose of alerting on upcoming events (P3), four out of seven researchers agreed that it provided sufficient information.
Some of the researchers’ feedbacks on the enhancement of this dashboard components are:
a. “Should include job posting
advertisement” – Researcher 1
b. “Should include grants application
advertisement” – Researcher 2
c. “Should include workshop
advertisement” – Researcher 4
However, these suggestions could not be considered to be included in the dashboard components because the item menu of research events alert (M3) would only alert the researchers of upcoming conference and journal publication platforms that are related to their domain.
ISSN: 1992-8645 www.jatit.org E-ISSN: 1817-3195
Figure 6: Modified Dashboard Model For Researchers In Social Research Network Sites
ISSN: 1992-8645 www.jatit.org E-ISSN: 1817-3195 journal articles and conference papers based on the
research domain. Therefore, the dashboard model can be used as a guideline for the developers to develop the dashboard for the researchers in the SRNS. By including the dashboard into the SRNS, it could provide awareness support for researchers to notice latest information in their research domain, be alert for events on a specific topic and can be used to monitor their research performance.
REFRENCES:
[1] A. Gruzd, K. Staves, and A. Wilk, "Connected scholars: Examining the role of social media in research practices of faculty using the UTAUT
model," Computers in Human Behavior, Vol.
28, 2012, pp. 2340-2350.
[2] A. Cann, K. Dimitriou, and T. Hooley, Social media: A guide for researchers. London: Research Information Network, 2011.
[3] W. Reinhardt, C. Mletzko, H. Drachsler, and P.B. Sloep, "Design and evaluation of a widget-based dashboard for awareness support in
Research Networks," Interactive Learning
Environments, Vol. 22, 2014, pp. 594-613.
[4] I. Rowlands, D. Nicholas, B. Russell, N. Canty, and A. Watkinson, "Social media use in the
research workflow," Learned Publishing, Vol.
24, 2011, pp. 183-195.
[5] E. Collins and B. Hide, "Use and relevance of Web 2.0 resources for researchers," in
Publishing in the Networked World:
Transforming the Nature of Communication 14th International Conference on Electronic
Publishing, Helsinki, Finland, 2010, pp.
271-289.
[6] J. Tang, D. Zhang, and L. Yao, "Social network extraction of academic researchers," in Seventh IEEE International Conference on Data Mining
(ICDM), 2007, pp. 292-301.
[7] A.C. Bullinger, S.H. Hallerstede, U. Renken, J.-H. Soeldner, and K.M. Moeslein, "Towards research collaboration – a taxonomy of Social
Research Network Sites," in Proceedings of the
Sixteenth Americas Conference on Information
Systems (AMCIS), Lima, Peru, 2010, pp. 1-9.
[8] M. Nentwich and R. König, "Academia goes Facebook? The potential of social network sites
in the scholarly realm," in Opening Science, ed:
Springer International Publishing, 2014, pp.
107-124.
[9] W. Reinhardt, P. Kadam, T. Varlemann, J. Surve, M.I. Ahmad, and J. Magenheim,
"Supporting scholarly awareness and
researchers’ social interactions using
PUSHPIN," in Proceedings of the 2nd
workshop on awareness and reflection in
technology-enhanced learning, CEUR
Workshop Proceedings, 2012, pp. 31-46.
[10] E. Giglia, "Academic social networks: It’s time
to change the way we do research," European
Journal of Physical and Rehabilitation
Medicine, Vol. 47, 2011, pp. 345-349.
[11] N. Li and D. Gillet, "Identifying influential scholars in academic social media platforms," in
Proceedings of the 2013 IEEE/ACM
International Conference on Advances in Social
Networks Analysis and Mining (ASONAM),
2013, pp. 608-614.
[12] S. Masud, M. Afrin, F.M. Choudhury, and S.I. Ahmed, "VizResearch: Linking the knowledge of people and the people with knowledge,"
Procedia Computer Science, Vol. 9, 2012, pp.
1416-1425.
[13] W. Reinhardt, C. Mletzko, P.B. Sloep, and H. Drachsler, "Understanding the meaning of
awareness in Research Networks," in
Proceedings of the 2nd Workshop on Awareness and Reflection in Technology Enhanced
Learning, Saarbrücken, Germany, 2012, pp.
13-30.
[14] W. Reinhardt and C. Mletzko, "Awareness in
learning networks," in Proceedings of the PLE
Conference 2011, Southampton, UK, 2011, pp.
12-20.
[15] L. Lövstrand, "Being selectively aware with the
khronika system," in Proceedings of the Second
European Conference on Computer-Supported
Cooperative Work, Amsterdam, The
Netherlands, 1991, pp. 265-277.
[16] T. Gross, C. Stary, and A. Totter, "User-centered awareness in computer-supported
cooperative work-systems: structured
embedding of findings from social sciences," International Journal of Human-Computer
Interaction, Vol. 18, 2005, pp. 323-360.
[17] S. Few, Information dashboard design: O'Reilly, 2006.
[18] R. Bose, "Understanding management data
systems for enterprise performance
management," Industrial Management & Data
ISSN: 1992-8645 www.jatit.org E-ISSN: 1817-3195
[19] D. Orts, Dashboard development and
deployment: A methodology for success. Washington: Noetix Corporation, 2004.
[20] V.A. Rohani and S. . Ow, "Eliciting essential requirements for social networks in academic
environments," in 2011 IEEE Symposium on
Computers & Informatics (ISCI), Kuala
Lumpur, 2011, pp. 171-176.
[21] N. Chakraborty, "Activities and reasons for using social networking sites by research
scholars in NEHU: A study on Facebook and
ResearchGate," in 8th Convention
PLANNER-2012, Gangtok, PLANNER-2012, pp. 19-27.
[22] J. Tang, J. Zhang, L. Yao, J. Li, L. Zhang, and Z. Su, "Arnetminer: Extraction and mining of
academic social networks," in Proceedings of
the 14th ACM SIGKDD international
conference on knowledge discovery and data
mining, 2008, pp. 990-998.
[23] O.I. Lindland, "A prototyping approach to validation of conceptual models in information systems engineering," Ph.D. Thesis, The Nowegian Institute of Technology (NTH), Trondheim, Norway, 1993.
[24] W.J. Doll and G. Torkzadeh, "The measurement
of end-user computing satisfaction," MIS
quarterly, Vol. 12, 1988, pp. 259-274.
[25] N. Day, "Achieving user satisfaction in content
management systems," Master Thesis,
Lancaster University, United Kingdom, 2007. [26] L. Xiao and S. Dasgupta, "Measurement of user
satisfaction with web-based information
systems: An empirical study," in AMCIS 2002
Proceedings, 2002, pp. 1149-1155.
[27] J.W. Creswell, Educational research: Planning, conducting, and evaluating quantitative and qualitative research (4th ed.). United States of America: Pearson Education, Inc., 2012. [28] T. Keinonen. (n.d.). Theory of a design goal:
Usability of interactive products. Available: http://www.uiah.fi/projects/metodi/158.htm [29] H. Zainal and A. R. C. Hussin, "A model for
measuring Web OPAC end user satisfaction," Journal of Information Systems Research and
Innovation, 2013, pp. 98-107.
[30] W.-T. Wang, B. Wang, and Y.-T. Wei, "Examining the impacts of website complexities on user satisfaction based on the task-technology fit model: An experimental research
[31] A. Abrizah, F. Badawi, N. Zoohorian-Fooladi, D. Nicholas, H.R. Jamali, and A.K. Norliya, "What scholarly channels and resources do authors trust to read, cite and publish in? A
Malaysian study," in ICOLIS 2014, Kuala
Lumpur, 2014, pp. 245-262.
[32] U. o. C. Department of Materials Science & Metallurgy. (n.d.). Eligibility criteria for early-stage researchers and experienced researchers
(for EC awards). Available: