Application of Object Oriented Metrics to Java and C
Sharp: Comparative Study
Arti Chhikara
Maharaja Agrasen College,Delhi,India
Priyavart Sangwan
HCL Technologies,Noida,India
ABSTRACT
This research paperpresents the comparative study of various object oriented software metrics and their application on C Sharp and Java language. A set of eleven well established object-oriented metrics are applied on twenty C Sharp and Java programs to measure and compare the important features such as complexity, testability and maintainability of both languages. This analysis shows that C# is a modern and powerful language which is fully object-oriented as compared to Java. The primary objective of this study is to investigate the applicability of Object–Oriented software metrics to measure the complexity of a Java and C Sharp software applications.
Keywords
C Sharp, Java, Object-Oriented SoftwareDevelopment, Software Metric.
1. INTRODUCTION
The design and development of software using object oriented paradigm is gaining popularity day by day. Object Oriented Analysis and Design of software provide many benefits to both the program designer and the user. Object Orientation contributes to the solution of many problems associated with the development and quality of software product. This technology promises greater programmer productivity, better quality of software and lesser maintenance cost [4][7]. Object oriented software development requires an approach different from more traditional functional decomposition and data flow development methods. While the functional and data flow approaches commence by considering the systems behavior and/or data separately, object oriented analysis approaches the problem by looking for system entities that combine them. Object oriented analysis and design focus on objects as the primary agents involved in a computation; each class of data and related operations are collected into a single system entity[2][5].
There are several object oriented programming languages that support object oriented paradigm. Most commonly used are Java, C++, C sharp, and Vb.net. C sharp is Microsoft’s new programming language for .net platform. It combines some of the best features of modern programming languages such as Java, C++ or Visual Basic [5]. Java is an object oriented language which is highly suited for modeling the real world and solving the real world problems[6]. In this research paper different Java and C sharp programs are studied. We have applied the different object oriented metrics on the same set of 20 programs in C Sharp and JAVA each. Then, we have calculated the statistical values like mean, median, standard deviation, etc., for the values obtained. After that, we have compared the results for both languages. Based on the
empirical quantitative analysis, we have compared the object-orientation of the two languages C Sharp and JAVA.
2. LITERATURE RESEARCH
2.1 Metrics Relevant for this Study
One of the most widely referenced sets of object-oriented software metrics has been proposed by Chidamber and Kemerer [1][3]. At the 1991 Object Oriented Programming Systems, Languages and Applications conference (OOPSLA), Shyam Chidamber and Chris Kemerer presented a paper [1] outlining six metrics for use with object-oriented programming languages. The metrics used in this study are given below:
1. Weighted method per class
2. Depth of Inheritance Tree
3. Number of child
4. Response for a class
5. Message passing coupling
6. Data abstraction coupling
7. Number of local subunits.
8. Inheritance Dependencies
9. Factoring Effectiveness 10. Reuse Ratio
11. Specialization Index
3. RESULT ANALYSIS
3.1 Statistical Data Analysis
[image:2.595.53.547.137.441.2]Table 2 shows the statistical values calculated for the metric values obtained for C Sharp programs. Table 4 shows the statistical values calculated for the metric values obtained for JAVA programs.
Table 1: Metric Values Calculated for C Sharp Programs
Table2: Statistical Values Calculated for C Sharp Programs
Metric Type Minimum Maximum Mean Median Stand. Deviation
WMC 1.00 3.33 1.98
2.00
0.58
RFC 1.00 4.33 2.57
2.75
1.00
DIT 0.33 2.00 1.08
1.00
0.59
NOC 0.50 1.50 0.75
0.58
0.29
MPC 0.00 1.00 0.24
0.20
0.30
DAC 0.00 0.67 0.29
0.32
0.19
NUS 1.00 2.50 1.65
1.66
0.42
ID 0.20 2.00 0.97
1.00
0.66
FE 0.30 1.50 0.55
0.50
0.28
SI 1.00 3.00 1.89
2.00
0.87
RR 0.25 1.00 0.43
0.50
0.17
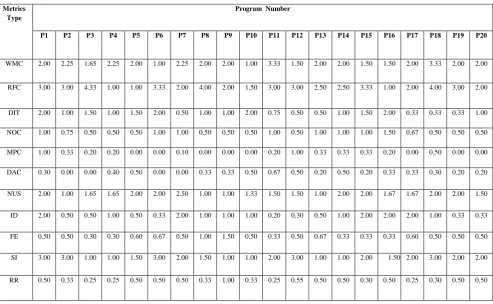
Metrics Type
Program Number
P1 P2 P3 P4 P5 P6 P7 P8 P9 P10 P11 P12 P13 P14 P15 P16 P17 P18 P19 P20
WMC 2.00 2.25 1.65 2.25 2.00 1.00 2.25 2.00 2.00 1.00 3.33 1.50 2.00 2.00 1.50 1.50 2.00 3.33 2.00 2.00
RFC 3.00 3.00 4.33 1.00 1.00 3.33 2.00 4.00 2.00 1.50 3.00 3.00 2.50 2.50 3.33 1.00 2.00 4.00 3.00 2.00
DIT 2.00 1.00 1.50 1.00 1.50 2.00 0.50 1.00 1.00 2.00 0.75 0.50 0.50 1.00 1.50 2.00 0.33 0.33 0.33 1.00
NOC 1.00 0.75 0.50 0.50 0.50 1.00 1.00 0.50 0.50 0.50 1.00 0.50 1.00 1.00 1.00 1.50 0.67 0.50 0.50 0.50
MPC 1.00 0.33 0.20 0.20 0.00 0.00 0.10 0.00 0.00 0.00 0.20 1.00 0.33 0.33 0.33 0.20 0.00 0.50 0.00 0.00
DAC 0.30 0.00 0.00 0.40 0.50 0.00 0.00 0.33 0.33 0.50 0.67 0.50 0.20 0.50 0.20 0.33 0.33 0.30 0.20 0.20
NUS 2.00 1.00 1.65 1.65 2.00 2.00 2.50 1.00 1.00 1.33 1.50 1.50 1.00 2.00 2.00 1.67 1.67 2.00 2.00 1.50
ID 2.00 0.50 0.50 1.00 0.50 0.33 2.00 1.00 1.00 1.00 0.20 0.30 0.50 1.00 2.00 2.00 2.00 1.00 0.33 0.33
FE 0.50 0.50 0.30 0.30 0.60 0.67 0.50 1.00 1.50 0.50 0.33 0.50 0.67 0.33 0.33 0.33 0.60 0.50 0.50 0.50
SI 3.00 3.00 1.00 1.00 1.50 3.00 2.00 1.50 1.00 1.00 2.00 3.00 1.00 1.00 2.00
2.00 1.50 2.00 3.00 2.00 2.00
Table 3: Metric Values Calculated for JAVA Programs
Metric s Type
Program Number
P1 P2 P3 P4 P5 P6 P7 P8 P9 P1 0 P1 1 P1 2 P1 3 P1 4 P1 5 P1 6 P1 7 P1 8 P1 9 P2 0
WMC 3.0 0 2.2 5 1.6 5 2.0 0 2.0 0 1.2 5 2.2 5 2.0 0 2.0 0 1.6 5 3.3 3 1.5 0 2.0 0 2.0 0 1.0 0 1.6 7 2.0 0 3.3 3 2.0 0 2.0 0
RFC 2.0 0 3.0 0 3.3 3 2.0 0 3.3 3 3.3 3 2.6 7 3.0 0 4.4 8 1.5 0 3.0 0 3.3 3 2.5 0 2.0 0 3.3 3 3.3 3 2.0 0 4.1 0 3.0 0 2.0 0
DIT 2.0 0 1.0 0 1.0 0 1.0 0 0.5 0 2.0 0 0.5 0 0.3 3 1.0 0 1.0 0 0.7 5 0.5 0 0.5 0 1.0 0 1.0 0 2.2 5 0.3 3 0.3 3 0.5 0 0.5 0
NOC 2.0 0 0.7 5 0.5 0 1.0 0 0.5 0 1.5 0 0.5 0 0.5 0 0.5 0 0.6 5 0.6 5 1.0 0 1.0 0 1.0 0 0.7 5 1.7 5 0.6 7 0.5 0 0.5 0 0.5 0
MPC 2.0 0 0.3 3 0.2 0 0.3 3 0.0 0 0.0 0 0.2 0 0.0 0 0.0 0 0.0 0 0.5 0 0.5 0 0.3 3 0.3 3 0.3 3 0.0 0 0.0 0 0.3 3 0.0 0 0.0 0
DAC 0.3 0 0.0 0 0.0 0 0.4 0 0.6 7 0.0 0 0.0 0 0.0 0 0.3 3 0.5 0 0.6 7 0.5 0 0.5 0 0.6 7 0.0 0 0.3 3 0.3 3 0.3 0 0.3 0 0.4 0
NUS 3.0 0 2.0 0 1.6 5 1.6 5 2.0 0 2.0 0 2.0 0 1.6 7 1.6 7 1.3 3 1.5 0 1.5 0 1.5 0 2.5 0 2.0 0 1.6 7 1.6 7 2.5 0 2.0 0 2.0 0
ID 2.0
0 1.0 0 0.5 0 0.5 0 1.0 0 0.3 3 2.0 0 1.0 0 1.0 0 1.0 0 0.5 0 0.5 0 1.0 0 1.0 0 2.0 0 2.2 5 2.0 0 0.5 0 0.5 0 0.3 3
FE 0.5
0 0.5 0 0.3 0 0.3 0 0.5 0 0.6 7 0.6 7 0.6 7 1.2 5 0.5 0 0.3 3 0.6 7 0.6 7 0.3 3 0.3 3 0.3 3 0.5 0 0.6 7 0.5 0 0.5 0
SI 2.0
0 2.0 0 1.0 0 1.0 0 1.0 0 3.0 0 2.0 0 2.0 0 1.0 0 1.0 0 2.0 0 3.0 0 1.0 0 1.0 0 1.0 0
2.00 2.00 2.0
0 3.0 0 2.0 0 2.0 0
RR 0.2
5 0.3 3 0.2 5 0.2 5 0.5 0 0.5 0 0.3 3 0.3 3 0.3 0 0.3 3 0.2 5 0.7 5 0.5 0 0.5 0 0.3 0 0.2 5 0.2 5 0.3 0 0.5 0 0.3 0
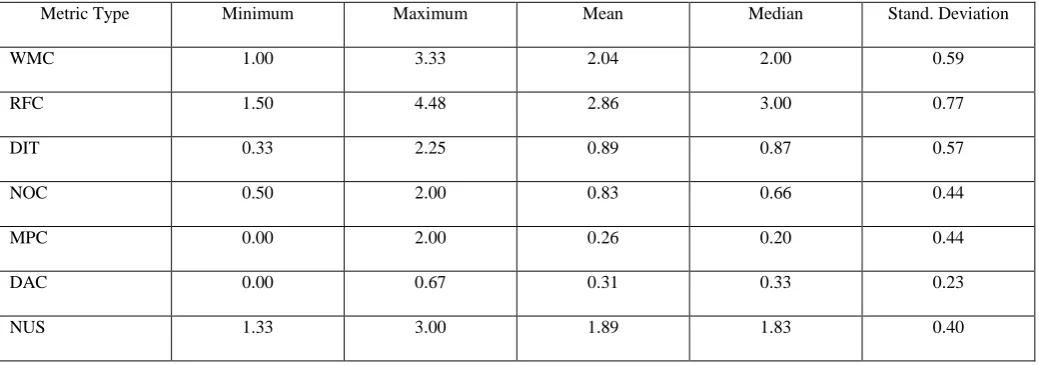
Table4: Statistical Values Calculated for JAVA Programs
Metric Type Minimum Maximum Mean Median Stand. Deviation
WMC 1.00 3.33 2.04 2.00 0.59
RFC 1.50 4.48 2.86 3.00 0.77
DIT 0.33 2.25 0.89 0.87 0.57
NOC 0.50 2.00 0.83 0.66 0.44
MPC 0.00 2.00 0.26 0.20 0.44
DAC 0.00 0.67 0.31 0.33 0.23
ID 0.33 2.25 1.04 1.00 0.64
FE 0.30 1.25 0.53 0.50 0.21
SI 1.00 3.00 1.75 2.00 0.71
RR 0.25 0.75 0.36 0.31 0.13
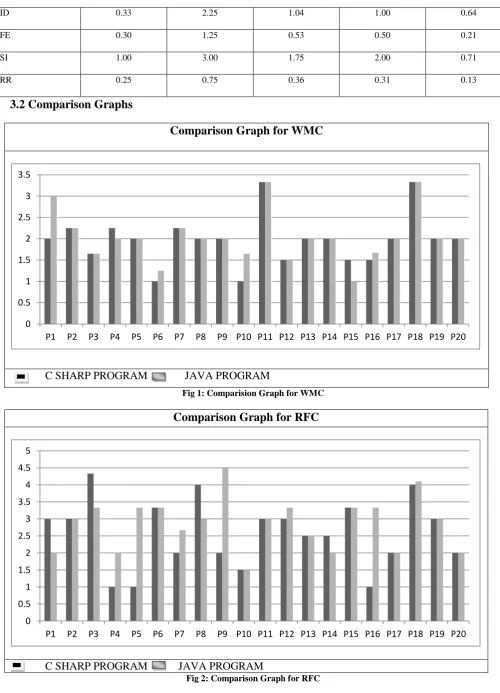
3.2 Comparison Graphs
Comparison Graph for WMC
[image:4.595.44.545.65.759.2]C SHARP PROGRAM
JAVA PROGRAM
Fig 1: Comparision Graph for WMC
Comparison Graph for RFC
C SHARP PROGRAM JAVA PROGRAM
Fig 2: Comparison Graph for RFC
0 0.5 1 1.5 2 2.5 3 3.5
P1 P2 P3 P4 P5 P6 P7 P8 P9 P10 P11 P12 P13 P14 P15 P16 P17 P18 P19 P20
0 0.5 1 1.5 2 2.5 3 3.5 4 4.5 5
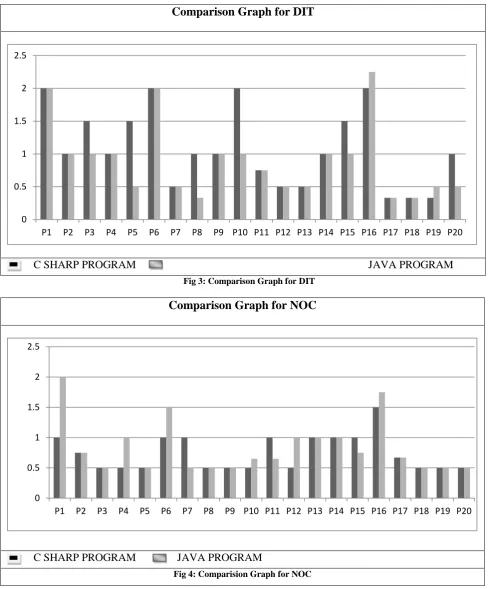
Comparison Graph for DIT
[image:5.595.48.537.68.658.2]C SHARP PROGRAM
JAVA PROGRAM
Fig 3: Comparison Graph for DIT
Comparison Graph for NOC
C SHARP PROGRAM JAVA PROGRAM
Fig 4: Comparision Graph for NOC
0 0.5 1 1.5 2 2.5
P1 P2 P3 P4 P5 P6 P7 P8 P9 P10 P11 P12 P13 P14 P15 P16 P17 P18 P19 P20
0 0.5 1 1.5 2 2.5
Comparison Graph for MPC
C SHARP PROGRAM JAVA PROGRAM
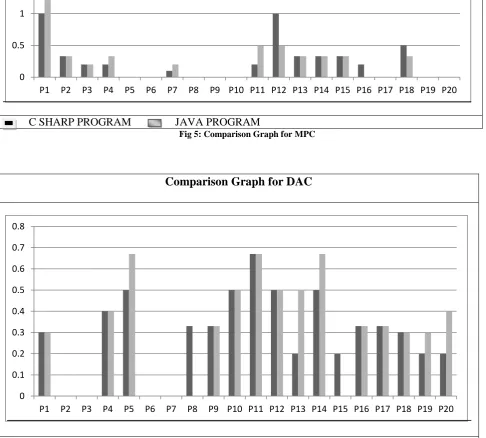
Fig 5: Comparison Graph for MPC
Comparison Graph for DAC
[image:6.595.50.537.179.617.2]C SHARP PROGRAM JAVA PROGRAM
Fig 6: Comparison Graph for DAC
0 0.5 1 1.5 2 2.5
P1 P2 P3 P4 P5 P6 P7 P8 P9 P10 P11 P12 P13 P14 P15 P16 P17 P18 P19 P20
0 0.1 0.2 0.3 0.4 0.5 0.6 0.7 0.8
Comparison Graph for NUS
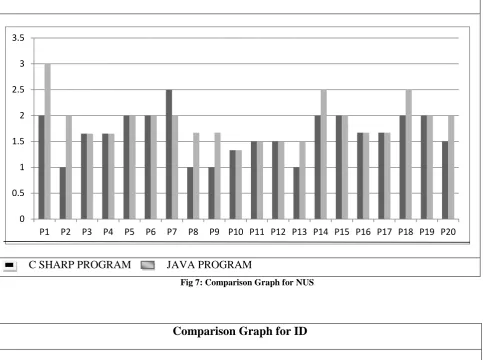
[image:7.595.50.534.88.448.2]C SHARP PROGRAM JAVA PROGRAM
Fig 7: Comparison Graph for NUS
Comparison Graph for ID
[image:7.595.48.536.392.699.2]C SHARP PROGRAM JAVA PROGRAM
Fig 8: Comparison Graph for ID
0 0.5 1 1.5 2 2.5 3 3.5
P1 P2 P3 P4 P5 P6 P7 P8 P9 P10 P11 P12 P13 P14 P15 P16 P17 P18 P19 P20
0 0.5 1 1.5 2 2.5
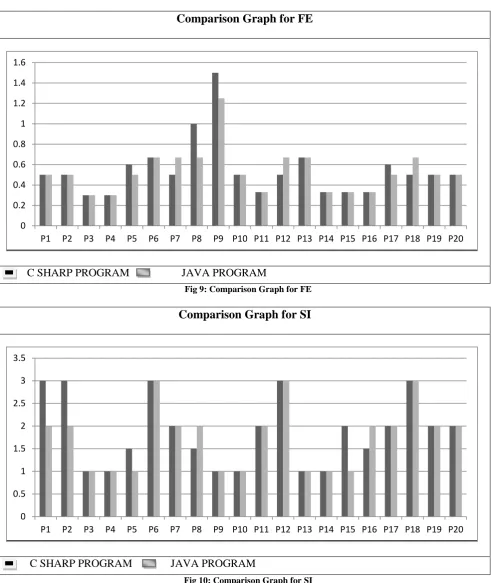
Fig 9: Comparison Graph for FE
Fig 10: Comparison Graph for SI
Comparison Graph for FE
C SHARP PROGRAM JAVA PROGRAM
Comparison Graph for SI
C SHARP PROGRAM JAVA PROGRAM
0 0.2 0.4 0.6 0.8 1 1.2 1.4 1.6
P1 P2 P3 P4 P5 P6 P7 P8 P9 P10 P11 P12 P13 P14 P15 P16 P17 P18 P19 P20
0 0.5 1 1.5 2 2.5 3 3.5
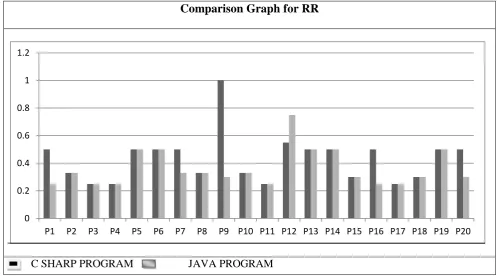
Fig 11: Comparison Graph for RR
4 Comparative
Study of the Obtained
Results
1. Weighted Method per Class metric predicts time and effort that is required to build and maintain a class. A high value of WMC has been found to lead to more faults. Classes with large number of methods are likely to be more application specific, limiting the possibility of reuse. The mean values of these metrics are greater in Java than C Sharp as shown in figure 1. This implies that C Sharp programs are simpler and less complex.
2 The RFC metric is the count of the set of all methods that can be invoked in response to a message to an object of the class or by some methods in the class. This includes all methods accessible within the class hierarchy. This metric looks at the combination of the complexity of a class through the number of methods and the amount of communication with other classes. The larger the number of methods that can be invoked from a class through messages, the greater the complexity of the class. From our study we found that C Sharp programs are less complex as the mean value of this metric is low as relevant from table 2 and 4.
3 The depth of a class within the inheritance hierarchy is the maximum number of steps from the class node to the root of the tree and is measured by the number of ancestor classes. The deeper a class is in the hierarchy, the more methods it is likely to inherit, making it more complex. Deeper trees constitute greater design complexity, since more methods and classes are involved, but at the same time reusability also increases due to inheritance. The values of DIT are greater in C Sharp than Java which implies the depth of classes is more in C Sharp.
4 The number of children is the number of immediate subclasses subordinate to a class in the hierarchy. It is an indicator of the potential influence a class can have on the design and on the system. The greater the number of children, the greater the likelihood of improper abstraction of the parent and may be a case of misuse of subclassing. However, high NOC indicates high reuse, since inheritance is a form of reuse. A class with many children may also require more testing. High NOC has been found to indicate fewer faults. This may be due to high reuse, which is desired. But NOC values are greater for C Sharp programs, which implies C Sharp classes have more children (breadth).But depth is more important than breadth to reuse components. Thus C Sharp programs and classes are more reusable than Java. The comparative values of NOC are shown in Figures 4.
5 Message passing coupling metric measures the numbers of messages passing among objects of the class. A larger number indicates increased coupling between this class and other classes in the system. This makes the classes more dependent on each other which increases the overall complexity of the system and makes the class more difficult to change. The assumption behind this metric is that classes interacting with many other classes are harder to understand and maintain. When we applied object oriented metrics on several java and c sharp programs, we observed that the mean value of Message Passing Coupling (MPC) metric is low for C Sharp programs than Java programs.
6 Data Abstraction Coupling metric measures the coupling complexity caused by Abstract Data Types (ADTs). This metric is concerned with the coupling between classes representing a major aspect of the object oriented design, since the reuse degree, the maintenance and testing effort for a class are decisively influenced by the coupling level between classes. It is the count of total number of external classes the
Comparison Graph for RR
C SHARP PROGRAM JAVA PROGRAM
0 0.2 0.4 0.6 0.8 1 1.2
increasing DAC. The value of this metric is low for C Sharp than Java programs.
7 The Number of Subunit metric is the total number of functions and procedures defined for the class. As the number of functions and procedures grows, the class becomes more fault prone. The complexity also increases with increases value of local subunits metric. The value of this metric is found to be low for C Sharp programs.
8 Inheritance Dependencies metric is intended to reflect characteristics of the inheritance tree. Morris suggests that “it may be possible to determine a range of values within which the inheritance tree depth should be maintained. Inheritance tree depth is likely to be more favorable than breadth in terms of reusability via inheritance. However, A deeper tree is more difficult to test than a broader one. The greater the value of this metric, more will be the complexity of programs. Comprehensibility may diminish with a large number of inheritance layers. The mean value of this metric is higher for Java programs as shown in figure 8.
9 Morris states that “inheritance hierarchies are optimized via a process called factoring. The purpose of factoring is to minimize the number of locations within an inheritance hierarchy in which a particular method is implemented”. Highly factored applications are more reliable for reasons similar to those that argue that such applications are more maintainable. The smaller the number of implementation locations for the average task, the less likely that errors were made during coding. The more highly factored an inheritance hierarchy is the greatest degree to which method reuse occurs. The more highly factored an application is, the smaller the number of implementation locations for the average method. The mean value of this metric is higher for C Sharp as compared to Java.
10 The reusability metrics Reuse Ratio (RR) and Specialization Ratio (SR) values also are more for C Sharp programs than JAVA programs (Figures 10 and 11). That means, again C Sharp classes are more reusable.
5 CONCLUSIONS AND FUTURE WORK
The results obtained from the comparative study of Java and C sharp programs show that C sharp is a better object oriented language than Java. The properties of object-oriented programming languages like inheritance, polymorphism, encapsulation, coupling, cohesion, reusability, etc., are much better for C Sharp programs than for Java programs we have taken. Hence it makes C sharp more suitable to object oriented environment.
However, the metrics presented in this paper are by no means a complete set of object oriented metrics. But this analysis can be used as a reference by software developers and managers for building a fault free, reliable and easy to maintain software product.
5. REFERENCES
[1] Chidamber S., and Kemerer C. (1991), “Towards a Metrics Suite for Object Oriented Design,’’ Object Oriented Programming Systems, Languages and Applications (OOPSLA), Vol 10, pp 197-211.\
[2] Chidamber S., and Kemerer C. (1994),” A Metrics Suite for Object Oriented Design”, IEEE Transactions on Software Engineering, vol. 20, no. 6, pp. 476-493.
[3] Chidamber S., Darcy, D. and Kemerer C. (1998), “Managerial use of Metrics for Object Oriented Software”: an Exploratory Analysis, IEEE Transaction on Software Engineering, vol. 24, no. 8, pp. 629-639.
[4] Conte S.D., Sunsmore H.E, and Shen V.Y.,(2003) Software Engineering Metrics and Models, Benjamin/Cummings Publications, Menlo Park, California.
[5] Jain V.K (2001), “The Complete Guide to C# programming”, First Edition.
[6] Schildt H.,(2006), “Java: The Complete Reference”, 6th
Edition, McGraw Hill Publication, ISBN: 0072263857, 9780072263855.