Physiological and Ionic Expressions of Different Hybrids
of Maize (Zea Mays L.) under Different Salinity Levels
Sajid Hussain
1,*, Muhammad Anwar-ul-Haq
1, Zeeshan Akram
1,
Muhammad Afzal
2, Imran Shabbir
2,
Shahbaz Hussain
31Institute of Soil & Environ. Sciences, University of Agriculture, Faisalabad-38040, Pakistan 2Department of Agronomy, University of Agriculture, Faisalabad-38040, Pakistan 3Department of Soil Science, College of Agriculture, UOS, Sargodha-40100, Pakistan
*Corresponding Author: [email protected]
Copyright © 2014 Horizon Research Publishing All rights reserved.
Abstract
A pot culture experiment was conducted to estimate the behavior of maize under saline soil conditions in the wire house of Institute of Soil and Environmental Sciences, University of Agriculture Faisalabad. There were three treatments with different levels of salinity and equal amount of Ammonium Nitrate (NH4NO3) in all pots including control was applied to three genotypes of Hybrid Maize i.e. 32F10 (Poineer), King Cross (Auriga), and NK-8441 (Syngenta), in five replications. Treatments were applied according to Completely Randomized Design (CRD). Plant and soil samples were collected for determination of different physiological and ionic expressions. Genotype NK-8441 comparatively performed better at all salinity levels. All studied physiological parameters viz. relative water contents, membrane stability index, total chlorophyll contents, CO2 assimilation, stomatal conductance, transpiration rate and photosynthetic rate showed a declining trend at higher salinity level, remarkably. However a very small decline was observed in NK-8441 compared with other genotypes. Due to salinity stress plant uptake of K+, NO3-, and N from soil was reduced and Na+ uptake was increasedsignificantly as the salinity level was increased. NK-8441 showed its worth by up taking more K+, NO3- and N and discouraging Na+ uptake.
Keywords
Salinity, Maize, Physio-Chemical, NO3- , K+ and Na+ Uptake1. Introduction
Maize (Zea mays L.) is a vital cereal crop for human as well as for animal utilization and is grown under different conditions in various parts of the world. In Pakistan, maize is the 3rd most valuable cereal after wheat and rice. Its grain has high nutrient value and oil is exploited for cooking purposes while green feed is quite rich in protein [11]. Area under maize crop is 1085 000 ha and production of maize for the
year 2012-13 is 4631 000 tones [16]. In view of its increasing importance betterment in agronomical aspects of maize has received big attention in Pakistan especially in saline soil conditions.
Salinity is one of the major constraints of agriculture in the arid and semiarid region. The salt-affected area of Pakistan is 6.67 million hectares [24]. Pakistan falls under arid and semiarid regions where evapotranspiration greatly exceeds precipitation and salts tend to accumulate in upper soil surface. The use of inadequate drainage, saline water and low soil permeability condition contributes to soil salinity. There are various detrimental effects of salt stress in crop plants, responsible for severe decreases in the growth and yield of plants. Osmotic stress (drought problem), ion imbalance, particularly with Ca+2, K+ and the direct toxic effects of ions on the metabolic process are the most important and widely studied physiological impairments caused by salt stress [29, 42].
Salt stress, like many abiotic stress factors, also induces oxidative damage to plant cells catalyzed by reactive oxygen species [8]. Excessive buildup of Na+ and Cl-damages root
membrane and causes ionic imbalances that may discourage potassium uptake by plants [17] Na+and Cl-concentration in
different plant parts, tissues, cells and cell organelles increases by increasing salinity [25] N fertilization not only promotes plant growth it may also lessen the effects of salt on plants [13]. Plants take up nitrogen mainly as NO-3 and NH+4 form. When both are present in solution then NH+4 is preferred. Under salinity nitrate consumption is slowed down and salinity reduces NO-3 absorption with the possible consequence of N insufficient in the plant [31].
salt tolerance behavior of maize genotypes and role of nitrogenous fertilizer in enhancing the salt tolerance.
2. Materials and Methods
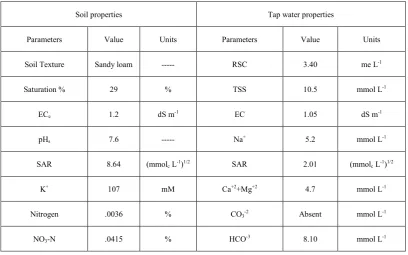
[image:2.595.101.510.487.742.2]A pot experiment was conducted in the wire house, Institute of Soil and Environmental Sciences, University of Agriculture Faisalabad to estimate the behavior of maize (Zea mays L.) genotypes in saline soil conditions. Three genotypes of maize (Zea mays L.) 32F10 (Poineer), King Cross (Auriga), and NK-8441 (Syngenta) were tested against three levels of salinity viz. (1) Control (1.2 dS m-1) (2) ECe 4 dS m-1 (3) ECe 8 dS m-1. These saline treatments were selected keeping in view the tolerance and yield potential of the crop. Initially soil samples were collected from research area of University of Agriculture Faisalabad, after then soil was sieved and analyzed to develop salinity with addition of NaCl salt. Salinity was developed artificially in the pots using calculated amount of NaCl salt [24]. Properties of the soil and tap water used for irrigating the pots are as under in Table 1.
The experiment was replicated five times with completely randomized design (CRD). Leaf samples were taken after two months for determining membrane stability index (MSI) and relative water contents (RWC). Chlorophyll contents of each plant were determined with chlorophyll meter. Different parameters like CO2 assimilation, stomatal conductance, transpiration rate and photosynthetic rate were recorded by Infra Red Gas analyzer (IRGA). Leaf samples were taken again for extraction of leaf sap. Sodium (Na+)
and Potassium (K+) was calculated from the leaf sap. Plants were harvested after three months and separated into shoots
and roots. Soil samples after harvesting the crop were taken and analyzed for sodium (Na+) and potassium (K+) by Flame Photometer, nitrate (NO3) by Spectrophotometer and total nitrogen by Kjaldahl method. The collected data were statistically analyzed by using the Fisher's analysis of variance technique and differences among treatment means were compared by using least significant difference (LSD) test at 5 % probability level with the help of statistical package MSTAT-C version 1.3 [38].
3. Results and Discussions
Salinity adversely affected the physiological and ionic characteristicsof maize, when exposed to salinity level of 4 dS m-1 and 8 dS m-1.
Effect on salinity on physiological and ionic parameters of Maize: Maize genotype NK-8441 showed better physio-chemical attributes at all salinity levels. Salinity effect on physiological parameters is discussed below:-
Relative Water Contents (RWC): The data presented in the table 2 showed thatat all salinity levels control (1.2 dS m-1), 4 dS m-1 and 8 dS m-1 EC
e the maximum and the
minimum relative water contents were calculated in NK-8441 and King Cross, respectively. Relative water contents decreased significantly with increased in salinity. At all ECe levels, the maximum and the minimum relative
water contents recorded in the order NK-8441 > 32F10 > King Cross. The results were supported by [19] drought and salinity affected the dry weight content in a different way, resulting from the reduction in the relative water content. [10] also concluded that salinity reduces leaf relative water contents in maize (Zea mays L.).
Table 1. Properties of soil and tap water used in the experiment
Soil properties Tap water properties
Parameters Value Units Parameters Value Units
Soil Texture Sandy loam --- RSC 3.40 me L-1
Saturation % 29 % TSS 10.5 mmol L-1
ECe 1.2 dS m-1 EC 1.05 dS m-1
pHs 7.6 --- Na+ 5.2 mmol L-1
SAR 8.64 (mmolc L-1)1/2 SAR 2.01 (mmolc L-1)1/2
K+ 107 mM Ca+2+Mg+2 4.7 mmol L-1
Nitrogen .0036 % CO3-2 Absent mmol L-1
Table 2. Effect of salinity on physiological parameters of maize
Treatments RWC MSI TCC Ci A E Gs
(Control) 59.46a 48.13a 27.86a 385.26a 14.74a 4.98a 0.065a
(4 dS m-1) 48.06b 42.06b 24.80b 245.73b 9.03b 3.09b 0.046b
(8 dS m-1) 21.06c 19.60c 23.00b 133.46c 4.17c 1.99c 0.025c
LSD 5% 5.03 4.46 2.32 15.23 0.65 0.42 0.01
32F10 42.33b 43.13a 25.06b 254.20b 9.26b 3.36b 0.046b
King cross 34.06c 28.00b 22.66c 200.46c 6.86c 2.40c 0.035c
NK-8441 52.20a 38.66a 27.93a 309.80a 11.82a 4.31a 0.056a
LSD 5% 3.76 6.06 1.89 16.59 0.73 0.35 7.06
Means sharing the same letter do not differ significantly at P=5%, Relative Water Contents (RWC), Membrane stability index (MSI), Total chlorophyll contents (TCC), CO2 Assimilation (Ci), Transpiration Rate (E), Photosynthetic Rate (A)
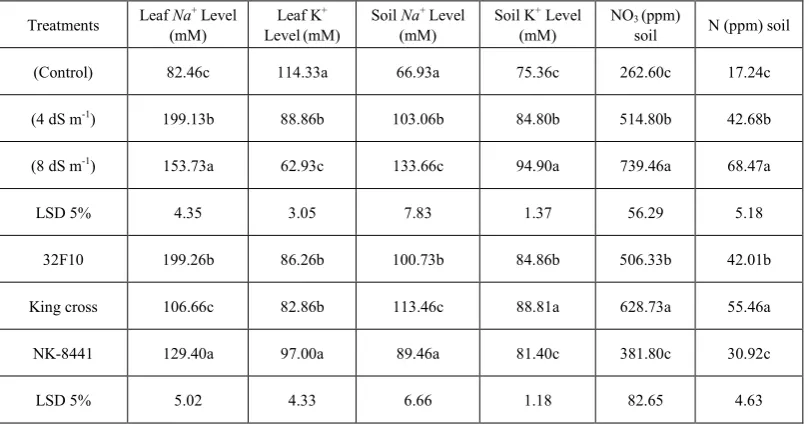
Table 3. Effect of salinity on ionic parameters of maize
Treatments Leaf (mM) Na+ Level LevelLeaf K(mM) + Soil Na(mM) + Level Soil(mM) K+ Level NO3 (ppm)
soil N (ppm) soil
(Control) 82.46c 114.33a 66.93a 75.36c 262.60c 17.24c
(4 dS m-1) 199.13b 88.86b 103.06b 84.80b 514.80b 42.68b
(8 dS m-1) 153.73a 62.93c 133.66c 94.90a 739.46a 68.47a
LSD 5% 4.35 3.05 7.83 1.37 56.29 5.18
32F10 199.26b 86.26b 100.73b 84.86b 506.33b 42.01b
King cross 106.66c 82.86b 113.46c 88.81a 628.73a 55.46a
NK-8441 129.40a 97.00a 89.46a 81.40c 381.80c 30.92c
LSD 5% 5.02 4.33 6.66 1.18 82.65 4.63
Means sharing the same letter do not differ significantly at P=5%, Sodium (Na+), Potassium (K+), Nitrate (NO
3-), Nitrogen (N) Membrane stability index (MSI): The data presented in the
table 2 showed that at all salinity levels control (1.2 dS m-1), 4 dS m-1 and 8 dS m-1EC
e MSI decreased significantly with
increase in salinity and maximum MSI was found in NK-8441 while the minimum in King Cross at control (1.2 dS m-1) EC
e level. Maximum and the minimum MSI
recorded in the order NK-8441 > 32F10 > King Cross. Salinity reduces MSI by causing changes in morphology and physiology of plants. It reduces the succulence of leaves as a result MSI is reduced. The membrane stability index (MSI) in leaves of sugarcane cultivars under control and salt stress condition showed a decreasing trend with maturity in all the genotypes [14]. Same results were studied by Tas and Basar (2009).
Total chlorophyll contents (TCC): The data presented in
the table 2 showed that at all salinity levels control (1.2 dS m-1), 4 dS m-1 and 8 dS m-1EC
e TCC decreased significantly
with increased salinity. The reduction in total chlorophyll content is to be expected under stress conditions. Its stability depends on membrane stability, which under saline condition seldom remains intact [23]. Similar results were also reported by [1, 5, 14, 21, 23, 26, 32, 40]. Total chlorophyll contents of plants may be considered as an indicator in improving new genotypes for salt stress depending on the present or other findings.
Stomatal conductance (GS): The data presented in the table 2 showed that at all salinity levels control (1.2 dS m-1), 4 dS m-1 and 8 dS m-1 EC
e maximum and the minimum
[image:3.595.104.509.349.564.2]maize and sunflower salinity reduces leaf water potential and stomatal conductance. Photosynthesis is an accepted fact that determines the final plant productivity. Salinity decreased the net photosynthetic rate, stomatal conductance, intercellular carbon dioxide concentration and transpiration rate, but increased the leaf temperature of rice [37]
CO2 Assimilation (Ci): The data presented in the table 2 showed that CO2 assimilation decreased significantly with increase in salinity at all salinity levels. NK-8441 was better in CO2 assimilation than 32F10 and King cross. Salinity decreased the net photosynthetic rate, stomatal conductance, intercellular carbon dioxide concentration and transpiration rate, but increased the leaf temperature of rice [37]. Similar results were found by [33].
Transpiration Rate (E): The data (table 2) revealed that transpiration rate decreased significantly with increased salinity level. Transpiration rate recorded in the order NK-8441 > 32F10 > King Cross at all salinity levels of control (1.2 dS m-1), 4 dS m-1 and 8 dS m-1 EC
e. Salinity
decreased the net photosynthetic rate, stomatal conductance, intercellular carbon dioxide concentration and transpiration rate, but increased the leaf temperature of rice [37].
Photosynthetic Rate (A): The data (table 2) cleared that photosynthetic rate decreased significantly with increase in salinity and maximum Photosynthetic rate was found in NK-8441 while, the minimum in King Cross at control (1.2 dS m-1) EC
e level. At 4 dS m-1ECe level, the maximum and
the minimum Photosynthetic rate was recorded in NK-8441 and King Cross, respectively. At 8 dS m-1 EC
e level,
NK-8441 was better in photosynthetic rate than 32F10 and King cross. Photosynthesis is an accepted fact that determines the final plant productivity. Salinity decreased the net photosynthetic rate, stomatal conductance, intercellular carbon dioxide concentration and transpiration rate, but increased the leaf temperature of rice [37].
Effect on salinity on ionic expressions of Maize: Salinity has very clear affects on ionic composition of maize and maize grown soil, especially when exposed to salinity index of 8 dS m-1. Maize genotype NK-8441 showed better chemical attributes at all salinity levels. Salinity effect on ionic composition of plant and soil is discussed below:-
Leaf Sodium Level (Na+): The data presented in the table
3 showed that Na+concentration in leaf sap was increased
significantly with increased ECe levels. At all levels, the
maximum Na+ concentration was recorded for King Cross.
The minimum Na+ concentration was noticed for NK-8441
at all salinity levels. A positive correlation exists between
Na+ exclusion and relative salt tolerance in many crops
including barley [34], rice [7] beans and sunflower [ 4, 6, 20]). Efficient Na+ exclusion is a good selection criterion for
salt tolerance in maize and other glycophytes [4, 9, 30]. The concentration of N, NO-3, P and K was reduced in the salinity treatments, but the concentration of Na+ and Cl- was
increased. [12].
Leaf Potassium Level (K+): The data (table 3) revealed that K+ concentration in leaf sap was decreased considerably
with increased ECe levels. The minimum K+ was found in
King Cross at all the ECe levels, whereas the maximum K+
concentration was found in NK-8441 which varied significantly at all ECe levels. Almost similar results had
been observed by [27]. Salt stress induced Na+ and Cl
-accumulation it decrease K+ and Ca2+ level in shoots and roots, therefore salt decrease relative growth rate of shoots and roots. Decreased K+ concentration with increased salinity was also reported earlier by [3, 30] in maize.
Soil Sodium Level (Na+): The data (table 3) showed that
Na+ concentration in soil was decreased significantly with
increased ECe levels. At all levels, the minimum Na+
concentration was recorded for King Cross. The maximum
Na+ concentration at moderate NaCl induced salinity was
observed for NK-8441, while at 8 dS m-1 EC
e level, the
maximum was observed for NK-8441 and minimum for King Cross. Na+ uptake by plant under saline conditions was
more so as a result Na+ concentration increases in soil as the
salinity level increases. [12] the concentration of N, NO3, P and K+ was reduced in the salinity treatments, but the concentration of Na+ and Cl- was increased.
Soil Potassium Level (K+): The data presented in the table 3 shows that K+ concentration in soil was increased significantly with increased ECe levels. The maximum K+
was found in King Cross at all the ECe levels, whereas the
minimum K+ concentration was found in NK-8441 which varied significantly at all ECe levels. K+ up take from soil
under salinity is suppressed by Na+ uptake, resulting in high
concentration of K+ in saline soils. There is a debate that K+ influx could be used as an index to salinity tolerance [36]. Increased K+ concentration may be attributed to K+ selectivity for absorption.
Soil Nitrate (NO3-): The data (table 3) revealed that analyzed soil NO-3 concentration at all salinity levels of control (1.2 dS m-1), 4 dS m-1 and 8 dS m-1 was minimum for cultivar NK-8441and maximum for cultivar King Cross. [12] the concentration of N, NO3, P and K+ was reduced in the salinity treatments, but the concentration of Na+ and Cl- was
increased. [28] Salinity in a straight line can affect nutrient uptake such as Na+, reducing K+ uptake or by Cl- reducing
NO3- uptake.
Soil Total Nitrogen (N): The data presented (table 3) cleared that N concentration was increased significantly with increased ECe levels. At all levels, the maximum N
concentration was recorded for King Cross. The minimum N concentration at moderate NaCl induced salinity was observed for NK-8441, while at 8 dS m-1 EC
e level, the
4. Conclusions
After investigating the all above mentioned physiological and ionic attributes, results were found significant. Among the three commercial hybrids of maize NK-8441(Syngenta) was found comparatively best variety due to its better mechanism against salinity stress.
On an overall basis NK-8441 (Syngenta) and 32F10 (Poineer) were proved to be the best at intermediate salinity level. However, at 8 dS m-1 salinity level NK-8441 proved to be relatively salt tolerant of all cultivars. It also had higher K+ as well as lower concentration of Na+ concentration in its leaf sap. It means that it had a relatively better mechanism of Na+ exclusion. At the same time it had better system of K+ maintenance in its leaves.
REFERENCES
[1] Almodares, A., M.R. Hadi and B. Dosti. 2008. The Effects of Salt Stress on Growth Parameters and Carbohydrate s Contents in Sweet Sorghum. Res. J. Environ. Sci. 2(4): 298-304.
[2] Ali, A., T.C. Tucker, T.L. Thompson and M. Salim. 2001. Effects of Salinity and Mixed Ammonium and Nitrate Nutrition on the Growth and Nitrogen Utilization of Barley. J. Agronomy & Crop Sci. 186: 223-228.
[3] Akhtar, J., M. Saqib, R.H. Qureshi and M. Aslam. 2002. Effect of salinity and sodicity on grain yield, different yield components and ionic relations of different wheat genotypes. P.46. In: Abstracts of the paper presented in the 9th International Congress of Soil Science. March 18-20, 2002, NIAB, Faisalabad, Pakistan.
[4] Ashraf, M. and R. Noor. 1993. Growth and pattern of ion uptake in Eruca sativa Mill under salt stress. Ange. Bot. 67:17-21.
[5] Ashraf, M. Y., K. Akhtar, G. Sarwar and M. Ashraf. 2005. Role of rooting system in salt tolerance potential of different guar accessions. Agronomy for Sustainable Development, 25: 243-249.
[6] Ashraf, M. and R. Sultana. 2000. Combination effect of NaCl salinity and nitrogen form on mineral composition of sunflower plants. Biologia Plantsrum. 43(4): 615-619. [7] Aslam, M., R.H. Qureshi and N. Ahmed. 1993. Mechanisms
of salinity tolerance in rice (Oryza sativa L.). In: Lieth, H. and Al Massoum, A. (eds.) Towards the rational use of high salinity tolerant plants. Kluwer Acad. Pub. Netherlands. p. 135-138.
[8] Azevedo-Neto, D.D., J.T. Prisco, J. Eneas, C.E.B. de Abreu and E. Gomes. 2006. Effect of salt stress on antioxidative enzymes and lipid peroxidation in leaves and roots of salt-tolerant and saltsensitive maize varieties. Environ. Exp. Bot. 56: 87-94.
[9] Ballesteros, E., E. Blumwald, J.P. Donaire and A. Beluer.1996. H+-ATPase and H+-Ppase activites of
tonoplast-enriched vesicles isolated from sunflower roots.
Physiol. Plant. 97: 259-268.
[10] Cicek, N. and H. Cakirlar. 2002. The effects of salinity on some physiological parameters in two maize cultivars. Bulg. J. plant physiol. 28: 66-74.
[11] Dowswell, R.C., R.L. Paliwal and Ronald-Cantrell. 1996. Maize is the third World Winrock Development-Oriented Literature Series, West view Press, Boulder, Colo. Pp 268. [12] Fakhrzad, F. and S.J. Tabatabaei. 2008. The effect of
potassium nitrate and sodium chloride salinity on the growth and development of turf (Lo-Lium perenne L.). Journal of agricultural science (University of Tabriz). 18(3): 57-67. [13] Flores, P., M. Carvajal, A. Cerda and V.Martinez. 2001.
Salinity and ammonium/nitrate interactions on tomato plant development, nutrition, and metabolites. J Plant Nutr. 24: 1561–73.
[14] Gomathi, R. and P. Rakkiyapan. 2011. Comparative lipid peroxidation, leaf membrane thermostability, and antioxidant system in four sugarcane genotypes differing in salt tolerance. International Journal of Plant Physiology and Biochemistry. 3(4): 67-74.
[15] Grattan, S.R. and C.M. Grieve. 1999. Salinity-mineral nutrient relations in horticultural crops. Scientia Hort. 78:127-157.
[16] Govt. of Pakistan. 2012-13. Pakistan Bureau of Statistics. 2012-13. Ministry of Food, Agriculture and Livestock, Economic Wing, Islamabad.
[17] Gadallah, M.A.A. 1999. Effects of proline and glycinebetaine on Vicia faba responses to salt stress. Biol. Plant. 42: 249-257.
[18] Hoorn, J.W., N. Katerji, A. Hamdy and M. Mastrorillid. 2001. Effect of salinity on yield and nitrogen uptake of four grain legumes and on biological nitrogen contribution from the soil. Agricultural Water Management. 51: 87–98.
[19] Hu, Y., Z. Burucs, S.V. Tucher and U. Schmidhalter. 2007. Short-term effects of drought and salinity on mineral nutrient distribution along growing leaves of maize seedlings. Environmental and Experimental Botany. 60: 268–275. [20] Hussain, M.K. and O.U. Rehman.1995. Breeding sunflower
for salt tolerance. Association of Seedling growth and mature plant traits for salt tolerance in cultivated sunflower (Helianthus annus L.). Helia. 18:69-76.
[21] Iqbal, M., M. Ashraf, A. Jamil, S.U. Rehman. 2006. Does Seed Priming Induce Changes in the Levels of Some Endogenous Plant Hormones in Hexaploid Wheat Plants under Salt Stress? J. Integr. Plant Biol. 48(2): 181-189. [22] Katerji, N., J.W. Hoorn, A. Hamdy, F. Karam and M.
Mastrorilli. 1994. Effect of salinity on emergence and on water stress and early seedling growth of sunflower and maize. Agricultural Water Management. 26: 81-91.
[23] Khan, M.A., M.U. Shirazi, M.A. Khan, S.M. Mujtaba, E. Islam, S. Mumtaz, A. Shereen, R.U. Ansar and M.Y. Ashraf. 2009. Role of Proline, K/Na Ratio and Chlorophyll Content in Salt Tolerance of Wheat (Triticum Aestivum L.). Pak. J. Bot. 41(2): 633-638.
[25] Kirst, G.O., 1989. Salinity tolerance of eukaryotic marine algae. Annu. Rev. Plant Physiol. Plant Mol. Biol. 40: 21-53. [26] Lacerda, C.F., J. Cambraia, M.A. Oliva, H.A. Ruiz and J.T.
Prisco. 2003. Solute Accumulation and Distribution During Shoot and Leaf Development in Two Sorghum Genotypes under Salt Stress. Environ. Exp. Bot. 49: 107-120.
[27] Mansoor, M.M.F., K.H.A. Salma, F.Z.M. Ali and A.F. Abou Hadid. 2005. Cell and plant response to NaCl in Zea MaysL. cultivars differing in salt tolerance. Gen. Appl. Plant Physiology, 31 (1-2) 29-41.
[28] Maas E.V. and S.R. Grattan. 1999. Crop yields as affected by salinity. In: Pessarakli M. (ed.): Handbook of Plant and Crop Stress. Marcel Dekker, New York: 55–108.
[29] Munns, R., R.A. James and A. Läuchli. 2006. Approaches to increasing the salt tolerance of wheat and other cereals. J. Exp. Bot. 57: 1025-1043.
[30] Nawaz, S., M. Akhtar, M. Aslam, R.H. Qureshi, Z. Ahmad and J. Akhtar.2002. Anatomical, morphological and physiological changes in sunflower verities because of NaCl salinity. P. 46. In: Abstracts of the paper presented in the 9th international congress of Soil Science. March 18-20, NIAB, Faisalabad, Pakistan.
[31] Oliel, G. B., S. Kant, M. Naim, H. D. Rabinowitch, G. R. Takeoka, R. G. Buttery and U. Kafkafi (2005). Effects of ammonium to nitrate ratio and salinity on yield and fruit quality of larg and small tomato fruit hybrids.J. Plant Nutr.27(10):1795-1812.
[32] Oncel, I. and Y. Keles. 2002. Changes of Growth, Chlorophyll Content and Solute Composition in Wheat Genotypes Under Salt Stress. C.U. Fen-Edebiyat Fak. Fen Bil. Derg. 23(2): 8-16.
[33] Plaut, Z. and E. Federman. 1990. Acclimation of CO2
Assimilation in Cotton Leaves to Water Stress and Salinity1. Plant Physiol. 97: 515-522.
[34] Rashid, A., R. H. Qureshi, P. A. Hollington and R. G. Wyn Jones. 1999. Comparative response of wheat (Triticum aestivum L.) cultivars to salinity at seedling stage. Agron. Crop Sci. 182: 190-207.
[35] Shafqat, M.N., G. Mustafa, S.M. Mian and R.H. Qureshi. 1998. Evaluation of physiological aspects of stress tolerance in wheat. J. Soil Sci. 14:85-89.
[36] Silberbush, M. 2001. Potassium influx to roots of two sorghum genotypes grown under saline conditions. J. Plant Nutrition. 24(7): 1035-1045.
[37] Sultana, N., T. Ikeda and M.A. Kashem. 2002. Effect of Seawater on Photosynthesis and Dry Matter Accumulation in Developing Rice Grains. Photosynthetica. 40(1): 115-119. [38] Steel, R.G.D., J.H. Torrie and D.A. Dickey. 1997. Principles
and Procedures of Statistics: A Biometrical Approach. 3rd edition McGraw Hill Book Co. Inc., New York, pp: 400–428. [39] Tas, B., H. Basar, 2009. Effects of various salt compounds and their combinations on growth and stress indicators in maize (Zea mays L.). African J Agric Res., 4: 156-161. [40] Turan, M.A., A.H.A. Elkarim, N. Taban, and S. Taban. 2009:
Effect of salt stress on growth, stomatal resistance, proline and chlorophyll concentrations on maize plant. African J. of Agri. Res. 4(9): 893 – 897.
[41] U.S. Salinity Lab. Staff. 1954. Diagnosis and Improvement of Saline & Alkali Soils. USDA Handb. No. 60. Washington, DC. 160p.