Public Health Theses School of Public Health
Spring 5-7-2011
Discordance of Drug Susceptibility Test Data between the CDC
Discordance of Drug Susceptibility Test Data between the CDC
Mycobacteriology Laboratory and Local Public Health
Mycobacteriology Laboratory and Local Public Health
Laboratories Participating in Tuberculosis Clinical Trials, TBTC,
Laboratories Participating in Tuberculosis Clinical Trials, TBTC,
CDC
CDC
Anne Havilah Patala Georgia State University
Follow this and additional works at: https://scholarworks.gsu.edu/iph_theses Part of the Public Health Commons
Recommended Citation Recommended Citation
Patala, Anne Havilah, "Discordance of Drug Susceptibility Test Data between the CDC Mycobacteriology Laboratory and Local Public Health Laboratories Participating in Tuberculosis Clinical Trials, TBTC, CDC." Thesis, Georgia State University, 2011.
https://scholarworks.gsu.edu/iph_theses/171
DISCORDANCE OF DRUG SUSCEPTIBILIY TEST DATA BETWEEN THE CDC
MYCOBACTERIOLOGY LABORATORY AND LOCAL PUBLIC HEALTH LABORATORIES PARTICIPATING IN TUBERCULOSIS CLINICAL
TRIALS, TBTC, CDC
By
ANNE HAVILAH PATALA
B Tech, Jawaharlal Nehru Technological University
A Thesis submitted to the Graduate Faculty of
Institute of Public Health, Georgia State University
In partial fulfillment for the degree of
MASTER OF PUBLIC HEALTH
ATLANTA, GEORGIA
APPROVAL PAGE
DISCORDANCE OF DRUG SUSCEPTIBILIY TEST DATA BETWEEN THE CDC MYCOBACTERIOLOGY
LABORATORY AND LOCAL PUBLIC HEALTH LABORATORIES PARTICIPATING IN TUBERCULOSIS CLINICAL TRIALS, TBTC, CDC
By
ANNE HAVILAH PATALA
APPROVED:
__________________________________________ Committee Chair
__________________________________________ Committee Member
__________________________________________
DEDICATION PAGE
ACKNOWLEDGEMENTS
I am thankful to God who has guided me through each step of my life. I want to thank my parents and the rest of my family for all their support and love. I would like to extend my deepest gratitude to Lorna Bozeman MS, Dr. Stefan Goldberg, and Dr. Ruth Moro for their guidance, support and enthusiasm. I would also like to thank Dr. Richard
Author’s Statement
In presenting this thesis as a partial fulfillment of the requirements for an advanced degree from Georgia State University, I agree that the Library of the University shall make it available for inspection and circulation in accordance with its regulations governing materials of this type. I agree that permission to quote from, to copy from, or to publish this thesis may be granted by the author or, in her absence, by the professor under whose direction it was written, or in his absence, by the Associate Dean, College of Health and Human Sciences. Such quoting, copying, or publishing must be solely for scholarly purposes and will not involve any potential financial gain. It is understood that any copying from or publication of this dissertation which involves potential financial gain will not be allowed without written permission of the author.
Notice to Borrowers
All theses deposited in the Georgia State University Library must be used in accordance with the stipulations described by the author in the preceding statement.
The author of this thesis is:
Anne Havilah Patala 424 Marsh Trail Circle Atlanta-30328
The Chair of the committee for this thesis is:
Dr. Richard Rothenberg MD MPH
Institute of Public Health, College of Health and Human Sciences
Georgia State University P.O. Box 3995 Atlanta, Georgia 30302-3995
Users of this thesis who are not regularly enrolled as student of Georgia State University are required to attest acceptance of the preceding stipulation by signing below. Libraries borrowing this thesis for the use of their patrons are required to see that each user records here the information requested.
NAME OF USER ADDRESS DATE TYPE OF USE
ANNE PATALA
Address: 424 Marsh Trail Circle, Atlanta, GA – 30328
Phone: (678)-644-3433 Email: [email protected]
EDUCATION:
Masters in Public Health (Expecting: May, 2011) - Program GPA: 3.91
Georgia State University
Bachelor of Technology in Biotechnology - GPA: 3.4 (86%)
Jawaharlal Nehru Technological University, India
EXPERIENCE:
Centers for Disease Control, Atlanta, GA
Epidemiology Assistant (Division of Tuberculosis Elimination) (2010-Present)
• Clinical trials study implementation, Quality assurance, data entry, and data management.
• Adverse event database management and analysis of Tuberculosis drug susceptibility test data using SAS 9.2.
Georgia State University, Atlanta, GA
Graduate Lab Assistant (2008-Present)
• Working part time for solving hardware and software problems, better lab functioning and maintenance.
Graduate Research Assistant (2008-2009)
• Investigated two projects- West Nile Virus – X ray crystallography and Utilization of
Se-Derivatized RNA for RNA interference in a Biology research lab using my
knowledge and hands on experience in microbiology, genetics, biochemistry.
Graduate Teaching Assistant (2009-Present)
• Instructed and trained undergraduate students on laboratory techniques and scientific writing for both biology and non-biology majors at GSU. Other responsibilities include
TITLE OF THE THESIS:
DISCORDANCE OF DRUG SUSCEPTIBILIY TEST DATA BETWEEN THE CDC MYCOBACTERIOLOGY LABORATORY AND THE
LOCAL PUBLIC HEALTH LABORATORIES IN DRUG EFFICACY TESTING CLINICAL TRIALS, TBTC, CDC
STUDENT NAME:
ANNE HAVILAH PATALA, B.Tech
THESIS CHAIR:
DR. RICHARD ROTHENBERG, MD, MPH
ABSTRACT
BACKGROUND: Multi drug resistant Tuberculosis (MDR-TB) is a serious public health concern in many parts of the world. As per the WHO- 2010 global report on Surveillance and response 3.6% of all incident TB cases globally are multidrug resistant. In this regard, there is an increasing demand for timely, reliable and comprehensive drug susceptibility testing (DST) as MDR-TB surveillance is being geared up. The intent of this analysis is to determine whether there is a need to continue routine confirmatory DST testing at CDC in addition to just sending the isolates for genotyping. Analysis is done by measuring the discordance between the results of laboratory DST at CDC and the local labs drug type, drug testing concentrations, and study sites.
METHODS: The data for this analysis was provided by the Tuberculosis Trials
Consortium (TBTC), CDC. Data for this analysis was collected over nearly two decades (1993-2011), gathered from 7 clinical trials. Discordance between the local and CDC lab DST results was measured using Kappa statistic. Sensitivity and specificity analysis was done by taking the CDC DST lab results as the gold standard. Discordance levels were calculated by local sites and baseline drug resistance for each antibiotic in each study was measured.
RESULTS: Average Kappa values for inter rater agreement for all the studies was 0.6444 whereas the overall level of discordance across all studies is 7.786%. Drug resistance at baseline was highest for Isoniazid and Streptomycin (except Study 23 and 22).
TABLE OF CONTENTS
APPROVAL
DEDICATION
ACKNOWLEDGEMENT
INTRODUCTION……… 1
REVIEW OF THE LITERATURE……….... 3
2.1 Global Burden of Tuberculosis……… 3
2.2 TB History and Overview ……….3
2.3 Close Association of TB with poverty……….… 4
2.4 Current Trends in TB………... 5
2.5 Evolution of Public Health practices in tackling TB………...5
2.6 TB Drugs……….6
2.7 Fighting TB-Challenges………...8
2.8 Current Methods for MTB detection and drug susceptibility testing……….11
2.9 Description of drug efficacy testing clinical trials by TB Trials Consortium, CDC.14 METHODOLOGY……….…… 17
3.1 Data Sources and Study Population………...17
3.2 Objectives………..……17
3.3 Hypothesis……….18
3.4 Study Design……… 18
3.5 Methodology for each study specifically and variables analyzed………. 22
RESULTS………. 28
4.1 Discordance analysis……….. 28
DISCUSSION AND CONCLUSION………...32
5.2 Limitations of the Study………... 34
5.3 Recommendations ………... 35
5.4 Conclusion………... 36
LIST OF TABLES
Table 1 Comparison of discordance results for antibiotics in Study 29 33
Table 2 Comparison of discordance results for antibiotics in Study 28 35
Table 3 Comparison of discordance results for antibiotics in Study 27 36
Table 4 Comparison of discordance results for antibiotics in Study 25 37
Table 5 Comparison of discordance results for antibiotics in Study 24 39
Table 6 Comparison of discordance results for antibiotics in Study 23 41
Table 7 Comparison of discordance results for antibiotics in Study 22 43
Table 8 Discordance by local site –Study 29 44
Table 9 Discordance by local site –Study 28 46
Table 10 Discordance by local site –Study 27 48
Table 11 Discordance by local site –Study 25 49
Table 12 Discordance by local site –Study 24 50
Table 13 Discordance by local site –Study 23 52
Table 14 Discordance by local site –Study 22 53
Table 15 Study 29- Kappa statistic and interpretation 55
Table 16 Study 28- Kappa statistic and interpretation 56
Table 17 Study 27- Kappa statistic and interpretation 57
Table 18 Study 25- Kappa statistic and interpretation 58
Table 19 Study 24- Kappa statistic and interpretation 59
Table 20 Study 23- Kappa statistic and interpretation 60
Table 21 Study 22- Kappa statistic and interpretation 61
Table 23 Data cleaning methodology (record particulars) for all studies 63
Figure 1 Model diagram of methodology for data cleaning (All studies) 64
CHAPTER I
INTRODUCTION
Tuberculosis (TB), one of the most deadly diseases throughout history,
is the second leading cause of death among infectious diseases. While effective treatment
regimens are continuously being improvised, emergence of multidrug resistance to anti
TB drugs is currently a huge hindrance in combating this lethal infection. TB Drug
susceptibility testing (DST), documented to be one of the most complex procedures to
standardize in the Mycobacteriology laboratory requires technical expertise to produce
valid and reliable results and requires up to 8 weeks to get results by commonly used
methodology 51. DST on initial isolates from all patients enrolled in Tuberculosis Trials
Consortium (TBTC) studies is done to identify an effective anti-TB regimen at Local
Public Health Laboratories to assure an effective treatment regimen is prescribed.
Subcultures of initial isolates from local labs are subsequently sent to the
Mycobacteriology laboratory (CDC) for confirmatory DST.
The goal of this study is to measure the discordance between the results
of laboratory DST at CDC and the local labs. The intent of the analysis is to determine
whether there is a need to continue routine confirmatory DST testing at CDC in addition
to just sending the isolates for genotyping. Also measuring discordance by various factors
such as the drug type, drug testing concentrations, and study sites is critical part of this
analysis. Since the clinical decisions are based on the local lab results, the reliability of
lab test results and the study site’s potential for DST lab testing is imperative. Another
entering TBTC studies (22, 23, 24, 25, 27, 28 and 29) as most studies assume a pan
sensitive population. This will help understand if the current lab techniques are enabling
the timely detection of drug resistance in new patients. At sites with considerable
background rates of drug resistant TB, suggestions to use new molecular DST (Rapid
MDR TB identification tests such as Gene xpert) which give results in hours might be
3
2.1 Global burden of Tuberculosis
Tuberculosis (TB), a worldwide pandemic, is the seventh leading cause of
mortality globally and ranks second only to human immunodeficiency virus (HIV) as a
cause of death from an infectious agent 1. TB bacilli infect around one third of the
world’s population, approximately 2 billion people 3. According to the 2009 WHO report,
the estimated global incidence of TB was 9.4 million, the estimated global prevalence 11
million with the largest proportion of estimated cases occurring in South-East Asia region
(34%), the Western Pacific region (21%) and African Region (30%) 2. Among the 22
High Burden Countries (HBCs) which account for 80% of new cases every year, India,
China, Indonesia, South Africa and Nigeria are among the highest TB incidence countries
4 .
2.2 TB history and overview:
TB is an airborne, infectious disease caused by Mycobacterium tuberculosis
(MTB) that primarily attacks the lungs and sometimes other organs such as kidney, spine
and brain. It can cause two reactions in the human body: either the latent TB infection
(LTBI) or active TB disease. Latent infection occurs when the person is infected with
MTB (shows no symptoms) but the immune system fights progression to TB disease.
Test (TST) or special TB blood test. Active TB disease occurs when the bacteria are
rapidly multiplying in the body and the immune system is incapable of stopping the
proliferation. Most often (around 75%) active TB is pulmonary (affecting the lungs).
Extra–pulmonary TB is less frequent at higher rates in immune compromised individuals.
(In this paper we follow common usage and take TB to mean pulmonary tuberculosis.
Others forms will be specified.). Clinical manifestations of pulmonary TB include
chronic cough, weight loss, fever, fatigue, sweating, and blood tinged sputum 18, 19, 20.
Evidence exists in the form of skeletal remains with TB (4000 BC) and
tubercular decay in the spines of Egyptian mummies (3000-2400 BC), thus proving that
TB is one of the oldest infectious diseases 21. With the industrial revolution in 1600 AD,
TB became widespread with the growth and expansion of urban areas. The same
epidemiological trend is reflected in current urban areas wherein overcrowding, lack of
sanitation and malnutrition are the breeding grounds for TB 22.
2.3 Close association of TB with poverty:
Along with malaria and HIV, TB is a preventable and curable disease most
closely linked to poverty. Ninety-eight percent of TB deaths and 95% of TB incidence
occur in low and middle income countries 5. According to WHO estimates, average
incidence in low income countries is twenty times higher than in high income countries.
Several studies done in different locations showed that over -crowding, poor living and
working settings, HIV, malnutrition, homelessness, smoking, alcohol abuse, indoor air
pollution are environmental risk factors for TB 6,7,8,10 . TB not only thrives on poverty but
among the poor 13. Even in the developed world, similar epidemiology is documented -
higher rates of TB are found in poorer, underprivileged sections of the society and thus
underlining the close interaction between social determinants of health and existence of
TB 8,9,10,11,12,13,17. As the world’s population is rising, the number of people living in
poverty is also rising- posing a real threat to TB eradication programs.
The importance of tuberculosis among other infectious diseases is chiefly
attributed to the high case fatality rate among untreated and improperly treated patients.
According to Styblo & Enarson, two thirds of untreated smear positive patients will die
within five to eight years and most of them in the first 18 months 24. Even in smear
positive patients receiving anti TB drug treatment, the case fatality rate can be more than
10 percent in areas with low adherence rates or high HIV co infection and drug resistance
rates 25.
2.4 Current trends in TB:
Currently the incidence of TB is gradually declining in most countries (since the
peak in 2004) and also the death rate is declining (since 2000) due to the diagnosis and
treatment of TB. However, treatment programs have not had a major, detectable impact
on incidence on the whole 65. In the United States, there has been a steady decline and in
2010 there was lowest recorded incidence 66, 67.
2.5 Evolution of public health approaches for tackling TB:
The approaches to control TB changed over the years (1948-present). The DOTS
controlling this world wide public health emergency which included political
commitment, increasing case detection rate using sputum smear microscope,
standardizing short course therapies including (Directly Observed Therapy) DOT, regular
supply of drugs and this DOTS strategy is estimated to be one of the most cost effective
interventions currently available 33, 34.
2.6 TB drugs:
Before the introduction of the anti TB drugs in the 1950s and the development of
drug regimens during 1980s, mortality due to pulmonary TB was estimated to be 50%.
The discovery of streptomycin and its clinical use as the first specific anti tuberculosis
drug is a significant milestone in efforts to fight TB 23. Anti TB drugs today are classified
into first line, second line and third line drugs. First line drugs are highly effective and
essential components of a short course regimen while second line drugs frequently
produce adverse events. Ethambutol (E or EMB), Isoniazid (H or INH), Pyrazinamide (Z
or PZA), Rifampicin (R or RMP) (equivalent to Rifampin (RIF) in US), streptomycin (S
or STM) are classified as first line drugs. Second line drugs include aminoglycosides,
polypeptides, fluoroquinolones, thioamides, cycloserine, p-aminosalicyclic acid 26.
Examples of newly discovered drugs are Fluoroquinolones- levofloxacin, gatofloxacin
and moxifloxacin 35. The current recommended drug regimen for most patients with
pulmonary TB is a 6 month multi drug regimen with two phases – Intensive phase (four
first line drugs, isoniazid, rifampin, pyrazinamide, and ethambutol) for 2 months and
regimens are explored based on the drug susceptibility results, toxicity patterns and
administration strategies (Example: DOTS) 27, 28
2.6.1 Isoniazid:
Isoniazid (INH), one of the primary drugs in TB treatment today has been in use
since 1952 due to its efficacy, low toxicity and reasonable cost. When Isoniazid was used
in a clinical trial for the first time, it was so successful that patients were reported to be
‘dancing in their wards’. Oxygen is important for the action of INH and it is active
against growing tubercle bacilli and not the resting organisms. Isoniazid is a “pro” drug
which needs to be activated by the catalase-peroxidase enzyme which is coded by katG
gene and once the drug is activated it shows highly specific activity against mycobacteria
by inhibiting the biosynthesis of mycolic acids which are an essential component of the
mycobacterial cell wall (36). According to Mitchinson, Isoniazid kills 95% of
mycobacteria in the first 2 days of treatment while Rifampicin is more effective in the
continuation phase (28, 29).
2.6.2 Rifamycins:
Rifamycins are among the most potent antibiotics against tubercle bacilli both in
log and stationary phases. They possess unique characteristics of not only acting rapidly
after exposure to bacilli but also being bactericidal months after the start of the treatment
regimen (29). Mechanism of action is by inhibiting an enzyme DNA dependent RNA
polymerase synthesis through binding to the growing DNA chain (37). 95% of rifamycin
2.6.3 Ethambutol:
Ethambutol, first introduced in 1961, is still an enigma with respect to its
mechanism of action and molecular basis for drug resistance. It is believed that it is
effective against mycobacteria by specifically inhibiting various steps in the bacterial cell
wall synthesis (39).
2.6.4 Pyrazinamide:
Pyrazinamide, one of the first line drugs has an incredible sterilizing activity
thus killing the persisting bacilli and enabling the shortening of treatment regimen from 9
months to 6 months. It is also a prodrug and converted into Pyrazinoic acid by the
enzyme Pzase produced by M.tuberculosis. Resistance is mostly attributed to mutations
in this Pzase enzyme (40).
2.6.5 Streptomycin:
Streptomycin, first discovered by Waksman and colleagues in 1941 was
effective as an anti TB drug previously but not currently used as a mono therapy drug due
to increase in drug resistance and treatment failure 60. The mode of action of streptomycin
is inhibition of translation of m RNA and aberrant proofreading 41.
2.6.6 Fluoroquinolones:
Fluoroquinolones are currently used in drug resistance and for those who do not
tolerate therapy. In view of changing resistance patterns, they are now considered for
mutations in this enzyme are the most common reason for resistance. Mouse models
confirm these findings 42.
2.7 Fighting TB- challenges:
2.7.1 TB and HIV:
Globally around nine percent of TB incidence is attributed to HIV but in some
regions it is higher- WHO African region (31%) and also in industrialized nation- United
States (8.6%) 67. Also 12 % of TB deaths are attributed to HIV 14. There are more than 1
million TB cases in people with HIV. In a HIV infected person, TB is harder to diagnose
and progresses more rapidly 15. In addition, HIV infection weakens the immune system
and increases the probability of getting infected and progressing to active TB 15, 16.
Studies have shown that co-infection with HIV increases the risk of TB infection
developing into active TB by 10 fold 68. Out of the 1.8 million persons who died with TB
in 2007, estimates show that around 456,000 were HIV positive 3. These numbers prove
that the HIV pandemic poses a massive threat to global TB control programs.
Though some adverse drug-drug interactions between HAART (Highly active
anti retroviral therapy) and TB drugs (rifamycins), DOTS and anti retroviral therapies are
synergistic and without undergoing both of these therapies in combination, the life
expectancy of a HIV infected TB patient will be typically less than five years. Emphasis
on early detection and cure will help in minimizing TB related cases and deaths in a most
cost effective way according to results shown by mathematical models 45.
Multidrug resistant TB (MDR-TB), the condition where Mycobacteria are
resistant at least to Isoniazid (INH) and Rifampicin (RIF), the two most powerful drugs
against TB, is one of the huge challenges impeding public health efforts to control
tuberculosis. Drug resistant TB can occur in two ways- acquired or secondary drug
resistance and initial (primary) drug resistance. Acquired drug resistance which occurs
owing to discontinuous and ineffective therapy that selects a small number of resistant
mutants, is normally seen from 1 to 4 months after initiation of therapy. Serial exposure
to inadequate regimens enables the emergence of multi drug resistance. Initial resistance
occurs when a person is infected by drug resistant TB strains and can only be
distinguished from acquired resistance by comparing a patient’s baseline and follow up
drug susceptibility patterns. In the absence of microbiology data, it can be inferred by
knowing the past treatment regimens followed by the patient 31, 32.
Though the true levels of multidrug resistance are unknown, according to the
WHO 2008 estimates, around 440 000 cases of multidrug resistant TB emerged globally,
implying that around 3.6% of TB incident cases are multi drug resistant (MDR).
Moreover, national and regional anecdotal evidence points towards an increase in the
number of drug resistance cases throughout the world. Half of these cases occur in China
and India, and MDR-TB accounts for approximately 150 000 deaths. The most common
form of drug resistance in the US is Isoniazid resistance which has been documented in
10% of TB patients. The standard treatment regimen is not effective against MDR-TB,
and the alternatives are far more expensive, less potent, more toxic and takes longer for
According to the Stop TB initiative 2006-2015, there is a huge need for
resources to address this issue since estimates show that 1.3 million MDR-TB cases will
need treatment in 27 high MDR-TB burden countries (2010-2015) and this would cost
USD 16.2 billion. 29,423 MDR-TB cases reported throughout the world in 2008
represent only 7% of the estimated number of cases that year. The limited surveillance
for MDR-TB is attributed to deficiency of local laboratory resources and drug
susceptibility testing to identify incident MDR-TB cases. Only 1% of newly incident
cases underwent drug susceptibility tests (DST) in 2008. The distressing fact is that only
1% of the MDR-TB cases identified are enrolled in treatment 30. Increase in Multidrug
resistance throughout the world underlines the importance of need for accurate DST and
availability of alternate regimens to these patients. Molecular level understanding of
medicinal chemistry of anti TB drugs is necessary to understand multidrug resistance.
Analyzing drug susceptibility results is imperative to address the need for surveillance, to
propose improved treatment regimen and guidelines, to understand the risk factors in
proven cases of resistance and several other potential benefits.
2.8 Current methods for MTB detection and drug susceptibility testing:
Valid and reliable DST is important to design appropriate drug regimens. As
per the recommendations by the American Thoracic Society, initial isolates from all
patients must be tested for first line drug resistance (INH, RIF, ETH, and PZA).
Subsequently, isolates resistant to first line drugs must be tested for resistance to second
line drugs (fluoroquinolones, amikacin, kanamycin and capreomycin) 50, 69. DST results
analysis. ‘Resistance’ is defined as growth of greater than 1% of bacteria when ‘critical’
drug concentration is present. Critical concentration implies the minimum concentration
of the drug that inhibits 95% of wild strains of MTB. These concentrations have been
determined empirically and adopted worldwide 51.
There is an increasing need for development of rapid tests due to the high
rates of multidrug resistant TB (MDR-TB) and emergence of extensively drug resistant
TB (XDR-TB). It is highly important to identify cases of MTB and treat them in a timely
and efficient way. It normally takes 7 to 14 days to detect TB using methods such as
MGIT (Mycobacterium Growth Indicator) or BACTEC (Becton Dickinson) in
laboratories that are well established and funded 46. If traditional methods for culturing
MTB are followed (using Lowenstein-Jensen (LJ) and the less expensive Ogawa media
for example), it may take an average of 3 weeks for detection alone and DST may take an
additional 3 to 4 weeks 48. Lengthy periods for DST tests might lead to adverse
consequences such as assignment of inappropriate treatment, spread of drug resistance in
the community and augmentation of resistance in the patient 47. In the developing world
most TB control programs use stained sputum smears for case finding and mostly the
treatment regimen is given in the absence of Drug Susceptibility Testing 49.
Development of rapid tests will have individual and also public health benefits such as
enhanced diagnosis, improved survival chances, prevention of acquisition of further drug
resistance and reduced spread of resistance in the population. Nevertheless, as of now,
there is no single test which is good, quick, cheap and easy 47. Also most TB cases occur
in resource-limited countries where costly and sophisticated equipment requiring
The National Centre for Clinical Laboratory services recommends the agar
proportion method which is an inexpensive and comparatively simple method for DST
testing. The procedure for agar proportion method includes steps such as plating bacteria
on media with either no drug or critical concentration of the drug and then incubating for
3 weeks followed by counting of colonies. An isolate is defined as resistant if the number
of colonies on containing media is greater than 1% of number of colonies on
drug-free media. This method has been a “gold standard” in the US. In general, for first line
DST testing in the US, commercial broth systems is used rather than the time-consuming
agar proportion method. The minimum time for agar proportion method is 21 days 50, 52,
53
. Nevertheless, second line DST is mostly done using the agar proportion method. FDA-
cleared rapid broth DST tests exist for first line drugs but not for second line drugs so far
50
. Due to the emergence of multiple drug resistant TB, the CDC recommended DST on
all baseline isolates from each patient and repeated testing if the patient was not culture
converted after 3 months of therapy or failed to respond clinically to the treatment. In
addition, it is mandatory to report susceptibility results within 4 weeks after receiving the
specimen.
In the summary report on the TB drug susceptibility testing by the APHA
and CDC, several issues and concerns about current practices have been raised. Some of
the problems are due to the differential capabilities of Mycobacteriology labs and the
discrepancies that arise due to piece-meal services offered at each lab. Inefficient
communication between labs has been an issue of concern. Lack of confidence in drug
resistance results leads to continued retesting, further delaying the reporting of results.
2.9 Description of drug treatment testing clinical trials by TB Trials Consortium, CDC
(Studies- 22, 23, 24, 25, 27, 28 and 29):
CDC Tuberculosis Trials Consortium (TBTC) conducts clinical,
microbiological and epidemiological research in areas such as diagnosis, clinical
management and prevention of TB infection and disease. It has several sites in various
parts of the globe- United States, Canada, Brazil, Peru, Spain, South Africa, Uganda,
Vietnam and China. For laboratory services, the sites rely on local Mycobacteriology labs
and also the CDC Mycobacteriology lab which acts as the central lab for confirmatory
drug susceptibility testing (where second line drug resistance testing is also performed,
unlike the local labs where only first line drug resistance is tested). Below is a synopsis of
some of the clinical trials done by TBTC:
• Study 29 is a prospective, multicentre, open label Phase II clinical trial designed to
evaluate the efficacy and safety of an experimental intensive phase (first 8 weeks of
treatment) tuberculosis treatment regimen in which daily Rifapentine is substituted
for Rifampin in combination with INH, ETH and PZA. Patients with suspected
pulmonary tuberculosis and other inclusion criteria were enrolled in the study 43.
• Study 28 is a multicenter, placebo-controlled, Phase II- double-blind trial designed to
evaluate the effect of using Moxifloxacin (M) in place of Isoniazid (H), in
combination with Rifampin (R), Pyrazinamide (Z) and Ethambutol (E) on 2-month
culture conversion rates among patients with sputum smear-positive pulmonary
tuberculosis 44, 70.
• Study 27 is a double-blind, Phase II, randomized, multicenter study by the
Canada and Brazil to assess the effect of using Moxifloxacin (Moxi) in place of
Ethambutol (E), in combination with Isoniazid (H), Rifampin (R), and Pyrazinamide
(Z) on 2-months culture conversion among patients with sputum smear-positive
pulmonary tuberculosis28, 72.
• Study 25 is a prospective, randomized, double-blind study to test the tolerability of
three different doses (900 mg, 1200mg, 600mg) of Rifapentine in the treatment of
tuberculosis. HIV seronegative patients with culture positive drug susceptible
tuberculosis were enrolled into this study59, 73.
• Study 24 aimed at determining the efficacy of a largely intermittent regimen for
INH-resistant or INH intolerant Tuberculosis.It is a prospective, open-label,
nonrandomized trial where in the patients enrolled must be sensitive to Rifampin,
Ethambutol and Pyrazinamide, INH resistant or intolerant58.
• Study 23 is a non randomized, open label, single arm, prospective study to treat
HIV-Related Tuberculosis and to determine the rate of confirmed treatment failure and
relapse with an intermittent rifabutin-based regimen for the treatment of Isoniazid and
Rifamycin-susceptible HIV-related tuberculosis54, 71.
• Study 22 is an open label, randomized controlled trial to compare, at completion of
the follow-up phase, the clinical and bacteriologic relapse rates associated with the
two study regimens- Once-Weekly Rifapentine and Isoniazid compared to
Studies 23, 27, 28, and 29 enrolled patients at the beginning of intensive
phase treatment. Studies 22 and 25 enrolled patients at the beginning of
continuation phase treatment, after approximately 2 months of TB therapy. Study
24 enrolled patients after a period of up to approximately 2 months on pre-study TB
17 3.1 Data Sources and Study Population
The data for this analysis were provided by the Tuberculosis Trials
Consortium (TBTC), CDC. TBTC conducts programmatically relevant clinical
trials, partnering with US and international clinical sites to expand the current
clinical and epidemiologic knowledge of TB and enhance the scope for diagnosis,
clinical management, and prevention of tuberculosis infection and disease. Data for
this analysis were collected over nearly two decades (1993-2011), gathered from 7
clinical trials. Many variables, methods of data collection differ among these
studies.
3.2 Objectives:
The objectives of this analysis are four-fold for each study (22, 23, 24,
25, 27, 28 and 29)
1. Measure the amount of discordance between the DST results done at CDC
Mycobacteriology laboratory and local site laboratories.
2. Compute discordance by drug type, drug testing concentration and study sites.
3. Calculate the Kappa values, the statistic to measure inter rater agreement for
4. Evaluate the sensitivity and specificity of the local laboratory DST results
considering CDC results as the ‘gold’ standard.
5. Determine how much drug resistant MTB exists among the patients entering
TBTC studies (22, 23, 24, 25, 27, 28 and 29) as most studies assume a pan
sensitive population. (The notable exception is Study 24, for which resistance
to INH was one possible entry criterion.)
3.3 Hypothesis:
For each study, DST results of the CDC Mycobacteriology lab do not differ
from DST results of public health labs at local TBTC sites.
3.4 Study Design:
All clinical trials conducted by the TBTC have been approved by the
institutional review boards of CDC and each clinical site. Patients give written informed
consent before being enrolled into these studies. TBTC, CDC provided this previously
collected data for secondary analysis free of identifiers. The IRB at Georgia State
University approved this analysis (Appendix A).
3.4.1 Common Methodology for all studies for Secondary data analysis:
All analysis was done using SAS 9.2 version (The SAS Institute, Cary, NC).
Each study ID corresponds to a single participant in that study. All study ids without
excluded from the analysis. DST results for other antibiotics such as Amikacin which
were only tested at the CDC Mycobacteriology lab were not considered for analysis.
After merging the CDC and the local DST results dataset, the records meeting
the above criteria were considered for further cleaning. Nevertheless there were a few
study IDs which were present more than once. This might be due to the reasons such as
the initial culture being non viable, culture contamination (after which the site resubmits
the isolate) or absence of Mtb growth on susceptibility testing medium. In such a
scenario, the condition used to pick the right record was matching the variables
‘date_collected’ (from CDC ) and ‘specdate’(from local labs). These two fields
‘date_collected’ and ‘specdate’ as discussed above come from two different datasets-
CDC and local respectively and both the dates indicate when the specimen was collected
and hence are comparable. Multiple DST results for the same patient exist due to various
reasons such as culture being contaminated or failing in grow, repetition of lab tests to
confirm drug resistance, isolates that are not collected at baseline etc. Since one of the
objectives of the analysis is to capture how much drug resistance exists in the general TB
population by measuring drug resistance when patients first enroll in the study (Baseline
isolates- isolate collected at the time of enrollment), it is imperative to pick the baseline
DST results for the analysis and not include any acquired drug resistance results which
might sometimes lead to additional discordance. If repetition of lab tests to confirm drug
resistance was identified (‘date_collected’ -period is within few months or looking at
comments section: ‘resend specimen’) the record that have earliest concordant DST
Further when the above criteria were met when duplicates and triplicates
persisted, checking the ‘comments’ field in CDC dataset for information regarding
culture contamination, isolate resubmission and other factors helped in picking the right
record. Thus the final cleaned dataset was created for each study based on all the above
criteria and these datasets was used for not only determining the levels of discordance
between the two DST results but also to answer all the questions listed in the objectives
of the analysis.
3.4.2 Kappa Statistic Analysis:
3.4.2.1 Background
Kappa statistic, the most commonly used statistic to measure the agreement
between two or more observers takes into account that observers may agree or disagree
just by chance. If a kappa value is 1, it indicates perfect agreement while a kappa value of
0 indicates agreement equal to chance. One of the limitations of Kappa statistic is that it
is dependent on the prevalence of the condition being tested. Precision (agreement
between observers) is reported using kappa statistic 61. This statistic is used in situations
where two or more observers are calculating the same thing- CDC lab DST results and
Local lab DST results as in this case. The formula for calculation is the based on
observed agreement and expected agreement (expected due to chance alone). Observed
agreement (P0) being the ratio of results where both the labs agreed (a+d) to the total
number of results (N) where (a) and (d) represent the number of times the raters agree,
(b) and (c) represent the number of times the raters disagree. If N1 is the sum of (a) and
(d), then expected agreement (PE) is given by the formula- [((N1/ N)*(M1/ N)) + ((N0/
N)*(M0/ N))]. Finally, kappa is calculated as the ratio of (P0 - PE) and (1- PE) 62.
3.4.2.1 Kappa analysis specifically for DST data analysis:
Kappa statistic was calculated for each antibiotic (Isoniazid (0.2µg/ml),
Isoniazid (1 µg/ml), Rifampin (1µ g/ml), Ethambutol (5µ g/ml), Pyrazinamide (100µ g/ml),
Streptomycin (2µg/ml) in each study (22, 23, 24, 25, 27, 28, and 29) using proc freq-
kappa procedure in SAS 9.2.
3.4.3 Sensitivity, Specificity and PPV (Positive Predictive Value) analysis:
For each antibiotic, sensitivity and specificity of the local lab DST results
were measured by first counting the number of true positives, false positives, true
negatives and false negatives. True positives are those results that tested positive
(resistant) and were truly positive (resistant) in CDC lab test results. False Positives are
those that tested positive (resistant) in local lab but tested negative (susceptible) in CDC
lab. True negatives are those that tested negative (susceptible) in local lab test and were
truly negative (susceptible) in CDC lab results. False Negatives are those that tested
negative (susceptible) in local lab test but were positive (resistant) in CDC lab results.
Sensitivity, the statistical measure signifying the proportion of true positives (antibiotic
resistant specimens) correctly identified so, was calculated by using the following
formula: TP/(TP+FN) where TP represents the number of true positives and FN
represents the number of false negatives. Likewise, specificity represents the proportion
of true negatives (antibiotic sensitive specimens) correctly identified so is calculated as
TN/(TN+FP). Positive predictive value which is the ratio of True Positives (TP) and the
testing positive for resistant MTB) is the probability that the patient has drug resistant TB
when restricted to those patients who test positive (resistant) in local lab results. PPV was
calculated for each antibiotic in each study.
3.4.3 Discordance between the two lab test results is the sum of false positives and false
negatives.
After measuring the total discordance, discordance by local lab site for
each study was measured as the sum of false positive and false negatives. Baseline drug
resistant MTB among the patients entering these clinical trial studies (22, 23, 24, 25, 27,
28 and 29) was measured as the ratio of number of resistant isolates for each study (per
antibiotic) measured by both labs-CDC and local and the total number of specimens
tested for that antibiotic. Discordance is calculated by considering individual DST results
independently. In other words, there could be multiple discordances for a single isolate
but each of the discordances is counted independently by drug tested. Similar procedure
was followed for all other studies with a few differences in variable names and this will
be discussed in sections below.
3.5 Methodology for each study specifically and variables analyzed:
3.5.1 Study 29: (Rifapentine substituted for Rifampin)
Variables analyzed:
CDC lab results-Variable Name
Comparable-Local lab results-Variable name
Label
is unique for each patient
DATE_COLLECTED SPEC_DATE Date when the specimen was collected at site
DATE_RECEIVED Date when the specimen
was received at CDC
DATE_SENT Date when the specimen
was sent to CDC
RIFAMPIN_1 RIF Rifampin-1µg/ml
STREPTOMYCIN_2 SM Streptomycin-2µ g/ml
ISONIAZID_0_2 INH_02 Isoniazid-0.2µg/ml
ISONIAZID_1 INH_1 Isoniazid-1µg/ml
PYRAZINAMIDE_100 PZA Pyrazinamide-100µ g/ml
ETHAMBUTOL_5 ETH Ethambutol-5µ g/ml
The CDC and local datasets had 402 and 473 records respectively. After
merging the CDC and the local DST results dataset by study id and taking only the ones
that have DST results in both there were 359 records. After duplicate records were further
cleaned by using criteria mentioned and information in the comments section there were
333 records in the final data set (as there were several duplicates and triplicates) and this
dataset was used to address the objectives. Sensitivity and specificity and discordance
were calculated as per the procedure mentioned in 3.d.2 and 3.d.3 respectively
3.5.2 Study 28 (Moxifloxacin substituted for INH):
The variables analyzed were similar to that of Study 29. The CDC and local
results dataset the 435 records meeting the criteria mentioned in 3.4.1. After duplicate
records were further cleaned by using criteria mentioned and information in the
comments section there were 342 records in the final data set and this dataset was used to
address the objectives. Sensitivity and specificity and discordance were calculated as per
the procedure mentioned in 3.4.2 and 3.4.3 respectively.
3.5.3 Study 27 (Moxifloxacin substituted for Ethambutol):
Variables analyzed:
CDC lab results-Variable Name
Comparable-Local lab results-Variable name
Label
LAST_NAME STUDY_ID Study ID number which is unique for each patient
DATE_RECEI Date when the specimen
was received at CDC
SPECIMEN_T Date when the specimen
was sent to CDC
RIF_1 RIF Rifampin-1µ g/ml
SM_2 SM Streptomycin-2µg/ml
INH_02 INH_02 Isoniazid-0.2µ g/ml
INH_1 INH_1 Isoniazid-1µ g/ml
BACTEC_PZA PZA Pyrazinamide-100µg/ml
ETHAMBUTOL_5 ETH Ethambutol-5µg/ml
The CDC and local datasets had 374 and 323 records respectively. Merging the
CDC and the local DST results dataset records after crosschecking whether they meet the
with duplicates. After removing the duplicates, the final cleaned dataset had 321 records
and this was used for Sensitivity and specificity and discordance analysis as per the
procedure mentioned in 3.4.2 and 3.4.3.
3.5.4 Study 25 (tolerability- 600, 900, 1200 mg Rifapentine):
The variables analyzed for this study were exactly similar to that of study 27
(Except- variable for PZA in CDC dataset was PZA_25). The CDC and local datasets
had 158 and 150 records respectively. The merged dataset had 149 records. The final
cleaned datasets after merging had 135 records meeting the criteria mentioned in 3.4.1.
The records with comments regarding culture contamination and other culture
non-viability were removed. Also the records which seemingly showed discordance but where
the comments section had additional information about the results being pending were
removed from the analysis. Also 2 records that seemingly showed Pyrazinamide (PZA)
discordance but the comment had information that though the results show resistance the
cultures were sensitive on another medium were removed as this cannot be considered as
discordance as there is information about the true drug susceptibility of the culture.
There was one duplicate and one record with culture contamination –both excluded from
the final analysis. So the cleaned dataset had 135 records and this was used for Sensitivity
and specificity and discordance analysis as per the procedure mentioned in 3.4.2 and
3.4.3.
3.5.5 Study 24 (Alternate regimen for INH intolerant or resistant patients):
The variables analyzed for this study are exactly similar to that of Study 27
in the CDC and local datasets respectively. The merged dataset had 50 records. There
were 4 duplicates. Then the records were cleaned as per the criteria mentioned in 3.4.1
and the final dataset had 43 records after removing the duplicates. This dataset was used
for Sensitivity and specificity and discordance analysis as per the procedure mentioned in
3.4.2 and 3.4.3.
3.5.6 Study 23 (treatment of Isoniazid and Rifamycin-susceptible HIV-related
tuberculosis):
The variables analyzed for this study are exactly similar to that of Study 27
(Except- variable for PZA in CDC dataset was PZA_25). There were 191 and 168
records in the CDC and local datasets respectively. The merged dataset had 172 records.
There were 15 patient IDs with duplicates. When there were multiple records for the
same ID, the one that had ‘Final Report’ in comments section were picked. Then the
records were cleaned as per the criteria mentioned in 3.4.1 and the final dataset had 142
records after making sure there is no redundancy. . This dataset was used for Sensitivity
and specificity and discordance analysis as per the procedure mentioned in 3.4.2 and
3.4.3.
3.5.7 Study 22 (once weekly Rifapentine INH in continuation phase):
The variables analyzed for this study are exactly similar to that of Study 27 (Except-
variable for PZA in CDC dataset was PZA_25). There were 1416 and 311 records in the
CDC and local datasets respectively. The merged dataset had 487 records. There were
field ‘date recei’ such that DST results of the valid isolate were picked for the analysis.
Then the records were cleaned as per the criteria mentioned in 3.4.1 and the final dataset
had 303 records after making sure there is no redundancy. For Pyrazinamide, a new
dataset was created from the final dataset as there were a few records with a null value in
CDC- DST results for PZA. This new dataset used for PZA alone (271 records) served a
dual purpose - the records with null values in CDC lab-DST results are not picked up as
discordance and also other antibiotic related DST results are not lost due to exclusion
from the analysis. These datasets were used for Sensitivity and specificity and
28
This section describes the answers to the research questions in detail.
4.1 Discordance analysis:
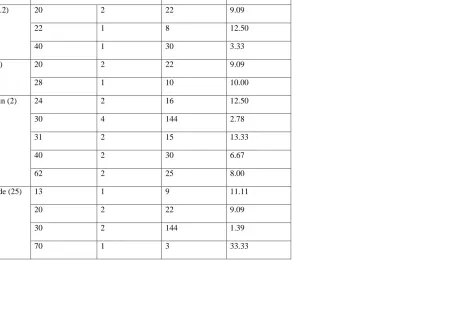
4.1.1 STUDY 29:
The total number of records included in the analysis was 333 (Figure 1). Very good inter
rater agreement (high kappa value) was found for INH and RIF (Table 14). Due to the
high number of false negatives for Pyrazinamide (PZA), Ethambutol (EMB) and
Streptomycin (SM), the sensitivity was very low. No discordance was observed for
Rifampin (RIF) leading to 100% sensitivity, specificity and Positive predictive value.
Drug resistant population at baseline (%) was calculated as the ratio of number of true
positives and total number of records analyzed multiplied by hundred to understand the
drug resistance pattern in patients enrolling into these studies. The drug resistance at
baseline in Isoniazid (both concentrations-especially (1µ g/ml)) was found to be high
(8.25% and 11.34% respectively) (Table 1).
Discordance between the two labs for each antibiotic was also categorized by site to
identify frequent discordances so that appropriate recommendations for local lab resource
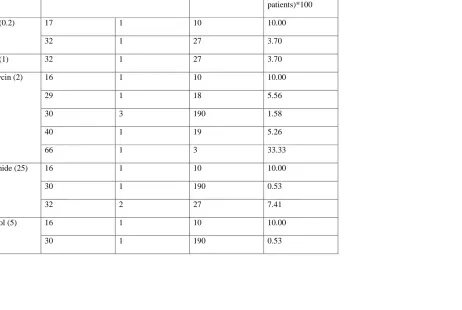
4.1.2 STUDY 28: The total number of records included in the analysis was 342 (Figure
2). High Kappa values were found for INH and RIF (Table 15). Low sensitivity was
observed for PZA whereas high specificity was documented for INH (both
concentrations) and Rifampin. Drug resistant population at baseline (%) was calculated as
per above discussion in Study 29 results and highest was found in INH (1µg/ml).
Discordance between the two labs for each antibiotic was also categorized by site (Table
9).
4.1.3 STUDY 27: The total number of records included in the analysis was 321 (Figure
3). ETH and SM had very high kappa values (Table 16). Ethambutol (ETH) had 100%
sensitivity, specificity and positive predictive value (PPV) whereas INH (1µ g/ml) and
SM had high specificity and PPV. INH (0.2µ g/ml) had low sensitivity (Table 3). There
were no PZA DST results in CDC dataset. Drug resistant population at baseline (%) was
calculated as per above discussion in Study 29 results and it was highest in INH
(0.2µg/ml) - 10.31% when compared to all other antibiotics. Discordance between the
two labs for each antibiotic was also categorized by site. Site 30 had 10 discordances
(INH (0.2 µg/ml) alone) given the higher N (total patients tested) value after comparing
the results with the gold standard- CDC (Table 9).
4.1.4 STUDY 25: The total number of records included in the analysis was 135 (Figure
4). The fewer number of records in the final dataset compared to other studies might
explain the low drug resistance found in this study-25 (Table 3). Discordance between the
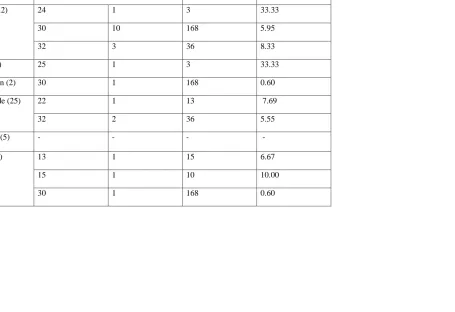
4.1.5 STUDY 24: The total number of records included in the analysis was 43 (Figure 5).
High Kappa value was found for INH (1µg/ml) (Table 18). Drug resistant population at
baseline (%) was found to be very high for INH (75.76% and 40.74% for both
concentrations) which is reasonable as the requirement to be a part of this study is INH
resistance or intolerance (Table 4). Discordance between the two labs for each antibiotic
was also categorized by site (Table 10).
4.1.6 STUDY 23: The total number of records included in the analysis was 142 (Figure
5). High kappa statistic was found for INH (0.2µg/ml), INH (1µ g/ml) and PZA (Table
19). Sensitivity was particularly low for Streptomycin (SM) whereas specificity was
almost 100% for all antibiotics (Table 5). Higher PZA resistance at baseline (around
13%) was found in this study. Discordance between the two labs for each antibiotic was
also categorized by site (Table 11).
4.1.7 STUDY 22: The total number of records included in the analysis for PZA were 271
where as for all the other antibiotics - 303 (Figure 7). There were no local lab results for
INH (1µ g/ml). The two lab DST results agreed less than would be expected just by
chance alone for PZA and ETH and overall the Kappa values were lower when compared
to other studies (Table 20). Sensitivity was low for INH (0.2µg/ml), SM and RIF. PPV
and specificity were 100% for INH (0.2µg/ml) (Table 7). SM had the highest drug
resistance at baseline (around 6%). Discordance between the two labs for each antibiotic
was also categorized by site (Table 14).
Overall statistics (Table 22) indicate a total discordance percentage of 7.786% (N=1708)
look indicates lowest kappa value for study 22 (0.2216) and highest agreement for study
23 (0.8497). Though it might not be appropriate to calculate average values (across all
studies) for kappa, sensitivity, specificity, PPV and discordance due to several reasons
mentioned in Discussion section, the calculations were done only to indicate overall
values. High specificity (97.75) and low sensitivity (70.24) were found overall. Average
positive predictive value across all studies was 77.96%.
Box Plots for Kappa statistic and Positive predictive values across studies (Figures 3 and
4):
All kappa values that are zero or undefined were excluded from the box plots
for Positive predictive values and kappa statistics. Especially in the case of Kappa
statistic- a calculated value of zero resulted as no drug resistance was observed for that
antibiotic in that study. So it actually means perfect agreement even though the kappa
value is zero.
The median for kappa statistic were mostly closer across different studies even
though the range was large. For study 22- there were no local lab results for Isoniazid
(INH) at 1 µ g/ml concentration. Also there were negative kappa values for 2 antibiotics.
In all the studies clumping of lower values is seen (especially study 24 and 27).
A Box plot for positive predictive values (for each antibiotic) across studies was
drawn. In case of no drug resistance for a particular antibiotic, the positive predictive
value is not defined. These cases were excluded for drawing the box plot. Most often the
found except in streptomycin, so the box plot is entirely based on the values from
Streptomycin.
32
5.1. Discussion
There are numerous striking variations in the objective of each clinical trial,
the clinical disease status of participants (though all have active TB – some have
pulmonary, extra pulmonary, HIV, cavitation, etc), participating sites (some changed
over time), number of patients enrolled at each site, number of patients enrolled in each
study, number, concentration of antibiotics tested for drug susceptibility, and test method
at each site and in each study.
Also the long time span between the earliest and the later studies
(1997-2010) creates variability in the emphasis placed on DST, pursuing local sites to resend
specimens in case cultures are contaminated or failed to grow, the resources available for
DST and sophistication of methods used for testing.
Merely combining the results of all studies and calculating pooled values
without paying attention to the variations will be inappropriate. However, among all
studies DST results are compared between a local lab and CDC lab for paired isolates
from each patient. Therefore, merging the results just to get an overall picture of trends
over time by site was helpful to make appropriate recommendations. Nevertheless, all
these variations need to be considered while examining the results.
The isolates sent to CDC laboratory are subcultures of the original culture used for local
lab tests. This might influence the capacity to identify low level resistance at CDC lab.
Another factor that might influence discordance is the lack of indication of partial drug
resistance at the local lab. Local lab DST results only indicate whether the isolate is
resistant or susceptible unlike the CDC lab where drug resistance is expressed as
percentage. For this analysis, any percentage drug resistance above 0 at CDC lab was
considered as ‘resistant’.
The eligibility criteria for each study vary and this has significant impact on
the various measures computed. Patients in Study 29, 28 and 27 are enrolled prior to
being tested for drug resistance during intensive phase therapy. Patients in study 24 are
known to be infected with M. tuberculosis resistant to Isoniazid (primary) or are
intolerant to INH at the time of enrollment. Patients in study 23 are HIV seropositive
adults with positive cultures for TB, known to be susceptible to INH and Rifampin at
enrollment. Patients in study 22 were tested in the continuation phase of therapy, having
been eligible to enroll with a baseline isolate susceptible to INH and Rifamycin. Thus,
Drug-resistance rates between studies are partly attributable to differences in study
design. Studies that enrolled later in the course of TB therapy would be expected to find
lower rates of drug resistance, since patients with drug resistance would more likely have
been discovered and excluded from the study, except for Study 24, which had higher
rates of INH-resistance by design. DST can take a month or two in the laboratory, due to
the slow growth of MTB in culture.
The current global drug resistance percentages for Isoniazid are 6·7%
resistance, 1994-1997, primary drug resistance to Isoniazid (7.3 percent) or streptomycin
(6.5 percent) was more common than resistance to Rifampin (1.8 percent) or Ethambutol
(1.0 percent) 64. Similar trend was observed in all studies (except study 23). For Study 24,
the baseline drug resistance for INH and SM was very high compared to other TBTC
studies. This is expected as being INH intolerant or INH resistant is one of the inclusion
criteria.
Discordance rates for Study 27, 28 and 29 (tested after enrollment-
resistance at enrollment is not known) were not unusually different from the other studies
(Studies 22, 23 and 25 – DST results known at enrollment) (Table 22). However,
employing rapid tests for determining drug resistance prior to initiating treatment at sites
where rates of drug resistance is high would be beneficial. Such screening would avoid
starting patients on sub optimal treatment regimens, who are later found to have baseline
drug resistant TB.
Though overall statistics for kappa, sensitivity, specificity, Positive
predictive value and discordance % have been calculated for all studies combined, results
should be interpreted with caution due to all the mentioned variations. Box plot for kappa
statistic across studies was done. There was skewed distribution in all studies and it might
be concluded that with time the concordance between the two lab results improved for the
most part based on the distribution of kappa values.
5.2 Limitations of the Study:
• Considering each antibiotic DST results for single patient independently might be a
problem especially if discordance exists in several antibiotic DST results for the same
• Due to the variable number of patients at each site and in each study, it is difficult to
give equal value for their results.
• The time span between the earliest and latest studies is around 11 years which might
have impact in the sophistication of methods used, resources available, the emphasis
on the importance of DST results
• Some local sites did not test certain antibiotics (or certain antibiotics at different
concentrations) which resulted in an irregular distribution of sites testing the
antibiotics and these were excluded from the analysis. Thus the total number of
records will not reflect the number of valid unique DST results. These variations need
to be considered while interpreting the results.
• In this analysis discordance was not measured by DST method, which might play a
role in outcome of DST.
• Kappa statistic is influenced by base rates of diagnosis and might not be appropriate
to compare across studies with different base rates.
5.3 Recommendations
Timely detection of drug resistance in patients is most important to prevent
a worldwide epidemic of incurable multidrug resistant tuberculosis even though rarity
of resistance is the rule, for now. Most often, underestimation of the problem rather
than affordability is currently paralyzing laboratory services to detect resistance.
Since the currently available methods are all laboratory based, it is understandable
that at least for the next few years, avoiding lab based methods is not possible.
resistance based methods) are in use. The minimum inhibitory concentration ranges
(MIC s) or critical concentration ranges (between resistant and susceptible strains)
vary for each drug and the gap (range) indicates whether the lab based test is reliable
for that antibiotic. Drugs such as Isoniazid (INH) and rifampin (RIF) have wide gap
between the highest MIC s for susceptible strains and lowest MIC s for resistant
strains, thus improving the reliability of the DST results55. Literature shows that for
drugs such as Ethambutol (ETH) the difference is narrow and this might give rise to a
number of false positives and false negatives56.
There are several rapid and sensitive genotypic methods also but their
affordability is the issue of concern. Though the current results show few DST
results discordances between local and CDC labs, it is better to continue to send
isolates to the centralized lab (CDC) (even though it means more investment) in
view of the worldwide threat of drug resistant TB epidemic, the recommendations
of the current literature 51, 56 and the benefits of reliable confirmatory testing
services and availability of other molecular diagnostic methods. The key role that
local laboratories play by providing timely DST reporting to clinicians, which is
critical for tailoring effective drug regimens to treat patients is also recognized.
5.4 Conclusion
Though the current results show few DST result discordances between local and
CDC labs, it is better to continue to send isolates to the centralized lab (CDC) in
of the current literature and the benefits of reliable confirmatory testing services and
REFERENCES
1. Glaziou, P. , Floyd, K. , & Raviglione, M. (2009). Global burden and epidemiology
of tuberculosis. Clinics in Chest Medicine, 30(4), 621-62+.
2. Global tuberculosis control: Key findings from the December 2009 who report.
(2010). Weekly Epidemiological Record, 85(9), 69-79.
3. WHO. Global Tuberculosis Control 2009 – Epidemiology, Strategy, Financing;
March 2009.
4. WHO region definitions:
www.who.int/whr/2004/annex/topic/en/annex_member_en.pdf.
5. Jagielski, T. , Augustynowa-Kopeć, E. , & Zwolska, Z. (2010). [Epidemiology of
tuberculosis: A global, European and polish perspective]. Wiad Lek, 63(3), 230.
6. Hill, P. , Jackson-Sillah, D. , Donkor, S. , Otu, J. , Adegbola, R. , et al. (2006). Risk
factors for pulmonary tuberculosis: A clinic-based case control study in the gambia.
BMC Public Health, 6(156).
7. Lonnroth, K. , Jaramillo, E. , Williams, B. , Dye, C. , & Raviglione, M. (2009).
Drivers of tuberculosis epidemics: The role of risk factors and social determinants.
Social Science & Medicine, 68(12), 2240-2246.
8. Haddad, M. , Wilson, T. , Ijaz, K. , Marks, S. , & Moore, M. (2005). Tuberculosis
and homelessness in the united states, 1994-2003. JAMA: Journal of the American
9. MacNeil, . , Lobato, M. , & Moore, M. (2005). An unanswered health disparity:
Tuberculosis among correctional inmates, 1993 through 2003. American Journal of
Public Health, 95(10), 1800-1805.
10. Story, A. , Murad, S. , Roberts, W. , Verheyen, M. , & Hayward, A. (2007).
Tuberculosis in London: The importance of homelessness, problem drug use and
prison. THORAX, 62(8), 667-671.
11. Steenland, K. , Levine, A. , Sieber, K. , Schulte, P. , & Aziz, D. (1997). Incidence
of tuberculosis infection among New York state prison employees. American
Journal of Public Health, 87(12), 2012-2014.
12. Myers, W. , Westenhouse, J. , Flood, J. , & Riley, L. (2006). An ecological study of
tuberculosis transmission in california. American Journal of Public Health, 96(4),
685-690
13. World Health Organization (2005). Addressing poverty in tb control: Options for
national tb control programmes. Addressing Poverty in TB Control: Options for
National TB Control Programmes, 80.
14. Corbett, E. , Watt, C. , Walker, N. , Maher, D. , Williams, B. , et al. (2003). The
growing burden of tuberculosis: Global trends and interactions with the hiv
epidemic. Archives of Internal Medicine, 163(9), 1009-1021.
15. UNAIDS. Frequently asked questions about Tuberculosis and HIV;
http://data.unaids.org/pub/factsheet/2006/tb_hiv_qa.pdf.
17. Spence, D., Hotchkiss, J. , Williams, C. , & Davies, P. (1993). Tuberculosis and
poverty. British Medical Journal (Clinical Research Edition), 307(6907), 759-761.
18. Golden, M. , & Vikram, H. (2005). Extrapulmonary tuberculosis: An overview. Am
Fam Physician, 72(9), 1761.
19. Organization, W.H., Tuberculosis: Fact sheet 2007. Available from:
http://who.int/mediacentre/factsheets/fs104/en/index.html.
20.
http://www.familiesusa.org/issues/global-health/infectious-tropical-diseases/tuberculosis.pdf
21. Herzog, H., History of Tuberculosis. Respiration, 1998.65(1):p. 5-15
22. Wallace, R.B. (2008). Public Health and Preventative medicine Fifteenth edition.
WA: Mc.Graw Hill
23. Daniel, T. (2006). The history of tuberculosis. Respir Med, 100(11), 1862
24. Styblo, K. , & Enarson, D. (1991). Epidemiology of tuberculosis. Selected Papers of
the Royal Netherlands Tuberculosis Association, 24, 136.
25. World Health Organization (2004). Global tuberculosis control: Surveillance,
planning, financing. Global Tuberculosis Control: Surveillance, Planning,
Financing.
26. Laserson, K. , Thorpe, L. , Leimane, V. , Weyer, K. , Mitnick, C. , et al. (2005).
Speaking the same language: Treatment outcome definitions for multidrug-resistant
tuberculosis. International Journal of Tuberculosis and Lung Disease, 9(6), 640-645
27. Nathanson, E. , Lambregts-van Weezenbeek, C. , Rich, M. , Gupta, R. , Bayona, J. ,
et al. (2006). Multidrug-resistant tuberculosis management in resource-limited