www.hydrol-earth-syst-sci.net/20/359/2016/ doi:10.5194/hess-20-359-2016
© Author(s) 2016. CC Attribution 3.0 License.
Estimation of deep infiltration in unsaturated limestone
environments using cave lidar and drip count data
K. Mahmud1, G. Mariethoz2, A. Baker1, P. C. Treble3, M. Markowska1,3, and E. McGuire4 1Connected Waters Initiative Research Centre, UNSW Australia, Sydney, Australia
2Institute of Earth Surface Dynamics, University of Lausanne, Lausanne, Switzerland
3Institute for Environmental Research, Australian Nuclear Science and Technology Organisation, Lucas Heights, Sydney, Australia
4Department of Parks and Wildlife, Busselton, WA, Australia
Correspondence to: K. Mahmud ([email protected])
Received: 12 August 2015 – Published in Hydrol. Earth Syst. Sci. Discuss.: 2 September 2015 Accepted: 30 November 2015 – Published: 20 January 2016
Abstract. Limestone aeolianites constitute karstic aquifers covering much of the western and southern Australian coastal fringe. They are a key groundwater resource for a range of industries such as winery and tourism, and pro-vide important ecosystem services such as habitat for stygo-fauna. Moreover, recharge estimation is important for under-standing the water cycle, for contaminant transport, for water management, and for stalagmite-based paleoclimate recon-structions. Caves offer a natural inception point to observe both the long-term groundwater recharge and the preferen-tial movement of water through the unsaturated zone of such limestone. With the availability of automated drip rate log-ging systems and remote sensing techniques, it is now pos-sible to deploy the combination of these methods for larger-scale studies of infiltration processes within a cave. In this study, we utilize a spatial survey of automated cave drip monitoring in two large chambers of Golgotha Cave, south-western Western Australia (SWWA), with the aim of better understanding infiltration water movement and the relation-ship between infiltration, stalactite morphology, and unsat-urated zone recharge. By applying morphological analysis of ceiling features from Terrestrial LiDAR (T-LiDAR) data, coupled with drip time series and climate data from 2012 to 2014, we demonstrate the nature of the relationships be-tween infiltration through fractures in the limestone and un-saturated zone recharge. Similarities between drip rate time series are interpreted in terms of flow patterns, cave cham-ber morphology, and lithology. Moreover, we develop a new technique to estimate recharge in large-scale caves, engaging
flow classification to determine the cave ceiling area covered by each flow category and drip data for the entire observa-tion period, to calculate the total volume of cave discharge. This new technique can be applied to other cave sites to iden-tify highly focussed areas of recharge and can help to better estimate the total recharge volume.
1 Introduction
Recharge estimation is critical for understanding the water cycle and contaminant transport, and for water management. However, monitoring water in the unsaturated zone, espe-cially in highly heterogeneous limestone formations, is diffi-cult, and estimating recharge is one of the most complicated tasks in the hydrological cycle (Scanlon, 2013). Continuous water content measurement using time domain reflectometry (TDR) (Rimon et al., 2007; Dahan et al., 2007) or neutron activation (Koons and Helmke, 1978; Sophocleous, 1991) allow point study on the unsaturated zone water infiltration rate. Tracers such as fluorescent dyes and environmental iso-topes in the unsaturated zone at many sites showed an or-der of magnitude range in recharge rates over 7–70 m yr−1 (Sheffer et al., 2011). This has been attributed to different flow systems (quick flow and slow flow), arid versus hu-mid climate forcing, and variations in storage in the soil and epikarst, e.g. Mendip Hills, England (Friederich and Smart, 1982), Israel (Even et al., 1986), Niaux, France (Bakalow-icz and Jusserand, 1987), Pennine karst, England (Bottrell and Atkinson, 1992), Slovenia (Kogovšek, 1997), and Mt Carmel, Israel (Arbel et al., 2008).
At the scale of cave drip waters, studies in geologically old, fractured limestone (that has undergone past diagenesis) have identified the importance of fracture flow and storage in solutionally enhanced fractures or caves. Matrix storage is also possible in geologically young limestone that has not un-dergone past diagenesis and contains primary porosity. Cave drip waters are fed directly from the karst bedrock and over-lying soil (White, 2002; Tooth and Fairchild, 2003; Atkinson, 1977; Raesi and Karami, 1997; Ford and Williams, 2007), and variations in the size and orientation of fractures, to-gether with variable storage capacity, play fundamental roles in governing the response of a drip site to individual recharge events (Baker and Brunsdon, 2003). High secondary porosity is associated with the epikarst, a zone of heavily weathered carbonate rock, which may act as a water storage reservoir retarding flow and sustaining slow percolation through the unsaturated zone in rocks where karstification has occurred (Arbel et al., 2010; Williams, 1983).
Drip discharges have been categorized in terms of the type of flow process occurring between recharge water and drip water. One possibility is that the drip water is transported via direct delivery of recharge along preferential flow paths (e.g. fractures). Another one is piston flow, where stored wa-ter is expelled from pores and fissures by incoming infiltra-tion water (Baker et al., 2000; Tooth and Fairchild, 2003). A more refined understanding of karst infiltration has been achieved through the use of continuously recording (auto-mated) drip measurement devices, which are capable of re-solving fine temporal changes in drip rate (McDonald and Drysdale, 2007). Studies incorporating such measurements have increased our knowledge of seepage dynamics. For ex-ample, Markowska et al. (2015) classified five different drip types at Harrie Wood Cave in south-eastern Australia, sug-gesting the heterogeneous flow in the unsaturated zone due
to the nature of the karst architecture. Jex et al. (2012) clas-sified drip behaviour using high-resolution drip time series and employed multi-dimensional scaling (MDS) analyses to cluster the data accordingly. Studies using automated coun-ters have also discovered the role of atmospheric pressure on drip variation, and questioned the linearity of recharge– discharge response at various timescales (Genty and Deflan-dre, 1998; Baker and Brunsdon, 2003).
Caves offer a natural inception point to observe both the long-term recharge and the preferential movement of wa-ter through the unsaturated zone of such fractured bedrock by monitoring stalactite drip rates. With the availability of both new drip rate logging systems and remote sensing tech-niques, it is now possible to deploy the combination of these new measurement methods for larger-scale studies of many individual drips within a cave. The goal of this paper is to demonstrate the nature of the relationship between flow types classified by the morphological analysis of stalactites (Mah-mud et al., 2015) and drip time series characteristics. A spa-tial survey of automated cave drip monitoring in two large chambers of Golgotha Cave, south-western Western Aus-tralia (SWWA), is utilized to achieve this goal. Recharge into the cave is quantified based on the drip data, Terrestrial DAR (T-LiDAR) measurements and flow classification. Li-DAR is a word which combines “light” and “radar”, although the word LiDAR is thought by some to be an acronym for light detection and ranging. We estimate the water balance to develop a simple model describing the ground surface extent from which flow is focussed on the monitored cave ceiling area and the associated lateral flow within the Tamala lime-stone formation.
2 Site description
col-Figure 1. (a) SWWA map showing the coastal belt of dune cal-carenite (inset figure indicates the SWWA region). (b) Plan view of the Golgotha Cave map showing both chambers (green and blue marked areas) and T-LiDAR positions (red dots) (adapted from Mahmud et al., 2015). Chamber 1 contains sampling area 1 (T-LiDAR 1) and chamber 2 contains sampling area 2 (T-(T-LiDAR 2) of the drip water chemistry monitoring programme operating since 2005 (Treble et al., 2015, 2013).
lapse, but none above the study sites. Additionally, in cham-ber 2 there is evidence of solutional widening generally as-sociated with high-flow sites (Treble et al., 2013). The over-all land surface gradient above the cave site is calculated as ∼20 % using the topography map which has the cave outline properly registered on it. However, there is negligible surface runoff given the high permeability of the sand layer, with hydraulic conductivity ranging from 100 to 2000 m day−1 (Smith et al., 2012). Over several field campaigns, runoff has never been observed at the site. This indicates zero surface runoff and maximum potential for infiltration through this karstified limestone.
SWWA has a Mediterranean-type climate, with warm to hot, dry summers (mid-November to mid-February) and mild to cool, wet winters (mid-May to mid-August), as-sociated with the seasonal migration of the mid-latitude westerly winds. Rainfall recorded since 1926 at Forest Grove is 1136.8±184 mm annually (BoM, 2015) (34.07◦S, 115.10◦E, weather station number 9547, 5 km from the site; Fig. 1a). Typically, the highest rainfall starts in late autumn (May) and carries on during the entire Southern Hemisphere winter wet period (May–October) (median monthly rainfall is approx. 100 mm) (Fig. 2a). Mean maximum daily temper-atures range from 16◦C in July to 27◦C in February.
Mois-ture is delivered by troughs embedded in the westerly flow, but may be sourced from regions to the south-west or north-west of our site (Bates et al., 2008; Fischer and Treble, 2008). Recorded monthly rainfall conditions are shown in Fig. 2a, for hydrological years 2012, 2013, and 2014, starting from April when the water budget is close to zero. Each hydrolog-ical year has a similar pattern during the dry period, with months from October to April showing a water deficit or only a negligible amount of recharge (Fig. 2b). In contrast,
there is significant amount of excess water available to in-filtrate during the wet season. The hydrological year 2014 was rather dry, having 943.8 mm precipitation, far below the long-term annual mean precipitation (1141 mm). Year 2013 was relatively wet (1239.8 mm), whereas 2012 (1008.6 mm) was slightly below the long-term annual mean.
Cumulative water budgets are calculated using precipita-tion (P) and modelled evapotranspiration (ET) data from the Australian Water Availability Project (AWAP) (Raupach et al., 2009) in order to obtain the total infiltration in the karstic aquifer for each hydrological year. According to Raupach et al. (2009), the ET is modelled using the mathematical equa-tions of Priestley–Taylor (Smith et al., 2012). Monthly calcu-lated evapotranspiration is subtracted from the monthly rain-fall totals to determine the water budget (i.e.P−ET) shown in Fig. 2b. Potential infiltration is then calculated from all positive monthly water budgets (monthly excess water). The total sum of all monthly excess water for a hydrological year (from April to March the following year) gives the potential infiltration for that particular year. We calculate an average annual potential infiltration of 696.3 mm during 3 observed hydrological years, ranging from a minimum of 608.6 mm in 2014 to a maximum of 858.7 mm in 2013.
[image:3.612.51.290.65.199.2]Figure 2. (a) Box plot of monthly rainfall at the Golgotha Cave site. (b) Monthly water budget for 3 observed hydrological years.
whilst 2B is∼5 m from the wall and 2A is∼10 m from the wall.
3 Background on flow type classification
The literature suggests that karst hydrological flow proper-ties can be identified from the geometry of stalactites and other morphological features in relation to the cave ceiling (Fairchild and Baker, 2012). Based on this concept, Mah-mud et al. (2015) used T-LiDAR measurement to image a cave ceiling including individual stalactites. Statistical and morphological analyses of the point clouds produced by T-LiDAR were then used to categorize the ceiling features into different flow types. Through this methodology, the role of the type of water flow processes was analysed and a prelim-inary conceptual model was developed by studying the spa-tial distribution of a large population of stalactites and their geometric properties (length and aspect ratio) in three sites within the Golgotha Cave system.
Flow type classification based on LiDAR data
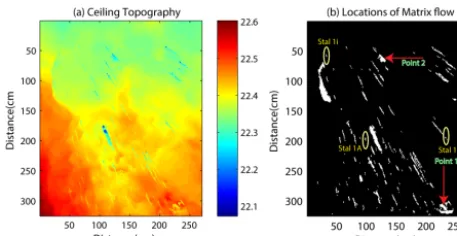
In this section we briefly describe the methodology that was used to investigate different flow patterns classified in Mah-mud et al. (2015). Based on the typical types of porosity and infiltration processes in karst, Mahmud et al. (2015) defined three categories of flow for the observed ceiling morphologi-cal features. These are matrix flow, fracture flow, and a com-bination of conduit, fracture, and matrix flow. The matrix flow category was further subdivided into two subclasses: soda-straw and icicle-shaped stalactites based on their geo-metric properties. The LiDAR-based morphological analysis was used to identify individual stalactites and flow classifica-tions (icicle, soda straw, fracture, and combined flow) based on the T-LiDAR point clouds. Figure 4a shows the topogra-phy (in 2-D) of a portion of the ceiling at site 1 classified into the different flow categories. The outcome of this
[image:4.612.129.470.67.229.2]Figure 3. Both monitored ceiling images from T-LiDAR with 34 identified stalactites feeding drip loggers, (a) chamber 1 and (b) chamber 2. Blue circles indicate locations of the ceiling under which the loggers are placed (indicated by red arrows). The blue arrows in both figures show the geographic orientation. These ceiling stalactite locations are identified based on both on-site field observation and the alignment analysis of drip loggers and stalactites (Sect. 4.2).
4 Data acquisition and methodology
We investigate the relationship between infiltration through the fractured limestone and cave drip water discharge using the morphological analysis of ceiling features, coupled with drip logger and climate data from 2012 to 2014. In this paper,
Figure 4. Morphological analysis of the cave ceiling portion con-sisting of sites 1A, 1B, and 1i used to identify different flow patterns (icicle, soda straw, fracture, and combined). (a) Cave ceiling topog-raphy in 2-D. Colour scales represent elevations in metres relative to the T-LiDAR receiver. Stalactites identified in (b) are all catego-rized as icicle flow pattern (Mahmud et al., 2015).
the total discharge over each studied area. The total discharge from each area is compared with infiltration estimates to bet-ter understand flow from the surface to the cave ceiling of the studied area.
4.1 T-LiDAR and elevation data
Ground-based T-LiDAR is a commonly used remote sensing technology that records high-resolution three-dimensional point clouds of the Earth’s surface, and its use in geol-ogy has been growing in recent years (Pringle et al., 2006; Fabuel-Perez et al., 2009; Rotevatn et al., 2009; Wilson et al., 2009). However, karstic model development using T-LiDAR is a novel application. There are few studies that discuss the benefits and the use of this tool, as well as the methods needed to work with this kind of technology (exceptions are Zlot and Bosse, 2014b, a, and Kaul et al., 2016). We have used a FARO Focus3D Terrestrial LiDAR to acquire three-dimensional geological images of the cave ceiling, which is capable of capturing millions of three-dimensional points co-ordinates within a few minutes. The reason we used LiDAR was that it allows us to determine the precise position of each ceiling stalactite and its size and shape, which is very difficult to obtain with photographs or with any other remote sensing technique. Moreover, to locate the ground coordinates of in-dividual drip loggers in the cave is also challenging, and a high accuracy is necessary to pair each logger with a sta-lactite. The advent of relatively low-cost LiDAR makes this study possible. The T-LiDAR measurements were taken ad-jacent to two locations where cave drip waters have been sampled for drip rate and chemistry for the past 10 years (2005–2014) (Treble et al., 2015, 2013). T-LiDAR positions 1 and 2 (Fig. 1) were selected such as to cover the significant portions of the ceiling from a perspective close to vertical in order to capture all 34 stalactites feeding the drip loggers, while minimizing the occlusion of other stalactites further
Figure 5. Morphological analysis of the cave ceiling portion con-sisting of sites 1ii, 1iii, and 1v to identify different flow patterns (icicle, soda straw, fracture, and combined). (a) Cave ceiling topog-raphy in 2-D. Colour scales represent elevations in metres relative to the T-LiDAR receiver. (b) Stalactites categorized as icicle flow pattern. (b) Stalactite 1v categorized as soda straw (Mahmud et al., 2015).
away from the scanner line-of-sight. Figure 3 shows scan im-ages for both chambers.
The elevation of the cave floor at the gate is 72 m a.s.l. ac-cording to GPS measurements. Elevations of the drip loggers inside the cave were obtained by a cave survey using a fibre surveyors tape as well as a SUUNTO tandem 360PC/360R clinometer to calculate dip and orientation (estimated error for dip is±1–2◦, and for orientation it is±5◦). A metal sur-veyors tape was used to measure distance (accuracy±0.1 m). Ceiling heights were surveyed from the T-LiDAR data that consist of both the drip logger sites and the ceiling features (i.e. stalactites). A detailed surface survey was performed to gain surface elevation and an estimate of the total thickness of overburden over the cave. A Bosch GLR225 Laser Dis-tance Measurer was also used to measure the disDis-tance be-tween points (accuracy±1.5 mm).
4.2 Alignment of drip loggers and stalactites
[image:6.612.311.548.67.184.2]Figure 6. Both chambers’ drip rate time series for the entire monitoring period. (a) Chamber 1 drip rates. Further classification of chamber 2 drip sites for effective visualization: (b) slow flow rates with drip frequency of less than 10 per 15 min, (c) medium discharges with drip frequency between 10 and 100 per 15 min, and (d) fast drip rates with more than 100 drips per 15 min.
4.3 Drip logger data
Automatic drip monitoring sites were established in Au-gust 2012. Stalagmate drip loggers (www.driptych.com) were installed throughout the two large chambers (Fig. 1). Data loggers were set to record the number of drops that fell on the logger per 15 min. Data were downloaded at regular intervals of 6 months, between August 2012 and March 2015, and data collection is ongoing.
Preliminary screening of all drip time series was per-formed for quality assurance. Based on the initial data screening, we entirely discard five drip sites, i.e. 1iv, 1vii, 1xii, 2ii, and 2xii. Drips 1iv, 2ii, and 2xii show sudden changes in drip rate that likely reflect the logger being ac-cidentally moved or misaligned after data downloads. Log-gers 1vii and 1xii were discarded due to the recording of dual drips or missing data. The remaining 29 sites are
con-sidered in this study, although parts of these time series were discarded where we considered the data unreliable. Data recorded during periods of known fieldwork were removed from the drip rate time series, including 1 day either side of recorded field trip days as standard protocol. Finally, the time series gaps are filled with synthetic data using spline in-terpolation of the drip data considering the drip statistics and correlation between drip rates.
con-trary, chamber 2 drip rates are more variable between sites (Fig. 6b–d). To clearly visualize the drip time series of cham-ber 2, we illustrate all these time series in three different plots based on their flow rates throughout the 3-year study period: (i) static drips with little discernible variation and very low flow rates (Fig. 6b), (ii) medium-variability drips with mod-erate discharges (Fig. 6c), and (iii) high-variability drips with high discharges (Fig. 6d). Each figure is scaled differently due to the differences in the magnitude of drip values. For easy identification of drip time series, we plot a few represen-tative time series rather than all drips in Fig. 6b. Comparing the slow dripping sites from both monitored chambers, we discover a persistent base flow component even during peri-ods of water deficit, which feeds storage water to the drip site. This indicates that the Tamala limestone formation does have significant storage within its matrix porosity to deliver unin-terrupted cave discharge during dry periods. These monitor-ing sites (Fig. 6) exhibit a near-constant drip rate, with little or no relationship with hydrologically effective precipitation, except for the response to the 2013 wet winter. Nonetheless, there is still considerable variation between these static drips in terms of base flow, magnitude of response, and attenua-tion. Records presented in Fig. 6a (particularly site 1viii) and Fig. 6b (most of the slow drip time series) have noisy data with high variation over a short period. When drip rates are of approximately the same frequency as the logging interval (15 min), drip variability increases and are an artefact of the sampling interval. This is observed at site 1viii and most of the slow drip sites from chamber 2. The observed variabil-ity is typical of that of previous studies using drip loggers. We presented the raw data that are not corrected for baro-metric pressure variations – barobaro-metric effects explain the drip variability over the time period of days to weeks, and have previously been observed in porous limestone (Genty and Deflandre, 1998).
4.4 Cave discharge estimation
[image:8.612.311.545.67.223.2]The infiltration through the limestone formation within the monitored areas of both chambers is estimated based on the drip data and the T-LiDAR measurements. We consider the drip data for the entire observation period to calcu-late the total drip counts for each logger and thus obtain the total cave-integrated drip water volume, considering 1 drip=0.1433 mL according to Genty and Deflandre (1998). We identify 29 individual stalactites that relate to the logger drip data we placed in two large chambers of this cave site. We then extrapolate these logger data to the entirety of both chambers to predict the total infiltration within these areas. This is a fundamental outcome of this study which is made possible by the combination of drip loggers and LiDAR tech-nology. The methodology does not include the area covered by each flow class; rather, it counts the total number of sta-lactites that fall into various flow categories. For example, in chamber 1 we find a total of 1909 individual stalactites in
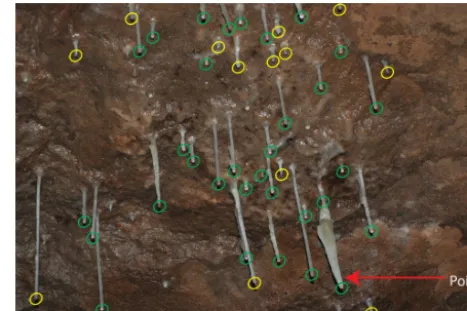
Figure 7. Actively dripping stalactite count. Green circles are sta-lactites identified as active in terms of dripping (displaying water droplets and/or white flash at their tip) and yellow ones are inactive. In this photo, 32 green circles and 13 yellow ones are counted.
Figure 8. Drip data characteristics for different flow classifications.
5 Data analysis and interpretation
5.1 Relation between LiDAR-based classification and drip data
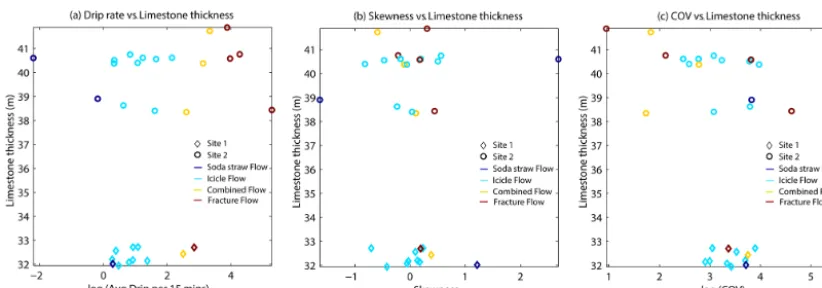
The LiDAR-based flow classification for individual sites is detailed in Tables 1 and 2. The average drip rates per 15 min, skewness, coefficient of variation (COV), and the elevations of cave ceiling at the location of the stalactites are also listed to compare various flow categories. Coefficient of variation (COV) is defined as the ratio of the standard deviation (σ )to the mean (µ). To build up the relationship between LiDAR-based flow classification and drip rates, drip logger mean discharge, skewness, and COV are plotted in Fig. 8 against the overburden limestone thickness above all drip sites (from 32.4 to 41.9 m). We observe no significant relationship be-tween the drip logger mean discharge, skewness, and COV with overburden thickness; however, these properties can be used to characterize different flow classes, and are discussed below in further detail.
All chamber 1 icicle flows have slow drips, i.e. less than five drips every 15 min (Table 1), the resulting mean dis-charges ranging from 6 to 20 L yr−1. Their drip rates remain almost constant throughout the study period (Fig. 6a). How-ever, it is evident that the drip loggers exhibit a clear response to the 2013 wet winter, with peak discharge at the end of September 2013 (Fig. 6a). Icicle drip discharges in cham-ber 2 show similar results, with slightly higher drip rates up to 8.5 drips per 15 min, discharging 42.7 L yr−1. All these icicle flow types display low values of skewness and inter-mediary variation (COV) within the time series (Fig. 8b and c).
Drip sites classified as soda straws (site 1v, 2iii, and 2xi) usually have very low discharges (less than two drips per 15 min). However, these drips have large skewness and variation (COV) (Tables 1, 2, and Fig. 8b). Among these soda-straw flows, site 2xi has the lowest mean discharge of 0.5 L yr−1and shows the largest variation (COV) within the time series (Table 2). Moreover, such soda-straw drips do not
exhibit constant discharge according to the drip time series (Fig. 6a and b), even though they have extremely low dis-charges.
Sites classified as combined flow type (1viii, 2E, 2v, and 2viii) have high discharges ranging from 12 to 28 drips per 15 min (60–140 L yr−1). In addition, these drips have a com-paratively extended range of skewness and COV (Fig. 8b and c). Lastly, sites 1x, 2i, 2vi, 2ix and 2xvi, character-ized as fracture flows according to the morphological anal-ysis, typically have the largest discharges (Fig. 8a). There is significant variability in discharge between these sites and within the individual time series (Fig. 6), evidenced by differences in mean discharge rates, skewness, and co-efficient of variation, e.g. mean discharge ranging from 90 to 2700 L yr−1. We observe rates of water movement rang-ing from 0.5 to 6.5 L yr−1 for soda-straw stalactites and up to 43 L yr−1 for icicle flow category, 60 to 140 L yr−1 for combined flow systems and 90 to 2700 L yr−1for frac-ture flow type. This finding is different to recent studies in Mt Carmel Cave in Israel, with higher cave discharges of 320 mm h−1≈2.8×10⁶L yr−1(Sheffer et al., 2011) and 1.9 to 3.5×10⁶L yr−1 (Arbel et al., 2010) for slow drip sites. The combined and fracture flow drip rates are also signifi-cantly lower compared to Mt Carmel Cave (2.8×10⁶L yr−1 for the intermediate flow to >10.5×10⁶L yr−1 for quick flow (Arbel et al., 2010; Sheffer et al., 2011)). However, our drip discharge variations agree with other studies across Aus-tralian cave sites (Cuthbert et al., 2014; Markowska et al., 2015; Treble et al., 2013; Jex et al., 2012).
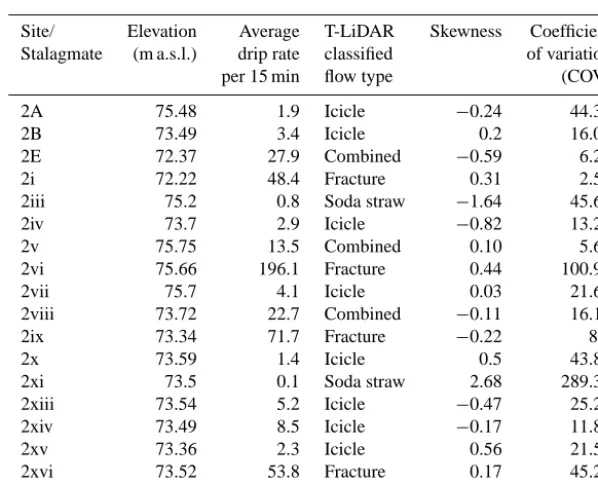
Table 1. Flow classification of chamber 1 drip data.
Site/ Elevation Average T-LiDAR Skewness Coefficient Stalagmate (m a.s.l.) drip rate classified of variation
per 15 min flow type (COV)
1A 77.46 4.0 Icicle 0.17 18.23
1B 77.424 2.5 Icicle −0.03 19.93
1i 77.4 1.3 Icicle 0.13 40.31
1ii 77.521 2.2 Icicle −0.06 28.09
1iii 77.655 1.2 Icicle −0.29 30.52
1v 77.585 1.3 Soda straw 1.21 40.83
1vi 77.036 1.5 Icicle 0.1 33.83
1viii 77.167 12.1 Combined 0.38 42.49
1ix 76.88 3.0 Icicle 0.23 21.01
1x 76.9 17.2 Fracture 0.19 28.88
1xi 76.885 2.5 Icicle −0.71 48.98
Table 2. Flow classification of chamber 2 drip data.
Site/ Elevation Average T-LiDAR Skewness Coefficient Stalagmate (m a.s.l.) drip rate classified of variation
per 15 min flow type (COV)
2A 75.48 1.9 Icicle −0.24 44.31
2B 73.49 3.4 Icicle 0.2 16.01
2E 72.37 27.9 Combined −0.59 6.21
2i 72.22 48.4 Fracture 0.31 2.57
2iii 75.2 0.8 Soda straw −1.64 45.62
2iv 73.7 2.9 Icicle −0.82 13.23
2v 75.75 13.5 Combined 0.10 5.65
2vi 75.66 196.1 Fracture 0.44 100.95
2vii 75.7 4.1 Icicle 0.03 21.63
2viii 73.72 22.7 Combined −0.11 16.11
2ix 73.34 71.7 Fracture −0.22 8.3
2x 73.59 1.4 Icicle 0.5 43.86
2xi 73.5 0.1 Soda straw 2.68 289.31
2xiii 73.54 5.2 Icicle −0.47 25.29
2xiv 73.49 8.5 Icicle −0.17 11.81
2xv 73.36 2.3 Icicle 0.56 21.57
2xvi 73.52 53.8 Fracture 0.17 45.28
2xvii 73.72 1.4 Icicle −0.06 53.08
and 1xi (with icicle flow characteristics and falling within the southern patch of chamber 1) do not indicate significant correlations, suggesting spatial dependence on the drip dis-charge. On the other hand, chamber 2 sites belonging to the fracture and combined flow categories show moderate to high positive correlation with each other, possibly being highly responsive to rainfall events (Fig. 9b). All icicle and soda-straw flow sites are correlated with each other in a similar fashion, except sites 2A and 2xiii, which are negatively cor-related with the rest of the drip discharges. These two sites show decreasing drip rates, while the rest of the sites from chamber 2 have increasing trends, suggesting flow-switching possibility at higher flows/heads.
5.2 Cave discharge
The total flux (Table 3) for each flow categoryiis obtained (i.e.Qicicle,Qfracture,Qcombined,Qsoda-straw)by multiplying the total number of active stalactite for each category (n)by the corresponding mean measured drip discharge for the cor-responding category (q):
[image:10.612.148.447.289.532.2]Figure 9. Correlation matrix for various drip sites with flow type classification for (a) chamber 1 and (b) chamber 2. Different flow types (I: icicle; F: fracture; C: combined; S: soda straw) characterized by the morphological analysis are shown in parentheses (leftyaxes and xaxes). Limestone thicknesses over the drip sites are on the rightyaxes. The colour scale indicates the correlation coefficient between drip time series.
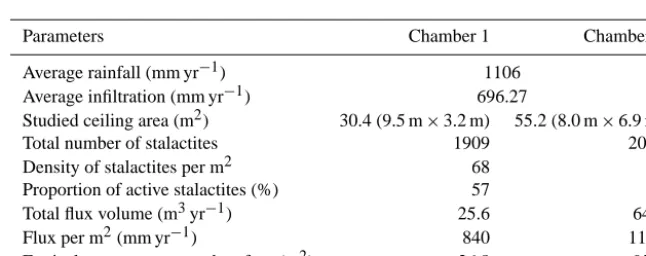
Table 3. Cave discharge calculation for both chambers.
Parameters Chamber 1 Chamber 2
Average rainfall (mm yr−1) 1106 Average infiltration (mm yr−1) 696.27
Studied ceiling area (m2) 30.4 (9.5 m×3.2 m) 55.2 (8.0 m×6.9 m)
Total number of stalactites 1909 2023
Density of stalactites per m2 68 37
Proportion of active stalactites (%) 57 76
Total flux volume (m3yr−1) 25.6 64.7
Flux per m2(mm yr−1) 840 1170
Equivalent area on ground surface (m2) 36.8 92.9
Qcombined=ncombinedqcombined,
Qsoda-straw=nsoda-strawqsoda-straw. (1) The total discharge (Q)is obtained by summing the flux for all categories:
Q=Qicicle= +Qfracture+Qcombined+Qsoda-straw. (2) We predict total cave discharge amount within the monitored ceiling area of both chambers using total drip counts and flow types categorized by the morphological analysis. Ta-ble 3 demonstrates the summary for both chambers consid-ering all drip discharges.
Based on our LiDAR and cave drip data, we have estab-lished a conceptual model for the cave site (Fig. 10). Fig-ure 10a shows the vertical section of the entire cave with possible dune bedding and groundwater flows. In this study, we have estimated the water balance to understand the extent to which flow is focussed on the cave ceiling and to quan-tify the associated lateral flow within the Tamala limestone
[image:11.612.134.457.322.450.2]Figure 10. Representation of groundwater flow for the Tamala limestone formation in Golgotha Cave. (a) shows a vertical section of the entire cave with possible groundwater flows. (b) and (c) illustrate close views of chambers 1 and 2 labelling areas of ground surface infiltration and drip discharge from cave ceilings (in red circle). The “?” and arrows pointing to the left and right in (b) and (c) show that we cannot be sure of the precise flow route, although we are able to quantify the flow amount.
flow may be important, but it will likely also be affected by the capillary effect. A portion of this calculation may be the result of uncertainties involved in the methodology such as modelled ET or active stalactite count, but our field observa-tions of the cave ceiling support focussed flow. For example, these studied ceiling areas are dominated by karst water in-filtration compared to other ceiling portions consisting of dry and bare rock surface without any stalactite formation. More-over, focussed diffuse flow is evidenced in Golgotha Cave by saturated rock viewed in vertical cross section in the cliff face and from within the cave ceiling, by clustering of soda-straw stalactites (Treble et al., 2013). Another possible uncer-tainty source involves the process of stalactite identification and flow classification based on the morphological analysis, which controls the amount of measured flow. This is a semi-automated segmentation process where the user controls pa-rameters such as moving average window size and threshold to perform the morphology-based analysis. These parameters are adjusted to the particular cave site and, typically for seg-mentation procedures, involve a trade-off between over- and under-segmentation (Hyyppa et al., 2001). While the optimal parameters minimize both types of error, there is generally no parameter combination that results in a perfect, error-free segmentation (Mahmud et al., 2015).
The total counts of stalactites identified by morphological analysis in both chambers are around 2000, with chamber 1 being almost twice as densely populated as chamber 2 (Ta-ble 3). However, the proportion of active stalactites is higher in chamber 2, with a larger flux (per m2)that potentially sug-gests greater lateral flow dispersion in chamber 2 (Table 3). Moreover, the chamber 2 ceiling covers a greater surface area (92.9 m2), has the relatively lower ceiling elevation, and is
adjacent to the cave wall (Fig. 10). This points to an influ-ence of hydraulic gradient on water movement in this area. We suggest that this may indicate that a large portion of infil-trating water is flowing around the cave and inside the ceil-ing, rather than through it (Fig. 10c). The cave ceiling may be acting as a capillary barrier resulting in water moving along the ceiling gradient towards the lower eastern wall (Figs. 1 and 10).
6 Conclusion
soda-straw) show significant drip variations even while having a uniform nature of drip profiles, indicating differential pres-sure heads and substantial flow path variability in the overly-ing unsaturated zone.
LiDAR measurement is used to image the cave ceiling in-cluding individual stalactites. Statistical and morphological analyses of the point clouds produced by LiDAR are then used to categorize the ceiling features into different flow types. Later these flow classifications are correlated with the drip logger data to estimate the amount of cave discharge. Moreover, based on the LiDAR coordinates, we paired the locations of individual stalactites with drip loggers on the cave floor. A major advantage of using LiDAR is to up-scale/extrapolate the information to the entire cave system to estimate large-scale cave discharge, based on remote sensed data and a minimal number of drip loggers.
We observe no significant relationships between the drip logger mean discharge, skewness, and COV with overburden thickness, due to the possibility of potential unsaturated zone storage volume and increasing complexity of the karst archi-tecture. However, these properties can be used to character-ize different flow classes. The correlation matrix shows that similar flow categories are positively correlated, with a sig-nificant influence of spatial distribution. We perform the first ever attempt at recharge estimation from cave drip data. Our recharge estimate is quantitative, based on discharge data, and it is in line with measured infiltration from surface rain-fall. Therefore, in terms of the mass balance, the method seems to perform well at least at this cave site.
We hypothesize that the amount of discharge from the chamber 1 monitored area is equal to the unsaturated zone recharge within the area of limestone formation. The adja-cent chamber ceiling portion is dry around the sites, suggest-ing that infiltration is besuggest-ing focussed on the studied area of each chamber, which is further agreed on by our conceptual model (Fig. 10b and c). We find that cave discharge per m2 area is larger than the average surface infiltration (i.e. 60– 70 % of the rainfall) above the two wettest parts of the cham-bers and signify water flowing from the surrounding pref-erential paths to these areas. Infiltration is being focussed to the studied areas of each chamber, by approximately 120 and 170 % respectively. This concentrated flow behaviour is the reason for the contrast with the average surface infiltra-tion values. The majority of the cave ceiling porinfiltra-tion is dry at our cave site, suggesting the possibility of capillary ef-fects with water moving around the cave rather than passing through it, especially within studied area of chamber 2 that has relatively lower ceiling elevation and is adjacent to the cave wall. The methodology developed in this paper allows the estimation of deep infiltration without measuring rain-fall or ET. Usually, recharge is calculated based on rainrain-fall and ET. Here, we estimate the amount of cave recharge, so the method could be useful to estimate ET, which is difficult to measure. Moreover, this morphology-based flow classifi-cation technique can be applied to other cave sites to
iden-tify highly focussed areas of recharge, and can help to bet-ter estimate the total recharge volume. Nowadays, Zebedee, which is a hand-held LiDAR system (Zlot and Bosse, 2014b, a; Bosse et al., 2012), and drone-mounted systems (Kaul et al., 2016) are available, which make LiDAR technology very useful for three-dimensional mapping. Therefore, Li-DAR can be easily acquired at most of the cave sites if there is possible human access. Moreover, drip loggers have been commercially available for many years (Collister and Mattey, 2008) and are relatively cheap. Therefore, we propose relat-ing these two emergrelat-ing techniques, so that infiltration can be estimated based on LiDAR data and a minimal number of drip loggers. LiDAR can also be a handy tool in study sites which already have drip data time series (e.g. Jex et al., 2012; Markowska et al., 2015). We demonstrate that morphologi-cal properties of stalactites and drip rate monitoring are a suitable means by which to classify karst flow behaviour at a small scale, and should be the focus of future studies us-ing more spatial LiDAR data and temporal drip logger data, limited only by the size of the cave, and a wider range of limestone geologies. This would reduce the uncertainty in-volved due to the limited scale of this study and would allow for accurate identification of large-scale flow variability. At Golgotha Cave, the collection of drip logger data is ongo-ing, as well as analysis of tracers of water movement such as stable isotopes. These data will be the focus of future re-search to expand the possibility of classifying geochemical properties of drip regimes covering large-scale observation, and even describing the hydrodynamic response of the unsat-urated zone in the cave (Carrasco et al., 2006; Blondel et al., 2010; Mudry et al., 2008).
Acknowledgements. This work was supported by a scholarship from UNSW, the Gary Johnston Fund, and the research projects undertaken as part of the Australian Research Council and National Water Commission funding for the National Centre for Groundwa-ter Research and Training (NCGRT). The outcomes of this study contribute to Discovery Project DP140102059 awarded to P. C. Tre-ble.
Alan Griffiths, Andy Spate, and Anne Wood are thanked for their assistance in the field and with data access. The Department of Parks and Wildlife (WA) are thanked for their ongoing support in conducting scientific research at Golgotha Cave.
Edited by: T. P. A. Ferre
References
Arbel, Y., Greenbaum, N., Lange, J., Shtober-Zisu, N., Grodeck, T., Wittenberg, L., and Inbar, M.: Hydrologic classification of cave drips in a Mediterranean climate, based on hydrograph sep-aration and flow mechanisms, Israel J. Earth Sci., 57, 291–310, doi:10.1560/IJES.57.3-4.291, 2008.
tracers in cave drips, Earth Surf. Proc. Land., 35, 1682–1693, doi:10.1002/esp.2010, 2010.
Atkinson, T. C.: Diffuse flow and conduit flow in limestone terrain in the Mendip Hills, Somerset (Great Britain), J. Hydrol., 35, 93– 110, doi:10.1016/0022-1694(77)90079-8, 1977.
Bakalowicz, M. J. and Jusserand, C.: Etude de l’infiltration en milieu karstique par les methodes geochemiques et isotopiques Cas de la Grotte de Niaux, Bulletin du Centre d’Hydrogeologie, 1987, 265–283, 1987.
Baker, A. and Brunsdon, C.: Non-linearities in drip water hy-drology: an example from Stump Cross Caverns, Yorkshire, J. Hydrol., 277, 151–163, doi:10.1016/S0022-1694(03)00063-5, 2003.
Baker, A., Genty, D., and Fairchild, I. J.: Hydrological characterisa-tion of stalagmite dripwaters at Grotte de Villars, Dordogne, by the analysis of inorganic species and luminescent organic matter, Hydrol. Earth Syst. Sci., 4, 439–449, doi:10.5194/hess-4-439-2000, 2000.
Bates, B., Hope, P., Ryan, B., Smith, I., and Charles, S.: Key find-ings from the Indian Ocean Climate Initiative and their impact on policy development in Australia, Climatic Change, 89, 339–354, doi:10.1007/s10584-007-9390-9, 2008.
Blondel, T., Emblanch, C., Dudal, Y., Batiot-Guilhe, C., Travi, Y., and Gaffet, S.: Transit Time Environmental Tracing from Dissolved Organic Matter Fluorescence Properties in Karstic Aquifers. Application to Different Flows of Fontaine de Vaucluse Experimental Basin (SE France), Advances in Research in Karst Media, 1, 143–149, doi:10.1007/978-3-642-12486-0_22, 2010. BoM: Climate Data Online (Station 9547), Bureau of
Meteorol-ogy Melbourne, available at: http://www.bom.gov.au/climate/ data/ (last access: 26 August 2014), 2015.
Bosse, M., Zlot, R., and Flick, P.: Zebedee: Design of a Spring-Mounted 3-D Range Sensor with Application to Mobile Mapping, IEEE T. Robotics, 28, 1104–1119, doi:10.1109/TRO.2012.2200990, 2012.
Bottrell, S. H. and Atkinson, T. C.: Tracer study of flow and stor-age in the unsaturated zone of a karstic limestone aquifer, Tracer Hydrology, edited by: Hotzl, H. and Werner, A., Aa Balkema, Rotterdam, 207–211, 1992.
Carrasco, F., Andreo, B., Liñán, C., and Mudry, J.: Contribution of stable isotopes to the understanding of the unsaturated zone of a carbonate aquifer (Nerja Cave, southern Spain), C. R. Geosci., 338, 1203–1212, doi:10.1016/j.crte.2006.09.009, 2006. Collister, C. and Mattey, D.: Controls on water drop volume at
speleothem drip sites: An experimental study, J. Hydrol., 358, 259–267, doi:10.1016/j.jhydrol.2008.06.008, 2008.
Cuthbert, M. O., Baker, A., Jex, C. N., Graham, P. W., Tre-ble, P. C., Andersen, M. S., and Ian Acworth, R.: Drip wa-ter isotopes in semi-arid karst: Implications for speleothem paleoclimatology, Earth Planet. Sc. Lett., 395, 194–204, doi:10.1016/j.epsl.2014.03.034, 2014.
Dahan, O., Shani, Y., Enzel, Y., Yechieli, Y., and Yakire-vich, A.: Direct measurements of floodwater infiltration into shallow alluvial aquifers, J. Hydrol., 344, 157–170, doi:10.1016/j.jhydrol.2007.06.033, 2007.
Even, H., Carmi, I., Magaritz, M., and Gerson, R.: Timing the trans-port of water through the upper vadose zone in a Karstic sys-tem above a cave in Israel, Earth Surf. Proc. Land., 11, 181–191, doi:10.1002/esp.3290110208, 1986.
Fabuel-Perez, I., Hodgetts, D., and Redfern, J.: A new approach for outcrop characterization and geostatistical analysis of a low-sinuosity fluvial-dominated succession using digital outcrop models: Upper Triassic Oukaimeden Sandstone Formation, cen-tral High Atlas, Morocco, AAPG Bulletin, 93, 795–827, 2009. Fairchild, I. J. and Baker, A.: Speleothem Science: From Process to
Past Environments, Wiley-Blackwell, 450 pp., 2012.
Fischer, M. J. and Treble, P. C.: Calibrating climate-δ18O regres-sion models for the interpretation of high-resolution speleothem δ18O time series, J. Geophys. Res.-Atmos., 113, D17103, doi:10.1029/2007jd009694, 2008.
Ford, D. and Williams, P.: Karst Hydrogeology and Geomorphol-ogy, Wiley, 576 pp., 2007.
Friederich, H. and Smart, P. L.: The classification of autogenic per-colation waters in karst aquifers: A study in G.B. cave, Mendip Hills, England, Proceedings of the University of Bristol Speleo-logical Society, 1982, 143–159, 1982.
Genty, D. and Deflandre, G.: Drip flow variations under a stalactite of the Pere Noel cave (Belgium). Evidence of seasonal variations and air pressure constraints, J. Hydrol., 211, 208–232, 1998. Ghasemizadeh, R., Hellweger, F., Butscher, C., Padilla, I., Vesper,
D., Field, M., and Alshawabkeh, A.: Review: Groundwater flow and transport modeling of karst aquifers, with particular refer-ence to the North Coast Limestone aquifer system of Puerto Rico, Hydrogeol. J., 20, 1441–1461, doi:10.1007/s10040-012-0897-4, 2012.
Goldscheider, N. and Drew, D.: Methods in Karst Hydrogeology, Taylor & Francis, London, 264 pp., 2007.
Hyyppa, J., Kelle, O., Lehikoinen, M., and Inkinen, M.: A segmentation-based method to retrieve stem volume estimates from 3-D tree height models produced by laser scanners, IEEE T. Geosci. Remote, 39, 969–975, doi:10.1109/36.921414, 2001. Jex, C. N., Mariethoz, G., Baker, A., Graham, P., Andersen, M.,
Ac-worth, I., Edwards, N., and Azcurra, C.: Spatially dense drip hy-drological monitoring and infiltration behaviour at the Welling-ton Caves, South East Australia, Int. J. Speleol., 41, 283–296, 2012.
Kaul, L., Zlot, R., and Bosse, M.: Continuous-Time Three-Dimensional Mapping for Micro Aerial Vehicles with a Passively Actuated Rotating Laser Scanner, J. Field Robot., 33, 103–132, doi:10.1002/rob.21614, 2016.
Kogovšek, J.: Water tracer tests in the vadose zone, Tracer Hydrol-ogy, Balkema, Rotterdam, 1997.
Koons, R. D. and Helmke, P. A.: Neutron Activation Analy-sis of Standard Soils, Soil Sci. Soc. Am. J., 42, 237–240, doi:10.2136/sssaj1978.03615995004200020004x, 1978. Mahmud, K., Mariethoz, G., Treble, P., and Baker, A.: Terrestrial
Lidar Survey and Morphological Analysis to Identify Infiltration Properties in the Tamala Limestone, Western Australia, Selected Topics in Applied Earth Observations and Remote Sensing, IEEE Journal of, PP, 1–12, 10.1109/JSTARS.2015.2451088, 2015. Markowska, M., Baker, A., Treble, P. C., Andersen, M. S., Hankin,
S., Jex, C. N., Tadros, C. V., and Roach, R.: Unsaturated zone hydrology and cave drip discharge water response: Implications for speleothem paleoclimate record variability, J. Hydrol., 529, 662–675, doi:10.1016/j.jhydrol.2014.12.044, 2015.
Aus-tralia, Hydrol. Process., 21, 1737–1748, doi:10.1002/hyp.6356, 2007.
Morales, T., Fdez. de Valderrama, I., Uriarte, J. A., Antigüedad, I., and Olazar, M.: Predicting travel times and transport characteri-zation in karst conduits by analyzing tracer-breakthrough curves, J. Hydrol., 334, 183–198, doi:10.1016/j.jhydrol.2006.10.006, 2007.
Morales, T., Uriarte, J. A., Olazar, M., Antigüedad, I., and Angulo, B.: Solute transport modelling in karst conduits with slow zones during different hydrologic conditions, J. Hydrol., 390, 182–189, doi:10.1016/j.jhydrol.2010.06.041, 2010.
Mudry, J., Andreo, B., Charmoille, A., Liñán, C., and Carrasco, F.: Some applications of geochemical and isotopic techniques to hy-drogeology of the caves after research in two sites (Nerja Cave-S Spain and Fourbanne system-French Jura), Int. J. Speleol., 37, 67–74, 2008.
Pardo-Iguzquiza, E., Durán-Valsero, J. J., and Rodríguez-Galiano, V.: Morphometric analysis of three-dimensional networks of karst conduits, Geomorphology, 132, 17–28, doi:10.1016/j.geomorph.2011.04.030, 2011.
Pringle, J. K., Howell, J. A., Hodgetts, D., Westerman, A. R., and Hodgson, D. M.: Virtual outcrop models of petroleum reservoir analogues: a review of the current state of-the-art, First Break, 24, 33–42, 2006.
Raesi, E. and Karami, G.: Hydrochemographs of Berghan Karst Springs as indicators of aquifer characteristics, J. Cave Karst Stud., 59, 112–118, 1997.
Raupach, M. R., Briggs, P. R., Haverd, V., King, E. A., Paget, M., and Trudinger, C. M.: Australian Water Availability Project (AWAP): CSIRO Marine and Atmospheric Research Compo-nent: Final Report for Phase, 3, 67, 2009.
Rimon, Y., Dahan, O., Nativ, R., and Geyer, S.: Water percolation through the deep vadose zone and groundwater recharge: Pre-liminary results based on a new vadose zone monitoring system, Water Resour. Res., 43, W05402, doi:10.1029/2006wr004855, 2007.
Rotevatn, A., Buckley, S. J., Howell, J. A., and Fossen, H.: Over-lapping faults and their effect on fluid flow in different reservoir types: A LIDAR-based outcrop modeling and flow simulation study, AAPG Bulletin, 93, 407–427, 2009.
Scanlon, B. R.: Evaluation of Methods of Estimating Recharge in Semiarid and Arid Regions in the Southwestern U.S., in: Groundwater Recharge in a Desert Environment: The Southwest-ern United States, American Geophysical Union, 235–254, 2013. Sheffer, N. A., Cohen, M., Morin, E., Grodek, T., Gimburg, A., Ma-gal, E., Gvirtzman, H., Nied, M., Isele, D., and Frumkin, A.: In-tegrated cave drip monitoring for epikarst recharge estimation in a dry Mediterranean area, Sif Cave, Israel, Hydrol. Process., 25, 2837–2845, doi:10.1002/hyp.8046, 2011.
Smith, A. J., Massuel, S., and Pollock, D. W.: Geohydrology of the Tamala Limestone Formation in the Perth Region: Origin and Role of Secondary Porosity, 63, 2012.
Sophocleous, M. A.: Combining the soilwater balance and water-level fluctuation methods to estimate natural ground-water recharge: Practical aspects, J. Hydrol., 124, 229–241, doi:10.1016/0022-1694(91)90016-B, 1991.
Tooth, A. F. and Fairchild, I. J.: Soil and karst aquifer hydrologi-cal controls on the geochemihydrologi-cal evolution of speleothem-forming drip waters, Crag Cave, southwest Ireland, J. Hydrol., 273, 51– 68, doi:10.1016/S0022-1694(02)00349-9, 2003.
Treble, P. C., Bradley, C., Wood, A., Baker, A., Jex, C. N., Fairchild, I. J., Gagan, M. K., Cowley, J., and Azcurra, C.: An isotopic and modelling study of flow paths and stor-age in Quaternary calcarenite, SW Australia: implications for speleothem paleoclimate records, Quaternary Sci. Rev., 64, 90– 103, doi:10.1016/j.quascirev.2012.12.015, 2013.
Treble, P. C., Fairchild, I. J., Griffiths, A., Baker, A., Meredith, K. T., Wood, A., and McGuire, E.: Impacts of cave air ventilation and in-cave prior calcite precipitation on Golgotha Cave dripwater chemistry, southwest Australia, Quaternary Sci. Rev., 127, 61– 72, doi:10.1016/j.quascirev.2015.06.001, 2015.
White, W. B.: Karst hydrology: recent developments and open questions, Eng. Geol., 65, 85–105, doi:10.1016/S0013-7952(01)00116-8, 2002.
Williams, P. W.: The role of the subcutaneous zone in karst hydrol-ogy, J. Hydrol., 61, 45–67, doi:10.1016/0022-1694(83)90234-2, 1983.
Wilson, P., Hodgetts, D., Rarity, F., Gawthorpe, R. L., and Sharp, I. R.: Structural geology and 4D evolution of a half-graben: New digital outcrop modelling techniques applied to the Nukhul half-graben, Suez rift, Egypt, J. Struct. Geol., 31, 328–345, doi:10.1016/j.jsg.2008.11.013, 2009.
Worthington, S. R. H. and Gunn, J.: Hydrogeology of Carbon-ate Aquifers: A Short History, Ground WCarbon-ater, 47, 462–467, doi:10.1111/j.1745-6584.2008.00548.x, 2009.
Zlot, R. and Bosse, M.: Efficient Large-scale Three-dimensional Mobile Mapping for Underground Mines, J. Field Robot., 31, 758–779, 2014a.