Improved Fault Location on Distribution Network
Based on Multiple Measurements of
Voltage Sags Pattern
L. J. Awalin, H. MokhlisDepartment Electrical Engineering, Faculty of Engineering, University of Malaya.
A. H. A. Halim
UM Power Energy Dedicated Advanced Centre (UMPEDAC), Faculty of Engineering, University of
Malaya, Kuala Lumpur Malaysia
Abstract— An improvement of fault location algorithm to locate a faulted section for Three Phase to Ground Fault based on multiple measurements is presented in this paper. A new ranking approach is proposed to overcome multiple faulted section candidates. A large scale 11 kV network which comprises of 43 nodes and 5 branches are used to evaluate the proposed algorithm. The result shows that there is improvement in terms of faulted section detection in the first attempt for each additional measurement. An accurate fault distance is also achieved through averaging the fault distance from each measurement.
Keywords-Distribution network, fault location, faulted section.
I. INTRODUCTION
Uninterruptible power supply in a power distribution network is unavoidable due to various factors. One of the factors causing interruption is the occurrence of faults. Faults could occur at any time and location in the network. It is crucial to identify the location of the fault as fast as possible, so that the appropriate action can be taken. By knowing the exact fault location the affected section can be isolated so that power can be delivered to un-faulted sections. Hence, the impact of power disturbance could be minimized.
In order to detect fault location, there are several fault location methods that can be used. These methods can be classified into impedance based method, fundamental frequency method, travelling wave and knowledge based methods. Due to the complexity of distribution network which mainly comprises of non-homogenous lines/cables, method that based on impedance [1]-[4] and travelling-wave [5]-[6] may produce multiple faulted sections. Nevertheless, some attempt to reduce the multiple faulted sections had been conducted as in [2]. Both methods are more suitable to locate fault on transmission line that are equipped with monitoring devices at both end of the line.
Considering the complexity in a distribution network, knowledge based method, such as Artificial Neural Network [7], Genetic Algorithm [8], Hybrid Method [9]-[10] had been applied. These methods require information such as substation and feeder switch status, feeder measurement, atmospheric conditions, and information from real time measurement. However, for distribution network with limited real time measurement, this type of method may not be effective. Considering the limitation of real time measurement in a distribution system, our previous work had applied voltage sag
data at primary substation to determine fault location [11]-[15]. The working principle of the proposed method is by matching the pattern of the voltage sags between database and actual data. A fault close to the measurement location can be identified since it causes severe voltage sags compared to a fault that occur far away from the measurement location.
The first work was started in [11], where a faulted section is identified by matching developed voltage sags in the database with actual data. Improvement was then undertaken to determine fault distance from the sending node of the identified faulted section [12]-[13]. The fault distance is calculated by considering linear representation of voltage sag profile between two adjacent nodes in [12] and non linear in [13]. Further on, the method was tested for non-homogenous distribution network and uncertainty of fault resistance [14]. This work was implemented using the voltage sag equations based on different fault resistance. The last work in [15] discusses the influence of voltage sag pattern to the accuracy of the method.
This paper presents continuous work in improvement of the previous methods by considering any number of voltage sags measurement instead of single measurement. The motivation in doing this is that distribution network nowadays is equipped with multiple measurements in the distribution network for Power Quality data logging and also smart grid application [16]. The improvement involves new ranking reasoning and fault distance calculation. The method is tested using a large scale 11 kV network with two feeders and five branches consisting of 43 buses, which never been considered before.
This paper is organized as follows; in the following section the description of the previous method is discussed. Section III presents the improved method. The result of the proposed method is presented in Section IV. Finally, conclusion of the proposed method is described in Section V.
II. DESCRIPTION OF THE PREVIOUS METHOD
whenever the system changes. The process of locating faulted section and fault distance is described in the following section.
A. Selecting of the Faulted Section
The identification of faulted section is carried out by comparing the actual voltage sags magnitude and phase angle due to fault with the voltage sags magnitude and phase angle in the database. The possible faulted section is selected when voltage sag magnitude and phase angle lies between the voltage magnitude and phase angle values of any two adjacent nodes value as in the following:
( ) ( ) (dbase) q meas F dbase
p V V
V (1) ( ) ( ) (dbase)
q meas F dbase
p
(2)
Where:
(dbase) p
V and (dbase)
q
V are simulated voltage sags magnitude in
the database due to fault at node p and node q respectively.
(dbase) p
φ and (dbase)
q
φ are simulated phase angle in the database due to fault at node p and node q respectively.
Since a distribution network commonly comprises many parallel branches and considers single measurement, it is possible to obtain more than one faulted section. Hence, to overcome this problem, ranking reasoning algorithm is applied.
B. Ranking Reasoning Process
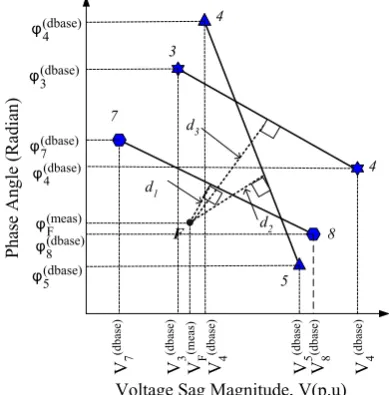
[image:2.595.341.522.247.406.2]Ranking reasoning is used for ranking the most likely to the less likely of fault location candidate. The concept of ranking is illustrated in Fig 1.
Fig.1 Phase Angle versus magnitudes for the measured voltage sag
In this figure, three sections which are 3-4, 7-8, and 4-5 were selected as the possible faulted section. The ranking
reasoning will rank these sections according to the most likely faulted section. The rank is based on the distance of the line section (d1, d2and d3). The closest will be ranked as the first
possible, followed by the second closest and so on. It is intended to facilitate the inspection crew to find the actual faulted section. Numbers of inspection follows the rank numbers at the faulted section until the actual fault section is found.
C. Fault Distance
Fault distance is determined by considering the intersection of line with the line section as shown in Fig. 1. The fault distance is determined by assuming that the length of a faulty section p
-q (any two adjacent nodes of a section) corresponds to the distance between point p and q of the voltage sags data as shown in Fig. 2.
Fig. 2 Basic concept of fault distance calculation.
The fault distance is estimated by considering the intersection of line dk (the shortest distance) to the line p-q, given the fault
distance dF from node p. The distance dF can be calculated
based on cosine rule. The shortest distance dk and fault
distance from node p, dF and actual length, Fd can be
calculated as follows:
dk sin
BCC (3)B d A l
dF pq 2 k/
(4)
length al d
Fd FRe _ (5) where;
( )/(2 )
cos 1 2 2 2
BC B C A BC
(6)
2 (dbase) (meas)
2 (meas)
(dbase) ) (V V )
(
A p F F p (7)
2 (dbase) (dbase)
2 (dbase)
(dabase) ) (V V )
(
B p q q p (8)
2 (meas) (dbase)
2 (dbase)
(meas) ) (V V )
(
C F q q F (9)
lpq is the length of cable/line for section p-q in km.
P
ha
se
A
ng
le
(
R
ad
ia
n)
Voltage Sag Magnitude, V(p.u)
V7
(d
ba
se
)
F
d3
d2 d1
7
8
5 4
3
4
V3
(d
ba
se
)
V4
(d
ba
se
)
V5
(d
ba
se
)
V8
(d
ba
se
)
V4
(d
ba
se
)
(dbase) 4
φ
(dbase) 3
φ
(dbase) 4
φ
(dbase) 7
φ
(dbase) 8
φ
(dbase) 5
φ
VF
(m
ea
s)
(meas) F
φ
F(VF(meas) ; φ F (meas))
P
ha
se
A
ng
le
,
φ
(
ra
di
an
)
Voltage Sag Magnitude, V(p.u)
A
B
C BC
dk df
) (dbase) p ; (dbase) p
P(V
) (dbase) q ; (dbase) q (V
[image:2.595.65.260.468.666.2]III. THE IMPROVED METHOD
The main problem of using single measurement in a large scale network is that voltage sag is unobservable for a fault occurring far away. This fact has been shown and discussed in details in [16]. Hence, in this paper, multiple measurements are considered.
A. Ranking Approach
Since the faulted section identification will check all databases related to a particular measurement point, there is a possibility of obtaining the same section from another database. Thus, a new ranking approach is proposed in this paper to address this problem by considering two criterions:
(i) The total number of a section i selected (NSiS). (ii) Matching section based on shortest distance (dk)
The probability of being the faulty section is higher when more sections are selected. In the case where the selection number is the same, the shortest distance (dk) will be used as
the final criterion in determining the ranking. Since multiple measurements are used, the shortest distance cannot be directly used to determine it as the faulty section. To address this issue, the average shortest distance of section i (
d
ki) can be calculated by using:NSiS
d average d
NSiS
s k
i k
i s
1 )(
(10)
Where :
i s k
d : The shortest distance for section i at selection s
NSiS : The total number of section i selected.
B. Calculation of Fault Distance
Since the improved method considers n numbers of measurements, similar section could be selected in each measurement database. To address this issue, the average fault distance of section i ( i
F
d ) is taken as follows:
NSiS
d average d
NSiS
s F i
F
i s
1 )
( (11)
and
i
F(average) d
length Real d
F (12)
Where Fd is fault distance for section i at selection s.
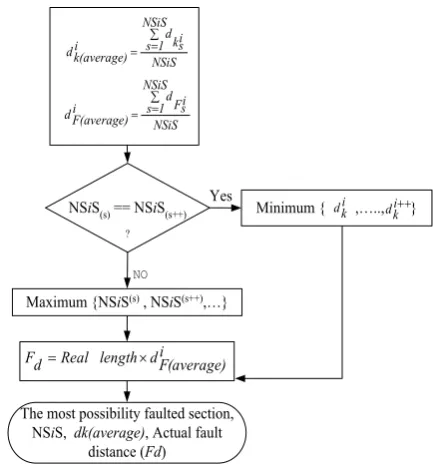
C. Algorithm of the Ranking Approach
The algorithm for ranking approach is shown in Fig. 3. The ranking process done after matching approach implemented to obtain the possibility faulted section.
Based on the value of
t
he total number of a section i selected (NSiS)and shortest
distance
( di(average)k ), the ranking process is then
developed after calculation of the shortest distance and fault distance is calculated. In the ranking approach, the NSiS is considered as the first priority. The highest NSiS of a section will be selected as the first rank. This is followed by the next highest value of the shortest distance. If the candidate have the same value of NSiS, the average of the shortest distance (
)
(average
di
k ) is considered for ranking reasoning process.
Otherwise, the minimum value of shortest distance ( )
(average
di
k ) is considered as the first rank, followed by a
[image:3.595.328.545.236.471.2]second minimum of the shortest distance. This process will stop until the maximum value of the shortest distance is achieved.
Fig. 3. The algorithm of ranking approach
Finally, the new ranking approach will generate the most possible faulted section, NSiS, average of shortest distance (
)
(average
di
k ) and actual fault distance (Fd).
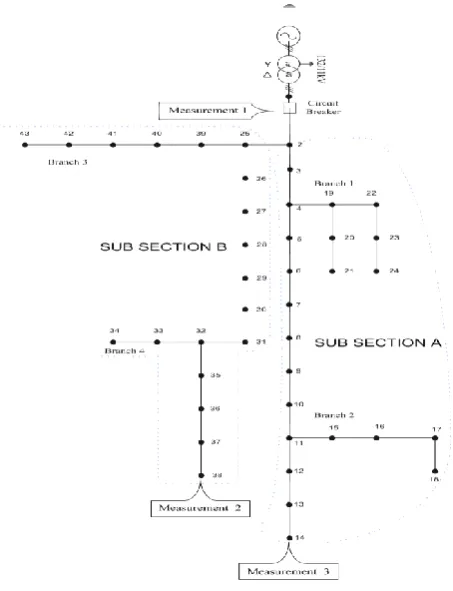
IV. TESTNETWORK
A. Test Network
The system consists of one source 132 kV representing the grid, a unit of step down 132/11kV transformer and 4 branches. The network is divided into 4 branches with a total of 41 line sections and 43 buses.
The tested network was modelled using PSCAD power system simulator software. The cables are modelled using PI model with constant impedance load. The sources are three-phase voltage source model. Since the studied distribution network is an underground cable system, faults are normally caused by permanent insulation breakdown. Hence, in the voltage sag pattern simulation, only faults with zero impedance were considered.
NSiS(s) == NSiS(s++)
?
Yes
No
The most possibility faulted section, NSiS, dk(average), Actual fault
distance (Fd) Maximum {NSiS(s) , NSiS(s++),…}
NSiS NSiS
1 s dksi i
k(average) d
NSiS NSiS
1 s dFsi i
F(average) d
i F(average) d
length Real d
F
NO
Fig. 4 11 kV distribution Network
B. Test Case: Three Phase Fault at Midpoint of Line Section
In this case, the performance of multiple measurements is investigated. Three phase to ground fault is simulated at the midpoint of all the lines between two adjacent nodes (a section). Table I shows the test results of the proposed method for a single up to three measurement points. Even though the simulation is performed on each section of the test network, only results of certain sections are presented to show the overall performance of the proposed method.
In Table I, the first column shows the tested section. The second column presents the selected possible section and the third column shows the number of section found in different database. Meanwhile, fourth and fifth column are showing the shortest distance, dk and actual fault distance (measured from a
sending node). The following column represents two and three measurements respectively.
The tested section 3-4 is taken as an example for discussion, when fault is created at midpoint of section 3-4, three possible sections were found i.e 3-4, 25-26 and 25-39. The respective shortest distance, dk and the actual fault
distance are shows in the same row. For single measurement, the NSiS always has one value. Since the real measurement will be matched with the single database, the shortest distance,
dk is considered as the main criteria in determining the ranking
of the possible faulted section. It can be seen in table I, that section 3-4 has the lowest shortest distance, dk, which makes it
to be the first rank.
For two and three measurements, the significant difference is on the NSiS. This is because section 3-4 was found more
than one at different database corresponding to one, two and three measurements. In this condition, the average of the shortest distance, di(average)
k and the average of the actual
fault distance di(average)
F are considered.
In case if the values of NSiS are equal, the ranking process will consider the average of the shortest distance di(average)
k
. This condition is applicable to subsequent measurements up to n measurements. For example, fault at mid point of section 32-35 in three measurements, the first NSiS is 2 with the average of the shortest distance value, di(average)
k of
0.000029. The second NSiS is also 2 with the value of average of the shortest distance, di(average)
k is 0.000226. The
sequence value of average actual fault distance, di(average)
F
will follow the ranking based on NSiS and di(average)
k .
C. The overall Performance.
Fig. 5 represents the overall performance of multiple measurements. It can be seen that the improvements for section selected in the first rank. For single measurement, the total number of section in the first rank is 68.3%. This number increases tremendously to 75.6% and 87.8% for two and three measurements respectively. The number possibilities of faulted sections are also reduced by adding measurement. Based on one measurement, there is 21.9% (9 sections) undetected. However, with additional measurement, all the faulty sections were successfully located.
[image:4.595.336.526.509.704.2]The improvement by adding measurement is possible because a fault near to the measurement location generate more severe voltage sag compared to a fault occurs far away from the measurement location. Therefore, if more measurements are placed in the distribution systems, a fault that is closer to the measurement nodes will likely generate more accurate results. Another reason is, by considering the total number of section i selected (NSiS) from several measurements, the accuracy of fault location detection can be improved.
Fig. 5. Ranking performance of Multiple Measurements 63.4
80.5
90.2
9.8
4.9
7.3 4.9
2.4 26.8
9.8
0 10 20 30 40 50 60 70 80 90 100
1 2 3
er
ro
r
p
er
ce
nt
ag
e
o
f
th
e
c
or
re
ct
se
ct
io
n
Number of Measurement
First Ranking Second Ranking
Third Ranking Fourth Ranking
TABLE I. SELECTED FAULT SECTION Test
Section Possible Measurement 1 Measurement 2 Measurement 3
Section NSiS dk Fd PossibleSection NSiS dk Fd PossibleSection NSiS dk Fd
Main Feeder
3-4 3-4
25-26 25-39 1 1 1 0.000606 0.001317 0.001996 2.709532 1.980896 1.847840 11-15 4-19 2-25 3-4 25-26 25-39 1 1 1 1 1 1 0.000000 0.000000 0.000000 0.000606 0.001317 0.001996 0.000000 0.000000 0.000000 2.709532 1.980896 1.847840
3-4
11-15 4-19 2-25 25-26 25-39 39-40 2 1 1 1 1 1 1 0.000355 0.000000 0.000000 0.000000 0.001317 0.001996 0.070031 2.662632 0.000000 0.000000 0.000000 1.980896 1.847840 3.624959
20-21 20-21
22-23 6-7 27-28 42-43 1 1 1 1 1 0.000134 0.000179 0.000339 0.001498 0.003454 2.070126 1.521514 2.022495 3.856183 0.848212
20-21
22-23 6-7 27-28 42-43 25-26 25-39 2 2 1 1 1 1 1 0.000088 0.000120 0.000339 0.001498 0.003454 0.041930 0.118152 2.110795 1.582403 2.022495 3.856183 0.848212 3.662389 2.068671
20-21
22-23 6-7 27-28 42-43 25-26 25-39 3 3 2 1 1 1 1 0.000186 0.000214 0.000331 0.001498 0.003454 0.041930 0.118152 2.127270 1.603690 2.120182 3.856183 0.848212 3.662389 2.068671 Branch 2
16-17 - - - - 16-17
4-19 2-25 1 1 1 0.000025 0.009981 0.054668 2.587860 3.403909 4.324226
16-17
4-19 2-25 2 1 1 0.000018 0.009981 0.054668 2.587328 3.403909 4.324226 Branch 4
33-34 33-34 1 0.000033 2.306976 33-34 2 0.000070 2.330190 33-34
2-3 25-39 3 1 1 0.000048 0.100757 0.148386 2.337865 4.975509 5.112207 Main Feeder
32-35 32-35
32-33 1
1 0.000026 0.000307 2.010710 1.698106 32-35 32-33
2
2 0.000029 0.000226 2.038412 1.887560 32-35 32-33
2
2 0.000029 0.000226 2.038412 1.887560
Branch 3
40-41 40-41
19-22 19-20 5-6 26-27 1 1 1 1 1 0.000063 0.003753 0.003794 0.003854 0.005888 1.689554 2.942212 2.875931 3.770935 5.250681
40-41
19-22 19-20 5-6 26-27 27-28 2 1 1 1 1 1 0.000060 0.003753 0.003794 0.003854 0.005888 0.058724 1.705660 2.942212 2.875931 3.770935 5.250681 1.456757
40-41
19-22 19-20 5-6 26-27 4-19 4-5 27-28 3 1 1 1 1 1 1 1 0.000061 0.003753 0.003794 0.003854 0.005888 0.028138 0.029211 0.058724 1.711729 2.942212 2.875931 3.770935 5.250681 1.414417 1.324308 1.456757
42-43 42-43
20-21 22-23 6-7 27-28 1 1 1 1 1 0.000093 0.003985 0.004026 0.004367 0.005166 2.589849 3.943842 3.523859 3.777177 5.602295
42-43
20-21 22-23 6-7 27-28 28-29 2 1 1 1 1 1 0.000103 0.003985 0.004026 0.004367 0.005166 0.045871 2.621050 3.943842 3.523869 3.777177 5.602295 4.276163
42-43
20-21 22-23 6-7 27-28 28-29 3 1 1 1 1 1 0.000102 0.003985 0.004026 0.004367 0.005166 0.045871 2.629456 3.943842 3.523859 3.777177 5.602295 4.276163
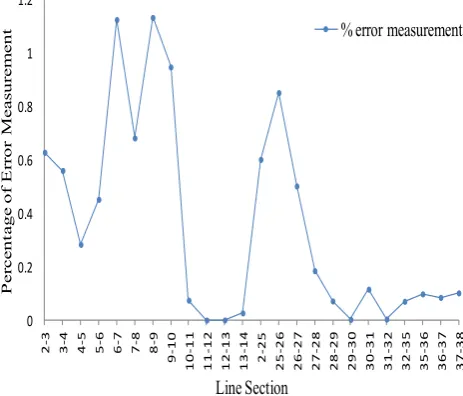
D. Fault Distance Error
The accuracy of the obtained fault distance is also presented in this section. The percentage error of fault distance can be calculated from the difference between the actual distance,
d(Actual) with the calculated actual fault distance, F
d over the
length of main feeder, where
100 feeder main of length F d % ) (
actual d
error
(12)
The percentage of fault distance error for three phase fault at the mid point of main feeder is shown in Fig. 6. This result is based on three numbers of measurements. The highest value of percentage fault distance error is obtained in section 8-9 (1.134119 %), which is equal to 0.582 km or 581.8 meter of error. This value is considered acceptable in practice.
However, the location of fault is correctly located at section 8-9 in the first attempt. Thus, the tested result proves that the multiple measurements method generates high accuracy of the
fault distance. Fig. 6. Fault Distance Estimation Error
0 0.2 0.4 0.6 0.8 1 1.2 2 -3 3 -4 4 -5 5 -6 6 -7 7 -8 8 -9 9 -10 10 -11 11 -12 12 -13 13 -14 2 -25 25 -26 26 -27 27 -28 28 -29 29 -30 30 -31 31 -32 32 -35 35 -36 36 -37 37 -38 P e rc e nt a ge of E rr or M e a sur e m e nt Line Section
[image:5.595.313.545.473.671.2]V. CONCLUSSION
A fault location method based on voltage sags measurement is presented in this paper. Different from previous method, this improved method is able to utilise any number of measurement in distribution system. Ranking approach is improved by considering the number of possible faulted section (NSiS) and average of the shortest distance (
)
(average
di
k ).
The method has been tested in a real time simulation by using PSCAD power system simulator. An actual 11kV rural distribution network, with one feeder was used as the tested system. The network consists of 43 nodes and 5 branches. The final result of multiple measurements is considered to obtain the percentage of error. The fault distance using multiple measurements approach is promising as most of test results are shown in the first rank. Extending this approach to determine fault distance when fault occurs at midpoint of the faulted section on the distribution network is proven to work as well. In the future work, this method will be improved to consider fault resistance, loading variation, error in measurement and distributed generation.
ACKNOWLEDGMENT
This work was supported by University of Malaya, Kuala Lumpur under UMRG research Grant (Grant code: RG077/09AET)
REFERENCES
[1] M. J. I. Sadinezhad, " An Adaptive Precise One End Fault Location in Transmission Lines Based on Hybrid Complex Least Error Squares Algorithm and Adaptive Artificial Neural Networks," International Review of Electrical Engineering, vol. 3, p. 7, Oct 2008.
[2] G. M.-F. Morales-Espana, J. Vargas-Torres, H., "Elimination of Multiple Estimation for Fault Location in Radial Power Systems by Using Fundamental Single-End Measurements," Power Delivery, IEEE Transactions on, vol. 24, pp. 1382-1389, 2009.
[3] K. Ramar and E. E. Ngu, "A new impedance-based fault location method for radial distribution systems," in Power and Energy Society General Meeting, 2010 IEEE, 2010, pp. 1-9.
[4] A. M. Rasli A Ghani, Hussain Shareef, "ANFIS Approach for Locating Precise Fault Points with Coordinated Geometries in a Test Distribution System," EuroJournals Publishing, vol. 35, 2009.
[5] A. C. Borghetti, S. Nucci, C. A. Paolone, M. Peretto, L. Tinarelli, R., "On the use of continuous-wavelet transform for fault location in distribution power systems," International Journal of Electrical Power & Energy Systems, vol. 28, pp. 608-617, 2006.
[6] A. B. Borghetti, M. Di Silvestro, M. Nucci, C. A. Paolone, M., "Continuous-Wavelet Transform for Fault Location in Distribution Power Networks: Definition of Mother Wavelets Inferred From Fault Originated Transients," Power Systems, IEEE Transactions on, vol. 23, pp. 380-388, 2008.
[7] J. d. V. Coser, D. T. Rolim, J. G., "Design and Training of Artificial Neural Networks for Locating Low Current Faults in Distribution Systems," in Intelligent Systems Applications to Power Systems, 2007. ISAP 2007. International Conference on, 2007, pp. 1-6.
[8] P. P. Bedekar, Bhide, Sudhir R, Kale, Vijay S., "Fault section estimation in power system using Hebb's rule and continuous genetic algorithm,"
International Journal of Electrical Power & Energy Systems, vol. 33, pp. 457-465, 2011.
[9] R. H. d. O. Salim, K. Filomena, A. D. Resener, M. Bretas, A. S., "Hybrid Fault Diagnosis Scheme Implementation for Power Distribution Systems Automation," Power Delivery, IEEE Transactions on, vol. 23, pp. 1846-1856, 2008.
[10] P. J. J. Moshtagh, "High Impedance Fault Location for Aged Power Distribution Cables Using Combined Neural Networks & Wavelet Analysis," International Review of Electrical Engineering, vol. 4, p. 8, 2009.
[11] H. Mokhlis, H. Y. Li, Khalid A. R, "The Application of Voltage Sags Pattern to Locate a Faulted Section in Distribution Network,"
International Review of Electrical Engineering-Iree, vol. 5, pp. 173-179, 2010.
[12] H. Mokhlis, A. H. A. Bakar, D. N. A. Talib , Hasmaini Mohamad, "The Improvement of Voltage Sags Pattern Approach to Locate a Fault in Distribution Network," International Review of Electrical Engineering, vol. 5, p. 5, June 2010.
[13] H. Mokhlis, H. Y. Li, "Non-linear representation of voltage sag profiles for fault location in distribution networks," International Journal of Electrical Power & Energy Systems, vol. 33, p. 6, January 2011. [14] H Mokhlis, Hasmaini Muhamad, H. Y. Li, A. H. A. Bakar, "A
Comprehensive Fault Location Estimation Using Voltage Sag Profile for Non-Homogenous Distribution Networks," International Review of Electrical Engineering, vol. 5, p. 6, October 2010.
[15] H. Mokhlis, Hasmaini Muhamad, A. H. A Bakar, H. Y. Li, " Evaluation of Fault Location based on Voltage Sags Profiles: a Study on the Influence of Voltage Sags Patterns," International Review of Electrical Engineering, vol. 6, p. 6, April 2011.