Technology (IJRASET)
©IJRASET 2015: All Rights are Reserved
142
Human Activity Recognition through
Accelerometer Sensor Using Data Mining
LakshmikanthaK.S1, M. V. Achutha2, N.V. Raghavendra3, Madhushekar4
1,2,3
Faculty , Research Scholar 4, Dept. of Mechanical Engineering The National Institute of Engineering, Mysuru, Karnataka, India.
Abstract— Balance is the key phenomenon to maintain human body in good health which requires correct human calorie
intake and calorie burning. Humans performs various activity during the day, each activity performed burns different amount of calories depending on the weight of the person. Accelerometers are widely being used to detect human activity data measurement capability. Many android applications using accelerometer are available on smart phones which have wide visibility and potential market place for creation of new health care applications. An attempt is made in this paper to classify different human activities using data mining through six tri-axial accelerometer mounted over human body. The classification parameters used in this study are mean and standard deviation of each activity. Five different classification algorithms like J48, Naïve bayes, Random forest, random tree, multilayer perceptron were tested, and the best algorithm was determined.
Keywords— Accelerometer, Physical activity monitoring, Data mining, Classification, Wearable sensor
I. INTRODUCTION
Human activity recognition has received considerable interest recently because of its potential applications in a wide range of fields such as biomechanics, ergonomics, remote monitoring of physically or mentally disabled, elderly, children, detecting and classifying falls, medical diagnosis and treatment, home-based rehabilitation, animation and film making, computer games, manufacturing industry, professional simulators and virtual reality. The physical dimensions of life that includes health, physical function and energy and vitality contribute in a very significant way to quality of life [1]. While wearable sensor systems based on inertial sensors have clear benefits in these applications, sensor measurement anomalies such as displacement are key limitations that constrain their wide-spread use. To implement activity recognition, current systems often require that sensors must be attached at predefined positions to discriminate between different actions [2] .
In this paper, several classification methods are tested on 17 different daily and sports activities using the data acquired from accelerometer(ACC) sensors worn on six different parts of the body. To implement activity recognition, current systems often require that sensors must be attached at predefined positions over the human body to discriminate between different actions [3]. Inertial sensors are self-contained, non-radiating, non-jammable, dead-reckoning devices that provide dynamic motion information through direct measurements [4]. Various features are extracted from the accelerometer sensor signals and an unsupervised feature transformation method is used that maps the original feature space to another feature space where the most informative features can be determined. The results are evaluated in terms of correct classification rates.
II. CLASSIFIEDACTIVITIESANDEXPERIMENTALMETHODOLOGY
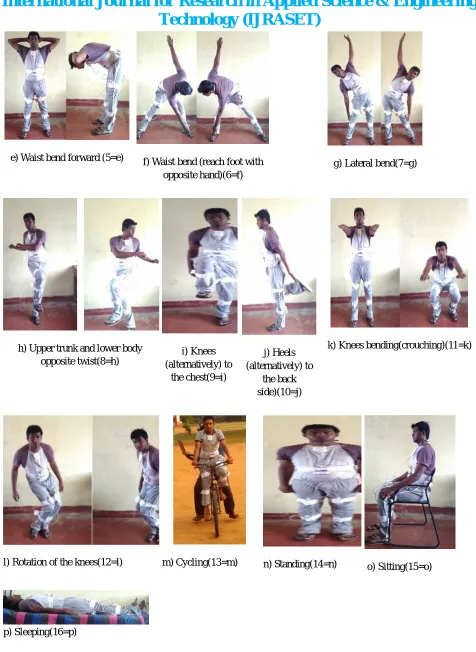
Six accelerometer sensors are placed on the subject’s body as shown in figure 1. Each sensor node provides tri-directional acceleration measurement. Thus each sensor outputs 3 values at each measurement. This leads to an overall set of 18 recorded signals. The recordings were sampled at 50Hz. The 17 activities / classes that are classified using body-worn miniature accelerometer sensor units are: Walking(1-a), Jogging(2-b), Running(3-c),Trunk twist(4-d),Waist bend forward(5-e),Waist bend (reach foot with opposite hand)(6-f),Lateral bend(7-g),Upper trunk and lower body opposite twist(8-h),Knees (alternatively) to the chest(9-i),Heels (alternatively) to the back side)(10-j), Knees bending(crouching)(11-k), Rotation of the knees(12-l), Cycling(13-m), Bike Ridding(14-n), Sleeping(15-o), Standing(16-p), Sitting(17-q).
Technology (IJRASET)
©IJRASET 2015: All Rights are Reserved
143
placed on the thigh, the remaining unit is placed on the subject’s chest and stomach. The six accelerometer sensors are connected with wire to a device called the master which is attached to the subject’s stomach. The master contains arduino uno (a microcontroller board based on the ATmega328) which receives all sensors data [5]. The data is sent to a computer via USB port through serial communication. Each activity listed above is performed by 13 different subjects for 17 activities / classes to obtain 221 datasets. The subjects are asked to perform the activities in their own manner, before performing each test they have been shown the procedure for performing the said activity through video tutorials. Photograph of the each activities are shown in figure 2.
A. Nomenclature
Chest (C) Stomach (S) Left calf (LC) Right calf (RC) Left thigh (LT) Right thigh (RT)
Fig(1): Sensor Locations
Each activity listed above is performed by 13 different subjects for 17 activities / classes to obtain 221 datasets. The subjects are asked to perform the activities in their own manner, before performing each test they have been shown the procedure for performing the said activity through video tutorials. Photograph of the each activities are shown in figure 2.
a) Walking(1=a) b)Jogging(2=b) c) Running(3=c) d) Trunk twist(4=d)
C
S
LT RT
Technology (IJRASET)
©IJRASET 2015: All Rights are Reserved
144
e) Waist bend forward (5=e) f) Waist bend (reach foot with
opposite hand)(6=f)
g) Lateral bend(7=g)
h) Upper trunk and lower body opposite twist(8=h)
i) Knees (alternatively) to
the chest(9=i)
j) Heels (alternatively) to
the back side)(10=j)
k) Knees bending(crouching)(11=k)
l) Rotation of the knees(12=l) m) Cycling(13=m) n) Standing(14=n) o) Sitting(15=o)
p) Sleeping(16=p)
[image:4.612.67.543.48.700.2]Technology (IJRASET)
©IJRASET 2015: All Rights are Reserved
145
III. CLASSIFICATIONTECHNIQUES
The classification techniques used in this study are briefly reviewed in this section. In classification technique algorithm proceed as follows. First, examine the data set containing both the predictor variables and the target variable. In this way, the algorithm “learn about” which combinations of variables are associated. Then the algorithm would look at new records and classify them based on the learning’s. [6] Following algorithms were selected for this research;
Naïve Bayes J48
Random forest Random tree Multilayer perception
A. Naive Bayes (NB)
Naive Bayes classifier is based on the Bayes theorem and calculates the posterior probabilities according to the probabilistic models of each class. In this method, the probability density function is modeled as a normal distribution whose parameters (mean and variance) are estimated by maximum likelihood estimation.
B. J48
J48 builds decision trees from a set of labeled training data using the concept of normalized information gain. This concept is a splitting criterion that is used for selecting the feature that most effectively splits the given set of feature vectors at a tree node.
C. Random Forest
Random forests are a combination of tree predictors such that each tree depends on the values of a random vector sampled independently and with the same distribution for all trees in the forest. The forest is constructed using the bagging method along with random feature selection at a node. The rule at each node is determined using normalized information gain similar to J48 algorithm. Once the trees are constructed, each tree casts a unit vote for the most popular class at a given input. The parameters for this method are the number of random features to select from at a node and the number of trees in the forest.
D. Random Tree
A random tree is a tree drawn at random from a set of possible trees .In this context"at random" means that each tree in the set of trees has an equal chance of being sampled. Another way of saying this is that the distribution of trees is uniform distributions.
E. Multilayer Perception
A multilayer perceptron (MLP) is a feed-forward artificial neural network model that maps sets of input data onto a set of appropriate outputs. A MLP consists of multiple layers of nodes in a directed graph, with each layer fully connected to the next one. Except for the input nodes, each node is a neuron (or processing element) with a nonlinear activation function. MLP utilizes a supervised learning technique called back propagation for training the network. MLP is a modification of the standard linear perception and can distinguish data that are not linearly separable.
IV. DATASETDESCRIPTION A. Activity Set
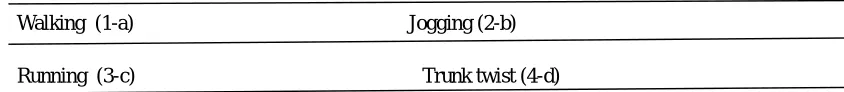
[image:5.612.68.490.647.693.2]The dataset consists of a set of typical warm up, fitness and cool down exercises which are summarized in Table (1). Table 1: Warm up, cool down and fitness exercises considered for the activity set
Walking (1-a) Jogging (2-b)
Running (3-c) Trunk twist (4-d)
Technology (IJRASET)
©IJRASET 2015: All Rights are Reserved
146
Lateral bend (7-g) Upper trunk and lower body opposite twist (8-h)
Knees (alternatively) to the chest (9-i) Heels (alternatively) to the back side (10-j)
Knees bending(crouching) (11-k) Rotation of the knees (12-l)
Cycling (13-m) Bike ridding (14-n)
Sleeping (15-o) Standing (16-p)
Sitting (17-q)
B. Sensor Ordering
[image:6.612.82.528.566.725.2]Tri-axialsensorsreadings arecaptured one at a time in the sequence mentioned in table 2.
Table 2: The ordering of the sensors.
LC LT RT C RC S
C. The Column Order
Each sensors mentioned in table-2 are read with Z-axis, Y-Axis and then X-axis for the corresponding accelerometer readings as mentioned in table 3.
Table 3: The column order for any given sensor.
ACC:Z axis ACC:Y axis ACC:X axis
V.DATASETEVALUATION
Six accelerometer sensor measurement units are distributed on the subject’s body as shown in Fig 1. Each sensor node provides tri-directional acceleration measurements as well as orientation estimates in quaternion format. The recordings were sampled at 50 Hz. Each activities mean and standard deviations re measured, then the file is converted to attribute–relation file format (arff). Wakato environment for knowledge analysis (weka) [7] software is used to calculate the error rate, classification instances and time taken
to execute the classification of five algorithms like J48, Naïve Bayes, Random Forest, Random Tree, Multilayer Perceptron. Table (4) and Fig (3) Shows the error rate of these five algorithms. In this classification, for different percentage of data the error rate is calculated for all five algorithms. The best algorithm is selected by comparing the error rate among five algorithms.
Table 4: Accelerometer sensor dataset error rate in different algorithms
% of Data J48 Naïve Bayes RandomForest RandomTree MultilayerPerceptron
90 34.19 39.5 41.27 47.95 33.15
80 33.16 41.57 44.59 54.69 36.59
70 35.32 43.85 45.51 59.9 38
60 37.95 45.61 49.26 65.69 42.36
50 41.13 48.37 52.82 70.25 45.12
40 46.85 53.59 55.08 67.21 52.17
30 56.11 62.1 61.47 73.67 59.57
20 68.93 71.05 68.86 76.61 67.92
Technology (IJRASET)
[image:7.612.156.455.80.252.2]©IJRASET 2015: All Rights are Reserved
147
Fig 3: Accelerometer sensor dataset error rate in different algorithms
Using weka software the training dataset and the class label are provided for training the algorithm. The test dataset which is different from training dataset is generated without providing class labels. Comparison is made to determine best algorithm. Table (5) shows the classified instances in percentage in different algorithms. Table (6) shows the time taken to execute this process. Matrix (1), (2), (3), (4) and (5) shows the wrong classification of five algorithms.
Table 5: Classified Instances
Classification J48 Naive Bayes Random Forest Random Tree Multilayer Perceptron
Correctly classified Instances of 221 instances
210 186 221 221 215
% Correctly classified
95.02% 84.16% 100% 100% 97.29%
Incorrectly classified Instances of 221 instances
11 35 0 0 6
% Incorrectly classified
4.98% 15.84% 0% 0% 2.71%
Random forest and Random tree can able to classify all the instances correctly, secondly Multilayer perceptron, then J48 and at last Naïve Bayes algorithm.
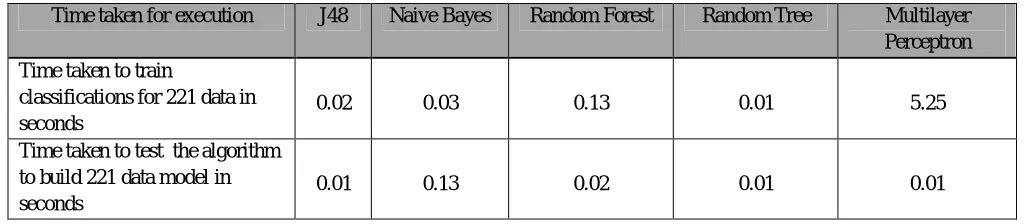
Table 6: Time taken to execute the classification technique
Time taken for execution J48 Naive Bayes Random Forest Random Tree Multilayer
Perceptron Time taken to train
classifications for 221 data in seconds
0.02 0.03 0.13 0.01 5.25
Time taken to test the algorithm to build 221 data model in seconds
0.01 0.13 0.02 0.01 0.01
[image:7.612.50.562.586.698.2]Technology (IJRASET)
©IJRASET 2015: All Rights are Reserved
148
performed using the training dataset, testing time is relatively low for all the algorithms except Naïve Bayes algorithm. Test instances are fed to the algorithm are shown in rows in the classification matrix starting a=1 to q=17. Corresponding classification from the algorithm are shown in columns from a to q. For correct classification the diagonal elements must show 13 because of 13 subject activities are being classified.
Matrix 1: Classification matrix of J48 algorithm.
The above matrix shows the correct & wrong classifications made for J48 algorithm. For example, walking (a=1) instance has been wrongly classified for one subject as rotation of the knees (l=12). Similarly wrong classifications have been observed in d = 4, g = 7, h=8, i=9, j=10, m=13, n=14 & o=14.
Matrix 2: Classification matrix of Naïve bayes algorithm.
Technology (IJRASET)
©IJRASET 2015: All Rights are Reserved
149
7, h=8, i=9, j=10, k=11, l=12, m=13, n=14 & o=14
Matrix 3: Classification matrix of Random forest algorithm.
The above matrix shows the correct & wrong classifications made for of Random forest algorithm. All the instances are correctly classified.
Matrix 4: Classification matrix of Random tree algorithm
Technology (IJRASET)
©IJRASET 2015: All Rights are Reserved
150
Matrix 5: Classification matrix of Multilayer perceptron algorithm.
The above matrix shows the correct & wrong classifications made for of Random tree algorithm. For example, trunk-twist (d=4) instance has been wrongly classified for one subject as bike riding (n=14). Similarly wrong classifications have been observed in e = 5, m=13, n=14 & o=14.
VI. CONCLUSION
The Project presented the results of a comparative study in which features extracted from accelerometer sensor signals are used for classifying human activities. Several classification techniques are compared based on the same data set in terms of their correct classification rates. In general 100% correct classification was observed in random forest and random tree. However random tree is the best algorithm because its error rate and time taken for execution is less. Random forest stands second as classification accuracy is 100% with relatively less time consuming for training and testing, Multilayer perceptron is the third-best choice, as this gives 97.29% correct classification and the other two algorithms J48 and Naïve Bayes give 95.02% and 84.16% correct classification for the activities using tri-axial accelerometer readings.
VII.ACKNOWLEDGEMENT
I would like to thank for the financial support from Karnataka Council for Technical Upgradation (KCTU)/R&D center/2014-15, Karnataka Government order number CI-151 SPI 2013[p1] to conduct this research.
REFERENCES
[1] A Godfrey, R. Conway, D. Meagher, and G. OLaighin, Dec. 2008. “Direct measurement of human movement by accelerometry.,” Med. Eng. Phys., vol. 30, no. 10, pp. 1364–86
[2] O. Banos, M. A. Toth, M. Damas, H. Pomares, and I. Rojas, 2014. “Dealing with the effects of sensor displacement in wearable activity recognition,” Sensors (Switzerland), vol. 14, pp. 9995–10023.
[3] M. Damas, I. Rojas, O. Amft, a M. Toth, O. Baños, H. Pomares, and M. A. Tóth, 2012. “A benchmark dataset to evaluate sensor displacement in activity recognition,” Proc. 2012 ACM Conf. Ubiquitous Comput. - UbiComp ’12, p. 1026.
[4] K. Altun, B. B. Ã, and O. Tunc, 2010. “Comparative study on classifying human activities with miniature inertial and magnetic sensors,” vol. 43, pp. 3605– 3620.
[5] “Arduino - ArduinoBoardUno.” [Online]. Available: https://www.arduino.cc/en/Main/ArduinoBoardUno. [Accessed: 21-Jul-2015]. [6] D. T. Larose, 2014 Discovering Knowledge in Data: An Introduction to Data Mining, 2nd ed. Wiley Publishing.