Synthesis and Study of Optical Properties of
Thiol- Capped CdSe Quantum Dots
Deepika1, Rakesh Dhar2
1,2
Department of Applied Physics, Guru Jambheshwar University of Science &Technology, Hisar-125001, Haryana, India
Abstract- Cadmium selenide (CdSe) QDs have been synthesized in aqueous solution using 1-thioglycerol (TGH), thioglycolic acid (TGA) as stabilizers applying freezing temperature injection technique. QDs have been characterized by UV-vis absorption and photoluminescence spectroscopy (PL), TEM and FTIR spectroscopy. The smaller (app. 3 nm diameter) CdSe particles were obtained using 1- thioglycerol as capping agent; the use of thioglycolic acid as stabilizers produced larger (3.7 nm diameter) CdSe particles. The photoluminescence intensity of QDs capped with thioglycerol was low as compared to QDs capped with thioglycolic acid.
Keywords -Capping Agents, Quantum Confinement, Poly-dispersed, Luminescent
I. INTRODUCTION
Over the past few decades, there has been significant development in the fields of semiconductor nanoparticles for various applications. Quantum Dots provide advantages over organic fluorophores including good photostability, broad absorption spectra and tunable emission spectra. Among various semiconductor materials, CdSe is an important direct-band semiconductor with direct-bandgap (Eg) of 1.74 eV, having
unique optical properties resulting from quantum confinement effect and wide tuning of band gap with particle size [1], [2], [3]. Main interest in studying the CdSe QDs is related to their preparation and optical properties, which make them suitable in application such as biomedical labelling [4] solar energy conversion, photoelectronics [5] etc. Numerous method have been developed for the preparation of CdSe QDs and can be summarized mainly into two chemical routes, one is non-aqueous trioctyl phosphine/trioctyl phosphine oxide (TOP/TOPO) route, and another is aqueous route that employs use of different thiols, thioacids and amides as stabilizing agent.
For the preparation of QDs, organic molecules (viz.TGA, TGH) with both sulfhydryl and carboxyl functional groups have been widely adopted as capping molecules [6]. The sulfhydryl group can coordinate to the NPs, whereas the carboxyl group can contribute to the electrostatic stabilization
of the colloidal NPs as well as to their further surface modification for various applications [7].
In this paper the basic spectroscopic characterizations of thiol-capped QDs are presented reserving a more detailed study of some selected CdSe samples for future investigations.
II. MATERIAL AND METHOD
Cadmium acetate dehydrate (CdCl22H2O),
Thioglycolic acid (TGA), Sodium Borohydride(NaBH4),
1-Thioglycerol were from Hi Media. Selenium powder was procured from Sigma Aldrich. HPLC grade water with
resistivity of 18MΩ cm was used for the preparation of aqueous solutions.
III. SYNTHESIS OF CdSe QDs
For the synthesis of QDs, an aqueous solution of cadmium dihydrate and thioglcolic acid (HSCH2COOH) was prepared
in the 1:4 and pH of the solution was adjusted to 12 by adding 1 M solution of NaOH. The solution was deaerated using nitrogen gas (N2) bubbling for 30 minutes. NaHSe solution
was prepared by adding sodium borohydride and Se powder in 4 mL distilled water in the ratio 4:1. The reacting system was
cooled to 0ºC, in dark. During the reaction, a small outlet
from the resulting hydrogen gas. Addition of NaHSe through syringe under vigorous magnetic stirring produced bright-yellow, transparent TGA capped CdSe QDs. QDs were stored at 4 ºC to prevent agglomeration and no precipitates were observed after 30 days. The same procedure was followed to prepare thioglycerol-capped CdSe.
IV. RESULTS AND DISCUSSION
A. Characterization of QDs
UV‒visible absorption spectra were recorded on a Varian UV‒vis spectrophotometer (Cary 5000). Fluorescence emission spectra were collected on Varian fluorescence spectrophotometer (Cary Eclipse), where an excitation wavelength of 400 nm was used for all the measurements reported here. The morphology and size of QDs was determined using transmission electron microscope (TEM) (Hitachi, Model no. 7500). The IR spectrum was recorded with a Perkin Elmer spectrum (BX II) to obtain information about the surface of the quantum dots and the binding of thiol groups with CdSe QDs.
(a)
[image:3.612.248.549.103.690.2](b)
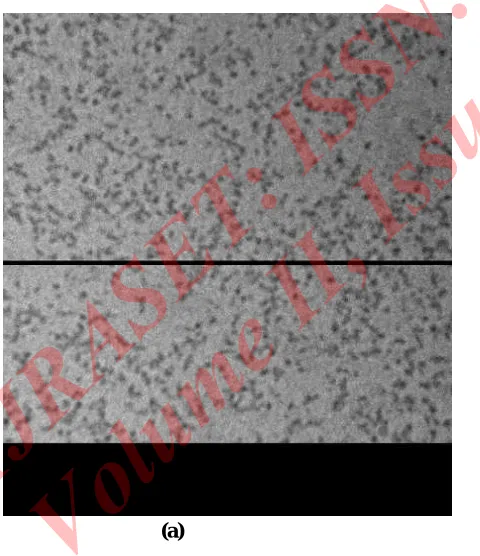
Figure 1 TEM images of QDs capped with TGA (a) capped
with TGH (b)
CdSe QDs were characterized for their physical characteristics
which included morphology/shape and FTIR. Figures 1(a)‒(b)
show TEM images of Thioglycolic Acid and 1-Thioglycerol
capped CdSe QDs. TEM images shows the presence of
dispersed QDs arranged in regular manner, nearly spherical in
[image:3.612.311.559.113.434.2]size.
Figure 2 FTIR spectra of CdSe QDs
Figure 2 shows FTIR spectra of CdSe QDs prepared with
respective capping agents. A broad absorption peak at around
3400cm-1 can be assigned to the O-H vibration, and strong
bands at 2923 cm-1is due to C-H stretching vibrations of the
alkyl chains of ligand molecules in all spectra. The absence of
4000 3500 3000 2500 2000 1500 1000 0
5 10 15 20 25 30 35 40 45 50 55
(b)
(a) (a) 1-Thiogycerol
(b) TGA
[image:3.612.44.284.403.681.2]the S-H stretching mode around 2560 cm-1 in these spectra
clearly indicates that thiol group of ligands are bound to
surface atoms of quantum dots through the Cd-S bond. It is
interesting that all of the particles show a sharp, prominent
peak due to carboxylate anions (C=O vibrations), and this
imparts a net negative charge on the outer surface of
nanoparticles, which essentially helps QDs not to coagulate
and agglomerate.
C. Optical Spectra
(a)
(b)
(c)
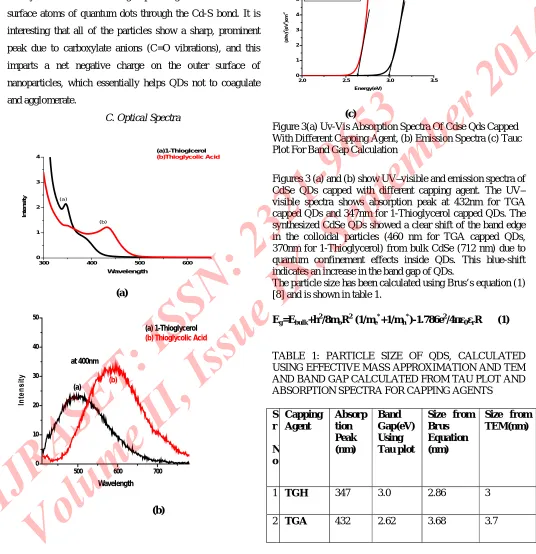
Figure 3(a) Uv-Vis Absorption Spectra Of Cdse Qds Capped With Different Capping Agent, (b) Emission Spectra (c) Tauc Plot For Band Gap Calculation
Figures 3 (a) and (b) show UV‒visible and emission spectra of CdSe QDs capped with different capping agent. The UV‒ visible spectra shows absorption peak at 432nm for TGA capped QDs and 347nm for 1-Thioglycerol capped QDs. The synthesized CdSe QDs showed a clear shift of the band edge in the colloidal particles (460 nm for TGA capped QDs, 370nm for 1-Thioglycerol) from bulk CdSe (712 nm) due to quantum confinement effects inside QDs. This blue-shift indicates an increase in the band gap of QDs.
The particle size has been calculated using Brus’s equation (1) [8] and is shown in table 1.
Eg=Ebulk+h2/8moR2(1/me*+1/mh*)-1.786e2/4πε0εrR (1)
TABLE 1: PARTICLE SIZE OF QDS, CALCULATED USING EFFECTIVE MASS APPROXIMATION AND TEM AND BAND GAP CALCULATED FROM TAU PLOT AND ABSORPTION SPECTRA FOR CAPPING AGENTS
S r N o Capping Agent Absorp tion Peak (nm) Band Gap(eV) Using Tau plot
Size from Brus Equation (nm)
Size from TEM(nm)
1 TGH 347 3.0 2.86 3
2 TGA 432 2.62 3.68 3.7
300 400 500 600
0 1 2 3 4 (a)1-Thioglcerol (b)Thioglycolic Acid (b) (a) Wavelength
500 600 700
0 10 20 30 40 50 (b) (a) (a) 1-Thioglycerol
(b) Thioglycolic Acid
at 400nm
Wavelength
2.0 2.5 3.0 3.5
[image:4.612.37.573.137.691.2]The quality of capping on CdSe quantum dots was studied using fluorescence spectroscopy. PL spectra of QDs showed an emission peak at 500nm and 590nm for thioglycerol and thioglycolic acid capped QDs, respectively (figure 3(b)).The peak are red shifted from that of their absorption edge wavelength. The difference between absorption and emission wavelength is known as Stokes shift which can be explained on the basis of Frank Condon Principle. The PL intensities of the QDs show the following increasing order: CdSe‒ Thioglycerol<CdSe‒TGA and their FWHM also increased in the same pattern. This indicates that these ligands bind too strongly to the surface of the QDs, avoiding the sharp separation of nucleation and growth under the reaction conditions employed here.
Red shifts in emission peak from the absorption edge are generally assigned to the presence of trap states in the QDs. In trap state emission electrons transition occurs between trap state and conduction/ valance band which occurs at higher wavelength than band edge emission [9].
The energy shift in photoluminescence has shown good correlation with the results obtained from other techniques such as UV‒visible absorption spectroscopy.
V. CONCLUSIONS
CdSe QDs capped with different capping agents have been synthesized using a freezing temperature injection technique, resulting in the formation of well dispersed QDs having a size in the range 3‒4 nm. It is clearly shown that the nature of capping agents affects the optical properties of QDs, 1-Thioglycerol was the most effective in achieving the lowest size and highest band gap compared to the other capping agents. TGA capped QDs show maximum photoluminescence intensity. Photoluminescence of CdSe QDs originates from trap state emission practically independent of particle size.
ACKNOWLEDGEMENT
Authors are thankful to CIL GJUS&T, Hisar and SAIF Punjab University for providing characterization facility.
REFERENCES
[1] N. Revaprasadu, S.N, “Mlondo Use of metal
complexes to synthesize semiconductor
nanoparticles,” Pure Appl Chem, 78, 1691‒1702, 2006 .
[2] D. Bera, L. Qian, T.K Tseng, P.H Holloway,
“Quantum Dots and Their Multimodal Applications: A Review”.Materials, 3, 2260-2345, 2010.
[3] T. Rajh, O.I Micic, A.J Nozik, “Synthesis and Characterization of Surface-Modified Colloidal
CdTe Quantum Dots,” J Phys Chem 97,
11999-12003, 1993.
[4] J. Drbohlavova, V. Adam, R. Kizek, J.
Hubalek,“Quantum Dots -Characterization, Preparation and Usage in Biological Systems,” Int J Mol Sci; 10, 656-673, 2009.
[5] E.B. Stokes, A.D Stiff Roberts, C.T Dameron,
“Quantum Dots in Semiconductor Optoelectronic Devices,” Electrochem Soc Interface, 15, 23- 27,
2006.
[6] L. Liu, Q. Peng, Y. Li, “Preparation of CdSe Quantum Dots with Full Color Emission Based on a Room Temperature Injection Technique,” Inorg Chem, 47, 5022-5028, 2008.
. Chem. 2008, 47, 5022-5028
[7] Y.S Park, A. Dmytruk, I. Dmitruk, A. Kasuya, M.Takeda, M. Ohuch et al,“Size-Selective Growth and Stabilization of Small CdSe Nanoparticles in Aqueous Solution,”ACS Nano, 4,121‒128, 2010. [8] L. Brus, “Electronic Wave Functions in
Semiconductor Clusters: Experiment and Theory” J Phys Chem; 90, 2555-2560, 1986.
[9] S.S.L.Sobhana , M.V. Devi, T.P. Sastry, A.B.
Mandal, “CdS quantum dots for measurement of the
size-dependent optical
properties of thiol capping”, J Nanopart Res, 13,