Worm Attack Classification Using Ensemble
Classifier and DAG
Abhishek A. Nibe1, Avinash B. Anap2, Jaydeep T. Arote3
1, 2, 3Computer Department, P. Dr. V. V. P. Institute of Technology & Engineering (Polytechnic), Loni
Abstract—the growth of internet technology spread a large amount of data communication. The communication of data compromised network threats and security issues. The network threats and security issues raised a problem of data integrity and loss of data. For the purpose of data integrity and loss of data before 20 year Anderson developed a model of Malware Classification technique. Initially Malware Classification technique work on process of satirical frequency of audit technique logs. Latter on this technique improved by various researchers and apply some other approach such as data mining technique, neural network and expert technique. Now in current research trend of Malware Classification technique used soft computing approach such as fuzzy logic, genetic algorithm and machine learning. For malware classification feature selection is important. The selection of feature in attack attributes and normal traffic attribute is challenging task. The selection of known and unknown attack is also faced a problem of classification. DAG is graph based technique used for the process of feature selection in classification. The acyclic nature of DAG select attribute on selection of entropy. The attribute entropy is high the feature value of DAG network is selected and the attribute value is low the DAG feature selector reduces the value of feature selection. After selection of feature the Gaussian kernel of support vector machine is integrated for classification.
Keywords— network threats, malware classification, feature selection, DAG, support vector machine
I. INTRODUCTION
The detection of worms is very critical process due to abnormal traffic of data and unknown number of pattern of data. Automatic detection is particularly challenging because it is difficult to predict what form the next worm will take so, an automatic detection and response is rapidly becoming an imperative because a newly released worm can infect millions of hosts in a matter of seconds. Several different types of machine learning techniques were used in the field of intrusion detection in general and worm detection in particular. Malicious ways like in the form of viruses, self-propagating worms, and denial of service attacks is a brutal threat to the internet and to the infrastructures using it for communication. The catastrophe of analysing illegitimate access of computer systems on the network which is to make out individuals who are using a computer system without permission (crackers) and those who have legal access to the system but are prevail over their privileges (insider threat) is known as intrusion detection. There is traditional detection approach known as "misuse detection" using worm’s signatures to detect the worms, but this method failed to reach the state zero-day attacks. The important step in malware analysis is a collection of specific attributes by which a malware can be characterized. Mobile malware reverse engineering provides comprehensive view on malware functionality instead of only deep analysis. However, this process is mainly manual and based purely on knowledge of the analyst in contrast to Anti-Virus (AV) software. Anti-Virus (AV) software uses signatures databases, which are hardly interpretable by average person or by court of law. Furthermore, signatures contain single measurements (or features) of parameters in time, which are discrete and targeted only on specific malware. This means that there should be used security metrics instead of pure discrete features. Some study has shown that security metrics are more suitable for human representation and abstraction of features. This is because features are mainly collected through statistical analysis while metrics are mapped by analyst.
A. Intrusion Detection Model
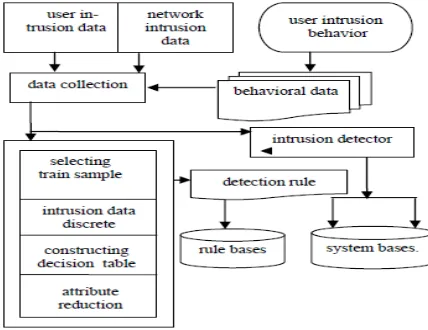
The intrusion detection model based on the attribute-weighted clustering, as shown in below figure .The model first pre-treats collection of data, chooses training samples, reduces attributes in decision tables, produces reduced output rules to construct rule base of safe system and intrusion detection detector. The initial intrusion model needs gradually perfect and improvement in subsequent studies to reach the best detection effect.
Fig 1: Intrusion Detection Model
B. Malware Detection Technique:
Malware includes viruses, worms, Trojan horses, spy-ware, and adware. A virus is a computer program that attaches itself to a host (e.g., a program file or a hard disk boot record) and spreads when the infected host is moved to a different computer. A worm is a computer program that can replicate itself and spread across a network. A Trojan horse appears to be a legitimate computer program but has malicious code hiding inside which runs when activated. Spy-ware is malware that collects and sends data copied from the victim’s computer, such as financial data, personal data, passwords, etc. Adware, or advertising- supported software, is a computer program that automatically displays ads. Soft computing embraces several computational intelligence methodologies, including artificial neural networks, fuzzy logic, evolutionary computation, probabilistic computing, and recently it is extended towards artificial immune systems, belief networks, etc. These members neither are independent of one another nor compete with one another. Rather, they work in a cooperative and complementary way. There are various soft computing and machine learning techniques which are used in malware detection. Malware is a program that has malicious intention. Whereas has defined it as a generic term that encompasses viruses, Trojans, spywares and other intrusive codes. Malware is not a “bug” or a defect in a legitimate software program, even if it has destructive consequences. The malware implies malice of forethought by malware inventor and its intention is to disrupt or damage a system.
II. RELATED WORK
A. Adaptive Worm Detection Model Based On Multi Classifiers
In this paper [1] author proposed a detection model for worm based on multi classifier and the details are, A “WDMAC” model for worm's detection using data mining techniques by combination of classifiers (Naive Bayes, Decision Tree, and Artificial Neural Network) in multi classifiers to be adaptive for detecting known/ unknown worms depending on behaviour anomaly detection approach, to achieve higher accuracies and detection rate, and lower classification error rate. Our results show that the proposed model has achieved higher accuracies and detection rates of classification, where detection known worms are at least 98.30%, with classification error rate 1.70%, while the unknown worm detection rate is about 97.99%, with classification error rate 2.01%.
B.MAP Reduce IDS Based on Particle Swarm Optimization Clustering Algorithm
C.ISMCS: An Intelligent Intrusion Sequence Based on Malware Categorization System
In this paper [3] author proposed a Malware categorization system and the description are, develop an intelligent instruction sequence based malware categorization system (ISMCS) using a novel weighted subspace clustering method. ISMCS is an integrated system consisting of three major modules: feature exactor, malware categorizer using weighted subspace clustering method and malware signature generator. ISMCS can not only effectively categorize malwares to different families, but also automatically generate the unify signature for every family. Promising experimental results demonstrate that the effectiveness of our ISMCS system outperform other existing malware categorization methods, such as K-Means and hierarchical clustering algorithms.
D.Bingraph: Discovering Mutant Malware Using Hierarchical Semantic Signature
In this paper [4] author proposes Bin Graph, a new mechanism that accurately discovers metamorphic malware. Bin Graph leverages the semantics of malware, since the mutant malware is able to manipulate their syntax only. To this end, we first extract API calls from malware and convert to a hierarchical behaviour graph that represents with identical 128 nodes based on the semantics. Later, we extract unique sub graphs from the hierarchical behaviour graphs as semantic signatures representing common behaviour of a specific malware family. To evaluate Bin Graph, we analyzed a total of 827 malware samples that consist of 10 malware families with 1,202 benign binaries. Among the malware, 20%samples randomly chosen from each malware family were used for extracting semantic signatures, and rest of them were used for assessing detection accuracy. Finally, only 32 sub graphs were selected as the semantic signatures. Bin Graph discovered malware variants with 98% of detection accuracy.
III.PROPOSEDMETHOD
A.Feature Extraction
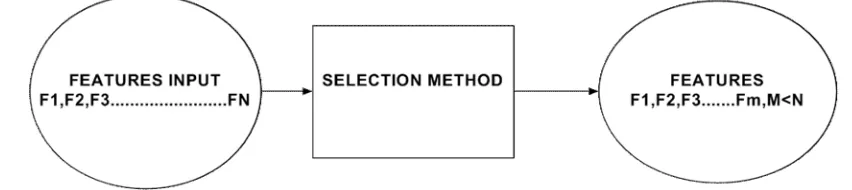
Malware classification can either have single variable approach or a multi-variable approach to detect Malware depending on the algorithm used. In the single variable approach a single variable of the system is analyzed. This can be, for example, port number, CPU usage of a local machine etc. In multi-variable approach a combination of several features and their inter-correlations are analysed. In addition based on the method the way in which features are chosen for the IDS can be divided into two groups; into feature selection and feature reduction.
[image:4.612.94.520.609.704.2]B.Support Vector Machine (SVM)
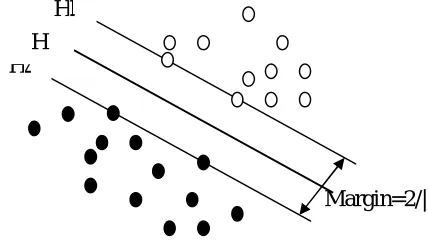
Support Vector Machine (SVM) is a novel machine learning method based on statistical learning theory developed by V.N.Vapnik, and it has been successfully applied to numerous classification and pattern recognition problems such as text categorization, image recognition and bioinformatics. It is still in the development stage now SVM can be used for pattern recognition, regression analysis and principal component analysis. The achievements of SVM in training have Platt’s the sequential minimal optimization method, Osuna’s the method of Chunking, Joachims’ SVM light method and so on. These methods are directed at the training process, and not related to classification process. In the process of SVM training, all the samples are used. So it has no effect on the speed of the classification. Lee and others propose a method of reduction SVM training time and adding the speed of training, reduced support vector machines. The method in the training process is not used in all the samples but by randomly selecting one of the subsets to train, which is through reducing the scale of training to achieve the objective of speeding up the training pace. At the same time, because of the reduction of the support vector quantity, the speed of classification is improved to some degree. However, due to the loss of some support vector classification, precision has declined, especially when the number of support vector is so many that the accuracy of its classification will decline. Burges put forward a way of increasing the speed of Classification ,which does not use the support vector in the category function but use a reduction of vector set, which is different from the standard vector set .That is neither training samples nor support vector but it is the transformation of the special vector. The method achieved certain results, but in the process of looking for the reduction of the vector collection, the cost of calculation paid is too large to widely use in practice. The concept of SVM is to transform the input vectors to a higher dimensional space Z by a nonlinear transform, and then an optical hyper plane which separates the data can be found. This hyper plane should have the best generalization capability. As shown in Figure 4.1, the black dots and the white dots are the training dataset which belong to two classes. The Plane H series
are the hyper planes to separate the two classes. The optical plane H is found by maximizing the margin value
2
/
||
w
||
. Hyperplanes
H
1 andH
2are the planes on the border of each class and also parallel to the optical hyper plane H. The data locatedon
H
1andH
2are called support vectors. [image:5.612.198.412.387.509.2]
Fig 3: The SVM binary classifications
C.Directed Acyclic Graph (DAG):
A DAG is a graph based multi-classification technique in this technique pair-wise SVMs used, let the decision function for class i against class j, with the maximal margin, be:
Where Wij is the d-dimensional vector, ∅(x) is a mapping function that maps x into the d-dimensional feature space bij is the bias term and Dij(x)= --Dji(x) The regions Ri are shown in figure 4.4 .1 with labels of class I, II and III.
If x is in Ri, we classify x into class i. if x is not in Ri(i=1,2,……,n), x is classified by voting. Namely, for the input vector x,Di(x) is calculate at follow:
Where
H
2
H
2
H
1
H
H
2
And x is classified into class
If xϵRiDi(x)=n-1 and Dk(x)<n-1 for k≠i thus x is classified into i but if any of Di(x) is not n-1,may be satisfied for plural i’s. In this case x is unclassified. In the shaded region in figure 1,Di(x)=0(i=1,2 and 3). Therefore, this region is unclassified, although the unclassified region is much smaller than that for the one-against-all support vector machine.
In pair wise SVMs, classification reduces the unclassifiable regions that occur for one-against-all support vector machines but it still exists. To resolve this problem DAG SVM uses a decision tree in the testing stage. Training of a DAG is the same as conventional pair wise SVMs.
[image:6.612.232.386.213.343.2]Classification by DAGs is faster than by conventional pair wise SVMs or air wise fuzzy SVMs. Fig 4 shows the decision tree for the three classes shown in Figure 1. In the figure, i show that x does not belong to class i.
Fig 4: DAG classification
IV.PROPOSEDMODEL
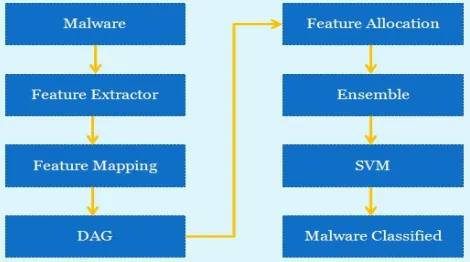
Step1: Initially input Malware data passes through pre-processing function and extracted feature part of Malware data in form of traffic type.
Step2: the extracted traffic feature data converted into feature vector.
Step 3: In phase of feature mapping in feature space of DAG create a fixed class according to the group of data. Step 4: steps of processing of DAG.
A. Initialize Gaussian hyper plane margin.
B. Choose a random vector from training data and present it to the DAG.
C. The weight of the plane support vector is estimated. The size of the vector decreases with each iteration.
D. Each vector in the SV’s neighborhood has its weights adjusted to become more like the SV. Vector closest to the SV are altered more than the vector furthest away in the neighborhood.
E. Repeat from step 2 for enough iteration for convergence.
F. Calculating the SV is done according to the Euclidean distance among the node’s weights (W1, W2, … , Wn) and the input vector’s values (V1, V2, … , Vn).
G. The new weight for a node is the old weight, plus a fraction (L) of the difference between the old weight and the input vector… adjusted (theta) based on distance from the SV.
[image:6.612.189.424.572.703.2]V. RESULTS
The results are calculated by using KDD99 DATASET. It includes 4 attacks description with their classes as shown in Table 1. TABLE 1: KDD99 Dataset
Sr. No. 4 Main Attack Classes 22 Attacks Classes
1 Probing ipsweep, nmap, portsweep, satan
2 Denial of Service (DOS) Back, lend, option, pod, smart, teardrop
3 User to Root (U2R) buffer_overflow,perl,loadmodule,rootkit
4 Remote to User (R2L) ftp_write,guess_passwd,imap,multihop,phf,spy,
warezclient, warezmaster
We are showing the consequence for the following parameters i.e. - Accuracy, Precision, Recall for data sets. Precision- Precision measures the proportion of predicted positives/negatives which are actually positive/negative. Recall -It is the proportion of actual positives/negatives which are predicted positive/negative.
[image:7.612.134.479.145.237.2]Accuracy-It is the proportion of the total number of predictions that were correct or it is the percentage of correctly classified instances.
TABLE 2: Evaluation of TPR, TNR, FPR, FNR, Detection rate, Precision rate and Recall rate for Improved Ensemble method and the input value is 0.1.
Value Types of Attacks
TPR TNR FPR FNR
EN HE PM EN HE PM EN HE IE EN HE PM
0.1
NORMAL 4.27 3.70 3.70 0.70 0.74 0.84 1.56 1.70 1.74 0.69 0.70 0.75 DOS 4.37 3.51 3.51 0.29 1.74 1.84 0.56 1.70 1.73 0.30 0.63 0.74
PROBE 4.48 2.31 2.31 1.70 1.74 1.85 0.19 0.60 0.73 0.35 0.13 1.13
U2R 5.27 3.51 3.31 0.40 0.85 0.85 1.43 0.84 0.85 0.30 1.73 1.85
[image:7.612.103.508.520.622.2]R2L 3.47 3.09 3.09 1.59 0.69 0.69 0.56 0.40 0.40 0.16 1.85 1.85
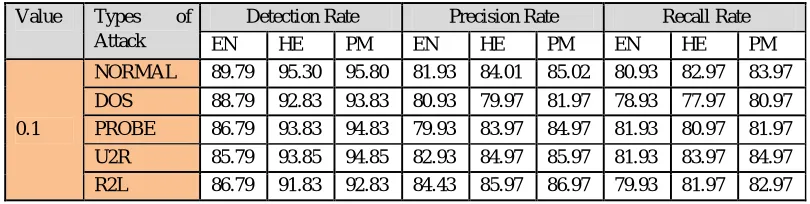
TABLE 3: Evaluation of TPR, TNR, FPR, FNR, Detection rate, Precision rate and Recall rate for Improved Ensemble method and the input value is 0.1.
Value Types of
Attack
Detection Rate Precision Rate Recall Rate
EN HE PM EN HE PM EN HE PM
0.1
NORMAL 89.79 95.30 95.80 81.93 84.01 85.02 80.93 82.97 83.97
DOS 88.79 92.83 93.83 80.93 79.97 81.97 78.93 77.97 80.97
PROBE 86.79 93.83 94.83 79.93 83.97 84.97 81.93 80.97 81.97
U2R 85.79 93.85 94.85 82.93 84.97 85.97 81.93 83.97 84.97
R2L 86.79 91.83 92.83 84.43 85.97 86.97 79.93 81.97 82.97
EN-Ensemble Method, HE-Hybrid Ensemble Method, PM- Proposed Method (Improved Ensemble Method)
VI.CONCLUSION
DAG-SVM can detect known attack types with high accuracy and low false positive rate which is less than 1%.
The proposed method classified attack and normal data of KDDCUP99 is very accurately. The proposed method work in process of making group of attack very accurately, the learning process SVM training process makes very efficient classification rate of Malware data. Our empirical result shows better performance in compression of ISMCS and another data mining technique for malware detection.
REFERENCES
[1] Tawfeeq S. Barhoom, Hanaa A. Qeshta “Adaptive Worm Detection Model Based on Multi classifiers” 2013 Palestinian International Conference on Information and Communication Technology, IEEE 2013. Pp 58-67.
[2] Ibrahim Aljarah, Simone A. Ludwig “Map Reduce Intrusion Detection System based on a Particle Swarm Optimization Clustering Algorithm” IEEE Congress on Evolutionary Computation, 2013. Pp 955-963.
[3] Kai Huang, Yanfang Ye, Qinshan Jiang “ISMCS: An Intelligent Instruction Sequence based Malware Categorization System” IEEE 2010. Pp 658-662. [4] Jonghoon Kwon, Heejo Lee “Bin Graph: Discovering Mutant Malware using Hierarchical Semantic Signatures” IEEE, 2012. Pp 104-112.
[5] P.R.Lakshmi Eswari, N.Sarat Chandra Babu “A Practical Business Security Framework to Combat Malware Threat” World Congress on Internet Security, IEEE 2012. Pp 77-81.
[6] Ahmed F.Shosha, Chen-Ching Liu, Pavel Gladyshev, Marcus Matten “Evasion-Resistant Malware Signature Based on Profiling Kernel Data Structure Objects” 7th International Conference on Risks and Security of Internet and Systems, 2012. Pp 451-459.
[7] Hira Agrawal, Lisa Bahler, Josephine Micallef, Shane Snyder, Alexandr Virodov “Detection of Global, Metamorphic Malware Variants Using Control and Data Flow Analysis” IEEE, 2013. Pp 1-6.
[8] Vinod P., V.Laxmi, M.S.Gaur, Grijesh Chauhan “MOMENTUM: MetamOrphic Malware Exploration Techniques Using MSA signatures” International Conference on Innovations in Information Technology, IEEE 2012. Pp 232-238.
[9] Robiah Y, Siti Rahayu S., Mohd Zaki M, Shahrin S., Faizal M. A., Marliza R. “A New Generic Taxonomy on Hybrid Malware Detection Technique” International Journal of Computer Science and Information Security, Vol-5, 2009. Pp 56-61.
[10] anfang Ye, Tao Li, Qingshan Jiang, Youyu Wang “CIMDS: Adapting Postprocessing Techniques of Associative Classification for Malware Detection” IEEE TRANSACTIONS ON SYSTEMS, MAN, AND CYBERNETICS, IEEE Vol-40, 2010. Pp 298-307.